Reports

- Global Locations -

Headquarters

Future Market Insights, Inc.

Christiana Corporate, 200
Continental Drive, Suite 401,
Newark, Delaware - 19713,
United States

T: +1-347-918-3531

Americas

Future Market Insights, Inc.

616 Corporate Way, Suite 2-9018,
Valley Cottage, NY 10989, United States

MEA

Future Market Insights

1602-6 Jumeirah Bay X2 Tower, Plot No: JLT-PH2-X2A,
Jumeirah Lakes Towers, Dubai,
United Arab Emirates

Europe

Future Market Insights

3rd Floor, 207 Regent Street,
W1B 3HH London
United Kingdom

T: + 44 (0) 20 8123 9659

Asia Pacific

Future Market Insights

IndiaLand Global Tech Park, Unit UG-1, Behind Grand HighStreet, Phase 1, Hinjawadi, MH, Pune – 411057, India

High Density Interconnect Market Outlook (2022 to 2032)

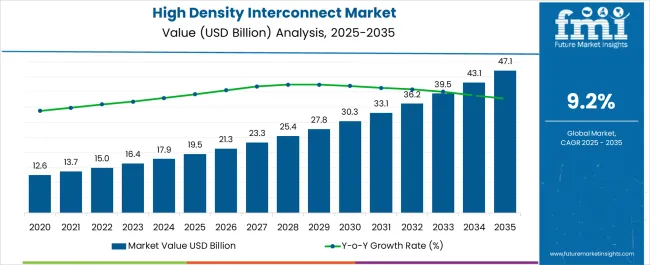
The high density interconnect market is expected to experience impressive growth in the coming decade, with a projected CAGR of 9.2% between 2022 and 2032.

The market is set to grow from a value of US$ 13.4 billion in 2021 to a value of US$ 36.0 billion by the end of the forecast period. Key drivers of this growth include technological advancements, increasing demand for consumer electronics, and the growing popularity of wearable devices.

Consumers in this market are focused on multidimensional products. In the case of wearable devices, products in demand from consumers are small and compact, but with powerful features and unique designs.

The rise of 5G and Internet of Things (IOT) has created a need for more advanced and efficient electronic components. High density interconnect technology can provide the necessary performance while also making the final product compact.

This technology can reduce the size and weight of electronic devices, which can in turn reduce the number of raw materials required for production. This can lead to sustainable and eco-friendly manufacturing processes, which is important to consumers and manufacturers alike.

The printed circuit board (PCB) segment in the high density interconnect market is changing drastically because of technical advancements. These range from traditional low-density PCBs to high-density interconnect boards, which represent huge development potential for the PCB sector.

Attributes Key Insights
High Density Interconnect Market Estimated Size (2022E) US$ 15 billion
Projected market Valuation (2032F) US$ 36 billion
Value Based CAGR (2022 to 2032) 9.2%
USA Value Based CAGR (2022 to 2032) 8%

Don't pay for what you don't need

Customize your report by selecting specific countries or regions and save 30%!

2017 to 2021 High Density Interconnect Sales Outlook Compared to Demand from 2022 to 2032

As per Future Market Insights (FMI), historically, from 2017 to 2021, the value of the high density interconnect market increased at around 12.0% CAGR. With an absolute $ opportunity of US$ 21 Billion, the market is projected to reach a valuation of US$ 36.0 billion by 2032.

The automotive sector has been at the forefront of incorporating high density interconnect market technology in recent years. The demand for high density interconnect in this industry vertical is expected to grow significantly between 2022 and 2032.

High power boards, high-density connection boards, flex PCBs, PTFE materials for high-frequency PCBs, miniaturization of PCBs, and green PCBs have recently marked an uptick in demand. They are expected to continue trending in the PCB business.

The PCB sector is primarily pushed by increased demand for PCBs in the communication industry, advancements in connected devices, and in automotive electronics.

Top High Density Interconnect Trends Listed by Future Markets Insights (FMI)

  • The key factors that are increasing the demand for high density interconnect market products are the expanding use of automotive electronics and wearable devices.
  • Advanced electronics are being rapidly used by the car industry for safety, entertainment, and other purposes.
  • Wearable gadgets such as smartwatches, fitness trackers, and medical devices are boosting demand for high density interconnect technology.
  • This technology is perfect for producing compact and lightweight circuit boards for use in wearable devices.
  • It enables the development of less bulky, but durable mobile devices with improved performance.
  • The global demand for smartphones and other mobile devices is increasing, which is boosting the requirement for high density interconnect technology.
  • The cost of generating high density interconnect circuit boards has decreased due to developments in PCB manufacturing technologies.
  • This has increased production of high density interconnect technology and has made it accessible to a broad variety of sectors.
  • High density interconnect technology has become a popular alternative for circuit board designers due to their compact nature.
Sudip Saha
Sudip Saha

Principal Consultant

Talk to Analyst

Find your sweet spots for generating winning opportunities in this market.

Which Factors are Restraining the Growth of the High Density Interconnect Market?

The factors restraining the growth of the high density interconnect market are the high cost and limited application areas. High production expenses are experienced due to this technology's need for sophisticated manufacturing processes and expensive materials. Traditional PCBs are less sophisticated than high density interconnect technology, necessitating specialist design, and manufacturing knowledge. Its acceptance in quick-paced sectors is constrained by its complexity. This can also lead to lengthier development durations and thus restrain market growth.

The designs and production methods used by several firms to create high density interconnect technology are exclusive.

Due to this, competition is restricted, and it is challenging for new competitors to enter the market which restrains the market growth. Often exclusive, high-end applications like smartphones, tablets, and other portable electronic devices typically utilize high density interconnect technology.

Which Region is Projected to Offer Significant Opportunities for High Density Interconnect Market Manufacturers?

Asia Pacific to Exhibit Significant Demand for High Density Interconnect Products by 2032

Asia Pacific is considered to have the predominant high density interconnect market throughout the projection period. The growing need for high density interconnect market products in the consumer electronics and automotive electronics sector has led to the expansion of this market in Asia Pacific.

This region is a hub for consumer electronics and is poised to grow with a high demand over the forecast years. This can be attributed to the rising demographic contribution towards digitalization and the entertainment sector.

Prominent players, like China, India, Japan, South Korea are keen on manufacturing and innovation in the sector to attract the global market. This has led to multiple opportunities for businesses willing to utilize the South Asian markets.
Get the data you need at a Fraction of the cost

Personalize your report by choosing insights you need
and save 40%!

Country-wise Insights

Why would the United States High Density Interconnect Industry Witness a Steady Growth Over the Forecast Period?

Wide Proliferation of Performance-Intensive Electronic Devices to Push Voluminous Growth of the High Density Interconnect Market

As per the recent Future Market Insights (FMI) report, the United States market will have continued growth in technological advancements and will witness increased competition.

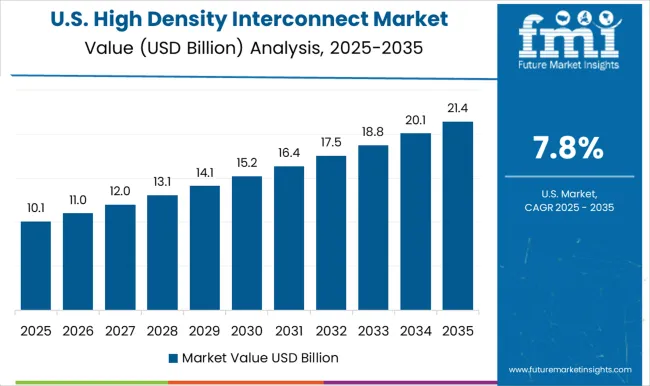
With a projected CAGR of 8% from 2022 to 2032, the high density interconnect industry in the United States is expected to continue its growth trajectory. This is likely to be driven by increasing demand for miniaturization and high-performance electronic devices in various industries. For instance, consumer electronics, automotive, and healthcare.

Industry growth will likely push for technological advancements in high density interconnects, including new materials and manufacturing techniques. This could lead to improved performance, increased reliability, and reduced costs, further driving demand for high density interconnect solutions.

With the industry expected to reach US$ 5.2 billion by the end of the forecast period, several companies are likely to enter the market. An absolute $ growth opportunity of US$ 2.8 billion is further likely to increase competition. This could drive down prices and increase innovation as companies try to differentiate themselves and gain market share.

In March 2020, Sanmina Corporation, a United States company, expanded its Thailand facility. The facility now offers sophisticated bespoke packaging and assembly capabilities. It is utilized in the production of advanced optical, high-speed, and radio frequency (RF) microelectronic assemblies and products, enhancing its existing mission-critical products.

With this increase, the networking, 5G, data center, automotive/LIDAR, aerospace, and military industries will all experience significant growth for new technological items.

Why is the United Kingdom Witnessing Skyrocketing Sales for High Density Interconnect Solutions?

Presence of Well-Established Electronic Device Manufacturers Will Fuel Market Expansion

The high density interconnect market in the United Kingdom is projected to continue its steady growth trajectory, with a CAGR of 7.6% from 2022 to 2032. This is slightly more than the growth rate from 2017 to 2021, indicating a positive trend for the industry.

The absolute $ growth of the United Kingdom high density interconnect market is expected to be US$ 483.2 million from 2022 to 2032. This indicates a strong potential for market expansion and development.

By 2032, the market is projected to be worth US$ 933.8 million, indicating a significant growth potential for the industry in the region.

In June 2022, Kestrel International Circuits Ltd was acquired by NCAB Group. Kestrel will be integrated into NCAB Group UK, which, in turn, is a part of the Europe segment within the NCAB Group. Synergies are expected in the areas of factory management, suppliers, payment terms as well as in logistics.

Will China be a Prominent Market for High Density Interconnect Technology?

The Versatile Production Systems and High Capacity to Boost Sales for China Manufacturers

The market is expected to continue growing, with a projected absolute $ growth of US$ 6.1 billion and a CAGR of 10.6% from 2022 to 2032. By 2032, the market is projected to be worth US$ 9.5 billion, which represents significant growth from its value in 2021.

The high CAGR 14.2% from 2017 to 2021 indicates that there is strong demand for high density interconnect solutions in China. This is a key factor likely to continue driving market growth ovr the forecast period.

In September 2022, Unimicron, a Chinese company, invested heavily in the manufacturing of the latest PCB technology. Copper plating technology enables the use of a wide range of materials for multilayers, as well as high density interconnect PCBs and integrated circuit (IC) substrates.

The new 48-meter-long line is outfitted with a completely automated loading and unloading mechanism as well as RFID recognition for internal traceability. It provides great versatility in terms of production capacity, copper layer thicknesses, circuit board technologies, and dimensions.

Category-wise Insights

Which Product Type of the High Density Interconnect Market is Projected to Witness Significant Growth?

Technology Innovation in 10+ Layers HDIs to Pave Way for Enhanced Demand in the Market Segment

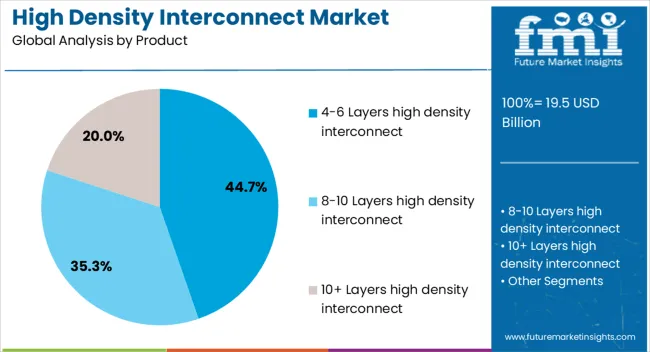
10+ Layers high density interconnect is projected to witness significant growth. The application of 10+ Layers HDIs is found in a variety of devices, including high-reliability automotive goods. High-density mobile devices, and Internet of Things (IoT) modules are also found to be responsible for this rise.

Benefits of 10+ Layers high density interconnect include its compact size, lightweight design, and increased flexibility. This kind of PCB is utilized in high density applications where greater performance and reliability are needed. It is constructed out of several smaller boards that are bonded together.

While expensive, it provides a higher level of security and dependability. It works well for applications that need a lot of power and rapid processing. The CAGR for 10+ Layers high density interconnect was around 11.8% from 2017 to 2021, and is forecasted to grow at around 9.1% through the end of 2032.

Which Application of the High Density Interconnect Market is Expected to be Highly Lucrative?

The Pressing Need by Industry 4.0 Opens Up Opportunity for Wearable Device Manufacturers

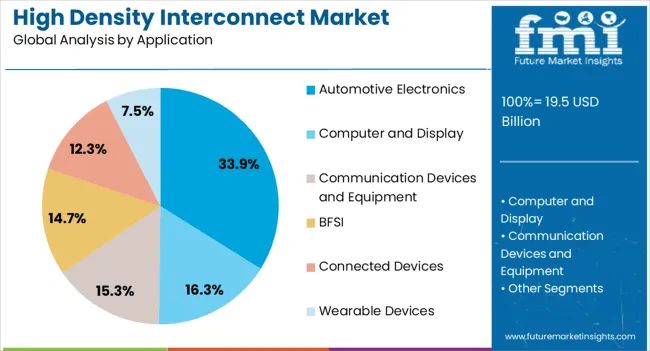
A widely used application of the high density interconnect market is wearable devices. The CAGR for wearable devices was around 11.6% from 2017 to 2021 and is forecasted to grow by 9% by the end of 2032.

The increased component density is made feasible by high density interconnect PCBs, which have extraordinary technical properties. The lightweight design and great performance of high density interconnect boards make them perfect for supplying power to wearable technology.

Additionally, the development of the high density interconnect market is anticipated to present further profitable prospects. Technical improvements, the rise in demand for industry 4.0 standards, and the emergence of industry 5.0 will be significantly responsible for this.
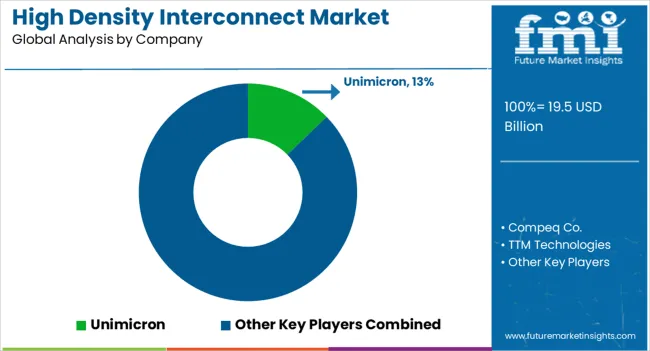
Competitive Analysis

The global demand for smartphones and other mobile devices is increasing, which is boosting the requirement for high density interconnect technology. Innovative solutions, patents and acquisitions are frequently employed by manufacturers to gain a competitive edge.

The players, who currently hold a small market share, are constantly aiming to grow their revenues in the high density interconnect market.

For instance

  • In December 2022, TTM Technologies, Inc. and Raytheon Missiles & Defense agreed to Buy SPY-6 Radar Components. The Beam Forming Network (BFN), PCBs, and specialty assemblies are all created and produced by TTM for the SPY-6 series of radars. This kind of multi-year supply commitment enables TTM, and its supply chain partners, to improve value for the customer. It also changes the way TTM supplier partners do business and increases supply chain efficiency.
  • In September 2021, Redboard Circuits was acquired by NCAB Group. RedBoard Circuits will help NCAB Group achieve its goal of being a market leader in the US PCB industry. RedBoard Circuits has increased its capacity to provide clients with personalized quality and service. It has also been expanding volume for current facilities, adding value to the North American division.

Scope of the Report

Attribute Details
Estimated Market Size (2022) US$ 15.0 billion
Projected Market Valuation (2032) US$ 36.0 billion
Value-based CAGR (2022 to 2032) 9.2%
Forecast Period 2022 to 2032
Historical Data Available for 2017 to 2021
Market Analysis Value (US$ billion)
Key Regions Covered
  • North America
  • Latin America
  • Europe
  • East Asia
  • South Asia
  • Oceania
  • Middle East and Africa
Key Countries Covered
  • The United States
  • United Kingdom
  • Germany
  • France
  • Spain
  • Italy
  • Japan
  • China
  • Singapore
  • Malaysia
  • Sri Lanka
  • Kingdom of Saudi Arabia
  • United Arab Emirates
  • South Korea
  • Finland
  • Hungary
  • Rest of the World
Key Segments Covered
  • Product
  • Application
  • Region
  • Technology
Key Companies Profiled
  • Unimicron
  • Compeq Co.
  • TTM Technologies
  • Austria Technologies and Systemtechnik ·
  • Zhen Ding Tech.
  • IBIDEN
  • MEIKO ELECTRONICS
  • FUJITSU INTERCONNECT TECHNOLOGIE
  • Tripod Technology Corp.
  • SAMSUNG ELECTRO-MECHANICS
  • Daeduck GDS Co
  • DAP Corp.
  • Korea Circuit
Report Coverage Market Forecast, Company Share Analysis, Competition Intelligence, Market Dynamics and Challenges, and Strategic Growth Initiatives

High Density Interconnect Market Outlook by Category

By Product:

  • 4-6 Layers high density interconnect
  • 8-10 Layers high density interconnect
  • 10+ Layers high density interconnect

By Application:

  • Automotive Electronics
  • Computer and Display
  • Communication Devices and Equipment
  • BFSI
  • Connected Devices
  • Wearable Devices

By Region:

  • North America
  • Latin America
  • Europe
  • Asia Pacific
  • Middle East and Africa

Frequently Asked Questions

What was the global high density interconnect market size for 2021?

The high density interconnect industry was reported at US$ 13.4 billion in 2021.

What high density interconnect value is the industry estimated to reach in 2022?

The high density interconnect market industry is estimated to be valued at US$ 15 billion in 2022.

What valuation is the high density interconnect segment expected to reach by 2032?

The high density interconnect industry is expected to reach a valuation of US$ 36 billion by 2032.

What CAGR did the high density interconnect market exhibit over the last 4 years?

The high density interconnect market registered a CAGR of 12% over the last 4 years.

What is the projected CAGR for the high density interconnect market from 2022 to 2032?

The high density interconnect market is projected to witness a CAGR of 9.2% from 2022 to 2032.

Which product type will garner significant value share by 2022?

10+ Layers high density interconnect product type is expected to garner significant value share by 2022.

At what percentage growth is sales in the high density interconnect industry expected in China?

Estimates predict that between 2022 and 2032, the high density interconnect industry in China would increase at a CAGR of around 10.6%.

At what percentage growth is sales in the high density interconnect industry expected in the United States?

Between 2022 and 2032, it is anticipated that sales of high density interconnect industry in the USA will increase at a CAGR of around 8%.

What do Statistics for South Korea and Japan Reveal?

The estimates predict that between 2023 and 2032, the high density interconnect industry in South Korea will increase at a CAGR of around 9.6% and there will be a CAGR growth of 9.4% In Japan.

What was the Market Value in 2022?

The market was valued at US$ 15 billion in 2022.

How was the Market’s Historical Performance?

The market rose at a 12.0% CAGR from 2017 to 2021.

What is the Market Growth Outlook for 2032?

Until 2032, the market is projected to experience a 9.2% CAGR.

What will be the Market Value in 2032?

The market is estimated to reach US$ 36.0 billion in 2032.

What is China's Expected CAGR over the Forecast Period?

China’s market is expected to record a CAGR of 10.6% over the forecast period.

Table of Content

1. Executive Summary | High Density Interconnect Market

    1.1. Global Market Outlook

    1.2. Demand-side Trends

    1.3. Supply-side Trends

    1.4. Technology Roadmap Analysis

    1.5. Analysis and Recommendations

2. Market Overview

    2.1. Market Coverage / Taxonomy

    2.2. Market Definition / Scope / Limitations

3. Market Background

    3.1. Market Dynamics

        3.1.1. Drivers

        3.1.2. Restraints

        3.1.3. Opportunity

        3.1.4. Trends

    3.2. Scenario Forecast

        3.2.1. Demand in Optimistic Scenario

        3.2.2. Demand in Likely Scenario

        3.2.3. Demand in Conservative Scenario

    3.3. Opportunity Map Analysis

    3.4. Product Life Cycle Analysis

    3.5. Supply Chain Analysis

        3.5.1. Supply Side Participants and their Roles

            3.5.1.1. Producers

            3.5.1.2. Mid-Level Participants (Traders/ Agents/ Brokers)

            3.5.1.3. Wholesalers and Distributors

        3.5.2. Value Added and Value Created at Node in the Supply Chain

        3.5.3. List of Raw Material Suppliers

        3.5.4. List of Existing and Potential Buyer’s

    3.6. Investment Feasibility Matrix

    3.7. Value Chain Analysis

        3.7.1. Profit Margin Analysis

        3.7.2. Wholesalers and Distributors

        3.7.3. Retailers

    3.8. PESTLE and Porter’s Analysis

    3.9. Regulatory Landscape

        3.9.1. By Key Regions

        3.9.2. By Key Countries

    3.10. Regional Parent Market Outlook

    3.11. Production and Consumption Statistics

    3.12. Import and Export Statistics

4. Global Market Analysis 2017 to 2021 and Forecast, 2022 to 2032

    4.1. Historical Market Size Value (US$ Million) & Volume (Units) Analysis, 2017 to 2021

    4.2. Current and Future Market Size Value (US$ Million) & Volume (Units) Projections, 2022 to 2032

        4.2.1. Y-o-Y Growth Trend Analysis

        4.2.2. Absolute $ Opportunity Analysis

5. Global Market Analysis 2017 to 2021 and Forecast 2022 to 2032, By Product

    5.1. Introduction / Key Findings

    5.2. Historical Market Size Value (US$ Million) & Volume (Units) Analysis By Product, 2017 to 2021

    5.3. Current and Future Market Size Value (US$ Million) & Volume (Units) Analysis and Forecast By Product, 2022 to 2032

        5.3.1. 4–6 Layers HDI

        5.3.2. 8–10 Layers HDI

        5.3.3. 10+ Layers HDI

    5.4. Y-o-Y Growth Trend Analysis By Product, 2017 to 2021

    5.5. Absolute $ Opportunity Analysis By Product, 2022 to 2032

6. Global Market Analysis 2017 to 2021 and Forecast 2022 to 2032, By Application

    6.1. Introduction / Key Findings

    6.2. Historical Market Size Value (US$ Million) & Volume (Units) Analysis By Application, 2017 to 2021

    6.3. Current and Future Market Size Value (US$ Million) & Volume (Units) Analysis and Forecast By Application, 2022 to 2032

        6.3.1. Automotive Electronics

        6.3.2. Computer and Display

        6.3.3. Communication Devices and Equipment

        6.3.4. BFSI

        6.3.5. Connected Devices

        6.3.6. Wearable Devices

        6.3.7. Others

    6.4. Y-o-Y Growth Trend Analysis By Application, 2017 to 2021

    6.5. Absolute $ Opportunity Analysis By Application, 2022 to 2032

7. Global Market Analysis 2017 to 2021 and Forecast 2022 to 2032, By End-Use

    7.1. Introduction / Key Findings

    7.2. Historical Market Size Value (US$ Million) & Volume (Units) Analysis By End-Use, 2017 to 2021

    7.3. Current and Future Market Size Value (US$ Million) & Volume (Units) Analysis and Forecast By End-Use, 2022 to 2032

        7.3.1. Automotive

        7.3.2. Consumer Electronics

        7.3.3. Telecommunications

        7.3.4. Medical

        7.3.5. Others

    7.4. Y-o-Y Growth Trend Analysis By End-Use, 2017 to 2021

    7.5. Absolute $ Opportunity Analysis By End-Use, 2022 to 2032

8. Global Market Analysis 2017 to 2021 and Forecast 2022 to 2032, By Region

    8.1. Introduction

    8.2. Historical Market Size Value (US$ Million) & Volume (Units) Analysis By Region, 2017 to 2021

    8.3. Current Market Size Value (US$ Million) & Volume (Units) Analysis and Forecast By Region, 2022 to 2032

        8.3.1. North America

        8.3.2. Latin America

        8.3.3. Europe

        8.3.4. Asia Pacific

        8.3.5. Middle East and Africa

    8.4. Market Attractiveness Analysis By Region

9. North America Market Analysis 2017 to 2021 and Forecast 2022 to 2032, By Country

    9.1. Historical Market Size Value (US$ Million) & Volume (Units) Trend Analysis By Market Taxonomy, 2017 to 2021

    9.2. Market Size Value (US$ Million) & Volume (Units) Forecast By Market Taxonomy, 2022 to 2032

        9.2.1. By Country

            9.2.1.1. The United States

            9.2.1.2. Canada

        9.2.2. By Product

        9.2.3. By Application

        9.2.4. By End-Use

    9.3. Market Attractiveness Analysis

        9.3.1. By Country

        9.3.2. By Product

        9.3.3. By Application

        9.3.4. By End-Use

    9.4. Key Takeaways

10. Latin America Market Analysis 2017 to 2021 and Forecast 2022 to 2032, By Country

    10.1. Historical Market Size Value (US$ Million) & Volume (Units) Trend Analysis By Market Taxonomy, 2017 to 2021

    10.2. Market Size Value (US$ Million) & Volume (Units) Forecast By Market Taxonomy, 2022 to 2032

        10.2.1. By Country

            10.2.1.1. Brazil

            10.2.1.2. Mexico

            10.2.1.3. Rest of Latin America

        10.2.2. By Product

        10.2.3. By Application

        10.2.4. By End-Use

    10.3. Market Attractiveness Analysis

        10.3.1. By Country

        10.3.2. By Product

        10.3.3. By Application

        10.3.4. By End-Use

    10.4. Key Takeaways

11. Europe Market Analysis 2017 to 2021 and Forecast 2022 to 2032, By Country

    11.1. Historical Market Size Value (US$ Million) & Volume (Units) Trend Analysis By Market Taxonomy, 2017 to 2021

    11.2. Market Size Value (US$ Million) & Volume (Units) Forecast By Market Taxonomy, 2022 to 2032

        11.2.1. By Country

            11.2.1.1. Germany

            11.2.1.2. The United Kingdom

            11.2.1.3. France

            11.2.1.4. Spain

            11.2.1.5. Italy

            11.2.1.6. Rest of Europe

        11.2.2. By Product

        11.2.3. By Application

        11.2.4. By End-Use

    11.3. Market Attractiveness Analysis

        11.3.1. By Country

        11.3.2. By Product

        11.3.3. By Application

        11.3.4. By End-Use

    11.4. Key Takeaways

12. Asia Pacific Market Analysis 2017 to 2021 and Forecast 2022 to 2032, By Country

    12.1. Historical Market Size Value (US$ Million) & Volume (Units) Trend Analysis By Market Taxonomy, 2017 to 2021

    12.2. Market Size Value (US$ Million) & Volume (Units) Forecast By Market Taxonomy, 2022 to 2032

        12.2.1. By Country

            12.2.1.1. China

            12.2.1.2. Japan

            12.2.1.3. South Korea

            12.2.1.4. Singapore

            12.2.1.5. Thailand

            12.2.1.6. Indonesia

            12.2.1.7. Australia

            12.2.1.8. New Zealand

            12.2.1.9. Rest of Asia Pacific

        12.2.2. By Product

        12.2.3. By Application

        12.2.4. By End-Use

    12.3. Market Attractiveness Analysis

        12.3.1. By Country

        12.3.2. By Product

        12.3.3. By Application

        12.3.4. By End-Use

    12.4. Key Takeaways

13. Middle East and Africa Market Analysis 2017 to 2021 and Forecast 2022 to 2032, By Country

    13.1. Historical Market Size Value (US$ Million) & Volume (Units) Trend Analysis By Market Taxonomy, 2017 to 2021

    13.2. Market Size Value (US$ Million) & Volume (Units) Forecast By Market Taxonomy, 2022 to 2032

        13.2.1. By Country

            13.2.1.1. Gulf Cooperation Council Countries

            13.2.1.2. South Africa

            13.2.1.3. Israel

            13.2.1.4. Rest of Middle East and Africa

        13.2.2. By Product

        13.2.3. By Application

        13.2.4. By End-Use

    13.3. Market Attractiveness Analysis

        13.3.1. By Country

        13.3.2. By Product

        13.3.3. By Application

        13.3.4. By End-Use

    13.4. Key Takeaways

14. Key Countries Market Analysis

    14.1. USA

        14.1.1. Pricing Analysis

        14.1.2. Market Share Analysis, 2021

            14.1.2.1. By Product

            14.1.2.2. By Application

            14.1.2.3. By End-Use

    14.2. Canada

        14.2.1. Pricing Analysis

        14.2.2. Market Share Analysis, 2021

            14.2.2.1. By Product

            14.2.2.2. By Application

            14.2.2.3. By End-Use

    14.3. Brazil

        14.3.1. Pricing Analysis

        14.3.2. Market Share Analysis, 2021

            14.3.2.1. By Product

            14.3.2.2. By Application

            14.3.2.3. By End-Use

    14.4. Mexico

        14.4.1. Pricing Analysis

        14.4.2. Market Share Analysis, 2021

            14.4.2.1. By Product

            14.4.2.2. By Application

            14.4.2.3. By End-Use

    14.5. Germany

        14.5.1. Pricing Analysis

        14.5.2. Market Share Analysis, 2021

            14.5.2.1. By Product

            14.5.2.2. By Application

            14.5.2.3. By End-Use

    14.6. United kingdom

        14.6.1. Pricing Analysis

        14.6.2. Market Share Analysis, 2021

            14.6.2.1. By Product

            14.6.2.2. By Application

            14.6.2.3. By End-Use

    14.7. France

        14.7.1. Pricing Analysis

        14.7.2. Market Share Analysis, 2021

            14.7.2.1. By Product

            14.7.2.2. By Application

            14.7.2.3. By End-Use

    14.8. Spain

        14.8.1. Pricing Analysis

        14.8.2. Market Share Analysis, 2021

            14.8.2.1. By Product

            14.8.2.2. By Application

            14.8.2.3. By End-Use

    14.9. Italy

        14.9.1. Pricing Analysis

        14.9.2. Market Share Analysis, 2021

            14.9.2.1. By Product

            14.9.2.2. By Application

            14.9.2.3. By End-Use

    14.10. China

        14.10.1. Pricing Analysis

        14.10.2. Market Share Analysis, 2021

            14.10.2.1. By Product

            14.10.2.2. By Application

            14.10.2.3. By End-Use

    14.11. Japan

        14.11.1. Pricing Analysis

        14.11.2. Market Share Analysis, 2021

            14.11.2.1. By Product

            14.11.2.2. By Application

            14.11.2.3. By End-Use

    14.12. South Korea

        14.12.1. Pricing Analysis

        14.12.2. Market Share Analysis, 2021

            14.12.2.1. By Product

            14.12.2.2. By Application

            14.12.2.3. By End-Use

    14.13. Singapore

        14.13.1. Pricing Analysis

        14.13.2. Market Share Analysis, 2021

            14.13.2.1. By Product

            14.13.2.2. By Application

            14.13.2.3. By End-Use

    14.14. Thailand

        14.14.1. Pricing Analysis

        14.14.2. Market Share Analysis, 2021

            14.14.2.1. By Product

            14.14.2.2. By Application

            14.14.2.3. By End-Use

    14.15. Indonesia

        14.15.1. Pricing Analysis

        14.15.2. Market Share Analysis, 2021

            14.15.2.1. By Product

            14.15.2.2. By Application

            14.15.2.3. By End-Use

    14.16. Australia

        14.16.1. Pricing Analysis

        14.16.2. Market Share Analysis, 2021

            14.16.2.1. By Product

            14.16.2.2. By Application

            14.16.2.3. By End-Use

    14.17. New Zealand

        14.17.1. Pricing Analysis

        14.17.2. Market Share Analysis, 2021

            14.17.2.1. By Product

            14.17.2.2. By Application

            14.17.2.3. By End-Use

    14.18. GCC Countries

        14.18.1. Pricing Analysis

        14.18.2. Market Share Analysis, 2021

            14.18.2.1. By Product

            14.18.2.2. By Application

            14.18.2.3. By End-Use

    14.19. South Africa

        14.19.1. Pricing Analysis

        14.19.2. Market Share Analysis, 2021

            14.19.2.1. By Product

            14.19.2.2. By Application

            14.19.2.3. By End-Use

    14.20. Israel

        14.20.1. Pricing Analysis

        14.20.2. Market Share Analysis, 2021

            14.20.2.1. By Product

            14.20.2.2. By Application

            14.20.2.3. By End-Use

15. Market Structure Analysis

    15.1. Competition Dashboard

    15.2. Competition Benchmarking

    15.3. Market Share Analysis of Top Players

        15.3.1. By Regional

        15.3.2. By Product

        15.3.3. By Application

        15.3.4. By End-Use

16. Competition Analysis

    16.1. Competition Deep Dive

        16.1.1. Unimicron

            16.1.1.1. Overview

            16.1.1.2. Product Portfolio

            16.1.1.3. Profitability by Market Segments

            16.1.1.4. Sales Footprint

            16.1.1.5. Strategy Overview

                16.1.1.5.1. Marketing Strategy

                16.1.1.5.2. Product Strategy

                16.1.1.5.3. Channel Strategy

        16.1.2. Compeq Co.

            16.1.2.1. Overview

            16.1.2.2. Product Portfolio

            16.1.2.3. Profitability by Market Segments

            16.1.2.4. Sales Footprint

            16.1.2.5. Strategy Overview

                16.1.2.5.1. Marketing Strategy

                16.1.2.5.2. Product Strategy

                16.1.2.5.3. Channel Strategy

        16.1.3. TTM Technologies

            16.1.3.1. Overview

            16.1.3.2. Product Portfolio

            16.1.3.3. Profitability by Market Segments

            16.1.3.4. Sales Footprint

            16.1.3.5. Strategy Overview

                16.1.3.5.1. Marketing Strategy

                16.1.3.5.2. Product Strategy

                16.1.3.5.3. Channel Strategy

        16.1.4. Austria Technologie & Systemtechnik

            16.1.4.1. Overview

            16.1.4.2. Product Portfolio

            16.1.4.3. Profitability by Market Segments

            16.1.4.4. Sales Footprint

            16.1.4.5. Strategy Overview

                16.1.4.5.1. Marketing Strategy

                16.1.4.5.2. Product Strategy

                16.1.4.5.3. Channel Strategy

        16.1.5. Zhen Ding Tech.

            16.1.5.1. Overview

            16.1.5.2. Product Portfolio

            16.1.5.3. Profitability by Market Segments

            16.1.5.4. Sales Footprint

            16.1.5.5. Strategy Overview

                16.1.5.5.1. Marketing Strategy

                16.1.5.5.2. Product Strategy

                16.1.5.5.3. Channel Strategy

        16.1.6. IBIDEN

            16.1.6.1. Overview

            16.1.6.2. Product Portfolio

            16.1.6.3. Profitability by Market Segments

            16.1.6.4. Sales Footprint

            16.1.6.5. Strategy Overview

                16.1.6.5.1. Marketing Strategy

                16.1.6.5.2. Product Strategy

                16.1.6.5.3. Channel Strategy

        16.1.7. MEIKO ELECTRONICS

            16.1.7.1. Overview

            16.1.7.2. Product Portfolio

            16.1.7.3. Profitability by Market Segments

            16.1.7.4. Sales Footprint

            16.1.7.5. Strategy Overview

                16.1.7.5.1. Marketing Strategy

                16.1.7.5.2. Product Strategy

                16.1.7.5.3. Channel Strategy

        16.1.8. FUJITSU INTERCONNECT TECHNOLOGIES

            16.1.8.1. Overview

            16.1.8.2. Product Portfolio

            16.1.8.3. Profitability by Market Segments

            16.1.8.4. Sales Footprint

            16.1.8.5. Strategy Overview

                16.1.8.5.1. Marketing Strategy

                16.1.8.5.2. Product Strategy

                16.1.8.5.3. Channel Strategy

        16.1.9. Tripod Technology Corp.

            16.1.9.1. Overview

            16.1.9.2. Product Portfolio

            16.1.9.3. Profitability by Market Segments

            16.1.9.4. Sales Footprint

            16.1.9.5. Strategy Overview

                16.1.9.5.1. Marketing Strategy

                16.1.9.5.2. Product Strategy

                16.1.9.5.3. Channel Strategy

        16.1.10. Value (US$ Million) & Volume (Units)ech

            16.1.10.1. Overview

            16.1.10.2. Product Portfolio

            16.1.10.3. Profitability by Market Segments

            16.1.10.4. Sales Footprint

            16.1.10.5. Strategy Overview

                16.1.10.5.1. Marketing Strategy

                16.1.10.5.2. Product Strategy

                16.1.10.5.3. Channel Strategy

        16.1.11. SAMSUNG ELECTRO-MECHANICS

            16.1.11.1. Overview

            16.1.11.2. Product Portfolio

            16.1.11.3. Profitability by Market Segments

            16.1.11.4. Sales Footprint

            16.1.11.5. Strategy Overview

                16.1.11.5.1. Marketing Strategy

                16.1.11.5.2. Product Strategy

                16.1.11.5.3. Channel Strategy

        16.1.12. Daeduck GDS Co

            16.1.12.1. Overview

            16.1.12.2. Product Portfolio

            16.1.12.3. Profitability by Market Segments

            16.1.12.4. Sales Footprint

            16.1.12.5. Strategy Overview

                16.1.12.5.1. Marketing Strategy

                16.1.12.5.2. Product Strategy

                16.1.12.5.3. Channel Strategy

        16.1.13. DAP Corp.

            16.1.13.1. Overview

            16.1.13.2. Product Portfolio

            16.1.13.3. Profitability by Market Segments

            16.1.13.4. Sales Footprint

            16.1.13.5. Strategy Overview

                16.1.13.5.1. Marketing Strategy

                16.1.13.5.2. Product Strategy

                16.1.13.5.3. Channel Strategy

        16.1.14. Korea Circuit

            16.1.14.1. Overview

            16.1.14.2. Product Portfolio

            16.1.14.3. Profitability by Market Segments

            16.1.14.4. Sales Footprint

            16.1.14.5. Strategy Overview

                16.1.14.5.1. Marketing Strategy

                16.1.14.5.2. Product Strategy

                16.1.14.5.3. Channel Strategy

        16.1.15. CMK

            16.1.15.1. Overview

            16.1.15.2. Product Portfolio

            16.1.15.3. Profitability by Market Segments

            16.1.15.4. Sales Footprint

            16.1.15.5. Strategy Overview

                16.1.15.5.1. Marketing Strategy

                16.1.15.5.2. Product Strategy

                16.1.15.5.3. Channel Strategy

        16.1.16. NCAB Group

            16.1.16.1. Overview

            16.1.16.2. Product Portfolio

            16.1.16.3. Profitability by Market Segments

            16.1.16.4. Sales Footprint

            16.1.16.5. Strategy Overview

                16.1.16.5.1. Marketing Strategy

                16.1.16.5.2. Product Strategy

                16.1.16.5.3. Channel Strategy

        16.1.17. SIERRA CIRCUITS

            16.1.17.1. Overview

            16.1.17.2. Product Portfolio

            16.1.17.3. Profitability by Market Segments

            16.1.17.4. Sales Footprint

            16.1.17.5. Strategy Overview

                16.1.17.5.1. Marketing Strategy

                16.1.17.5.2. Product Strategy

                16.1.17.5.3. Channel Strategy

        16.1.18. Multek

            16.1.18.1. Overview

            16.1.18.2. Product Portfolio

            16.1.18.3. Profitability by Market Segments

            16.1.18.4. Sales Footprint

            16.1.18.5. Strategy Overview

                16.1.18.5.1. Marketing Strategy

                16.1.18.5.2. Product Strategy

                16.1.18.5.3. Channel Strategy

17. Assumptions & Acronyms Used

18. Research Methodology

List of Tables

Table 1: Global Market Value (US$ Million) Forecast by Region, 2017 to 2032

Table 2: Global Market Volume (Units) Forecast by Region, 2017 to 2032

Table 3: Global Market Value (US$ Million) Forecast by Product, 2017 to 2032

Table 4: Global Market Volume (Units) Forecast by Product, 2017 to 2032

Table 5: Global Market Value (US$ Million) Forecast by Application, 2017 to 2032

Table 6: Global Market Volume (Units) Forecast by Application, 2017 to 2032

Table 7: Global Market Value (US$ Million) Forecast by End-Use, 2017 to 2032

Table 8: Global Market Volume (Units) Forecast by End-Use, 2017 to 2032

Table 9: North America Market Value (US$ Million) Forecast by Country, 2017 to 2032

Table 10: North America Market Volume (Units) Forecast by Country, 2017 to 2032

Table 11: North America Market Value (US$ Million) Forecast by Product, 2017 to 2032

Table 12: North America Market Volume (Units) Forecast by Product, 2017 to 2032

Table 13: North America Market Value (US$ Million) Forecast by Application, 2017 to 2032

Table 14: North America Market Volume (Units) Forecast by Application, 2017 to 2032

Table 15: North America Market Value (US$ Million) Forecast by End-Use, 2017 to 2032

Table 16: North America Market Volume (Units) Forecast by End-Use, 2017 to 2032

Table 17: Latin America Market Value (US$ Million) Forecast by Country, 2017 to 2032

Table 18: Latin America Market Volume (Units) Forecast by Country, 2017 to 2032

Table 19: Latin America Market Value (US$ Million) Forecast by Product, 2017 to 2032

Table 20: Latin America Market Volume (Units) Forecast by Product, 2017 to 2032

Table 21: Latin America Market Value (US$ Million) Forecast by Application, 2017 to 2032

Table 22: Latin America Market Volume (Units) Forecast by Application, 2017 to 2032

Table 23: Latin America Market Value (US$ Million) Forecast by End-Use, 2017 to 2032

Table 24: Latin America Market Volume (Units) Forecast by End-Use, 2017 to 2032

Table 25: Europe Market Value (US$ Million) Forecast by Country, 2017 to 2032

Table 26: Europe Market Volume (Units) Forecast by Country, 2017 to 2032

Table 27: Europe Market Value (US$ Million) Forecast by Product, 2017 to 2032

Table 28: Europe Market Volume (Units) Forecast by Product, 2017 to 2032

Table 29: Europe Market Value (US$ Million) Forecast by Application, 2017 to 2032

Table 30: Europe Market Volume (Units) Forecast by Application, 2017 to 2032

Table 31: Europe Market Value (US$ Million) Forecast by End-Use, 2017 to 2032

Table 32: Europe Market Volume (Units) Forecast by End-Use, 2017 to 2032

Table 33: Asia Pacific Market Value (US$ Million) Forecast by Country, 2017 to 2032

Table 34: Asia Pacific Market Volume (Units) Forecast by Country, 2017 to 2032

Table 35: Asia Pacific Market Value (US$ Million) Forecast by Product, 2017 to 2032

Table 36: Asia Pacific Market Volume (Units) Forecast by Product, 2017 to 2032

Table 37: Asia Pacific Market Value (US$ Million) Forecast by Application, 2017 to 2032

Table 38: Asia Pacific Market Volume (Units) Forecast by Application, 2017 to 2032

Table 39: Asia Pacific Market Value (US$ Million) Forecast by End-Use, 2017 to 2032

Table 40: Asia Pacific Market Volume (Units) Forecast by End-Use, 2017 to 2032

Table 41: Middle East and Africa Market Value (US$ Million) Forecast by Country, 2017 to 2032

Table 42: Middle East and Africa Market Volume (Units) Forecast by Country, 2017 to 2032

Table 43: Middle East and Africa Market Value (US$ Million) Forecast by Product, 2017 to 2032

Table 44: Middle East and Africa Market Volume (Units) Forecast by Product, 2017 to 2032

Table 45: Middle East and Africa Market Value (US$ Million) Forecast by Application, 2017 to 2032

Table 46: Middle East and Africa Market Volume (Units) Forecast by Application, 2017 to 2032

Table 47: Middle East and Africa Market Value (US$ Million) Forecast by End-Use, 2017 to 2032

Table 48: Middle East and Africa Market Volume (Units) Forecast by End-Use, 2017 to 2032

List of Charts

Figure 1: Global Market Value (US$ Million) by Product, 2022 to 2032

Figure 2: Global Market Value (US$ Million) by Application, 2022 to 2032

Figure 3: Global Market Value (US$ Million) by End-Use, 2022 to 2032

Figure 4: Global Market Value (US$ Million) by Region, 2022 to 2032

Figure 5: Global Market Value (US$ Million) Analysis by Region, 2017 to 2032

Figure 6: Global Market Volume (Units) Analysis by Region, 2017 to 2032

Figure 7: Global Market Value Share (%) and BPS Analysis by Region, 2022 to 2032

Figure 8: Global Market Y-o-Y Growth (%) Projections by Region, 2022 to 2032

Figure 9: Global Market Value (US$ Million) Analysis by Product, 2017 to 2032

Figure 10: Global Market Volume (Units) Analysis by Product, 2017 to 2032

Figure 11: Global Market Value Share (%) and BPS Analysis by Product, 2022 to 2032

Figure 12: Global Market Y-o-Y Growth (%) Projections by Product, 2022 to 2032

Figure 13: Global Market Value (US$ Million) Analysis by Application, 2017 to 2032

Figure 14: Global Market Volume (Units) Analysis by Application, 2017 to 2032

Figure 15: Global Market Value Share (%) and BPS Analysis by Application, 2022 to 2032

Figure 16: Global Market Y-o-Y Growth (%) Projections by Application, 2022 to 2032

Figure 17: Global Market Value (US$ Million) Analysis by End-Use, 2017 to 2032

Figure 18: Global Market Volume (Units) Analysis by End-Use, 2017 to 2032

Figure 19: Global Market Value Share (%) and BPS Analysis by End-Use, 2022 to 2032

Figure 20: Global Market Y-o-Y Growth (%) Projections by End-Use, 2022 to 2032

Figure 21: Global Market Attractiveness by Product, 2022 to 2032

Figure 22: Global Market Attractiveness by Application, 2022 to 2032

Figure 23: Global Market Attractiveness by End-Use, 2022 to 2032

Figure 24: Global Market Attractiveness by Region, 2022 to 2032

Figure 25: North America Market Value (US$ Million) by Product, 2022 to 2032

Figure 26: North America Market Value (US$ Million) by Application, 2022 to 2032

Figure 27: North America Market Value (US$ Million) by End-Use, 2022 to 2032

Figure 28: North America Market Value (US$ Million) by Country, 2022 to 2032

Figure 29: North America Market Value (US$ Million) Analysis by Country, 2017 to 2032

Figure 30: North America Market Volume (Units) Analysis by Country, 2017 to 2032

Figure 31: North America Market Value Share (%) and BPS Analysis by Country, 2022 to 2032

Figure 32: North America Market Y-o-Y Growth (%) Projections by Country, 2022 to 2032

Figure 33: North America Market Value (US$ Million) Analysis by Product, 2017 to 2032

Figure 34: North America Market Volume (Units) Analysis by Product, 2017 to 2032

Figure 35: North America Market Value Share (%) and BPS Analysis by Product, 2022 to 2032

Figure 36: North America Market Y-o-Y Growth (%) Projections by Product, 2022 to 2032

Figure 37: North America Market Value (US$ Million) Analysis by Application, 2017 to 2032

Figure 38: North America Market Volume (Units) Analysis by Application, 2017 to 2032

Figure 39: North America Market Value Share (%) and BPS Analysis by Application, 2022 to 2032

Figure 40: North America Market Y-o-Y Growth (%) Projections by Application, 2022 to 2032

Figure 41: North America Market Value (US$ Million) Analysis by End-Use, 2017 to 2032

Figure 42: North America Market Volume (Units) Analysis by End-Use, 2017 to 2032

Figure 43: North America Market Value Share (%) and BPS Analysis by End-Use, 2022 to 2032

Figure 44: North America Market Y-o-Y Growth (%) Projections by End-Use, 2022 to 2032

Figure 45: North America Market Attractiveness by Product, 2022 to 2032

Figure 46: North America Market Attractiveness by Application, 2022 to 2032

Figure 47: North America Market Attractiveness by End-Use, 2022 to 2032

Figure 48: North America Market Attractiveness by Country, 2022 to 2032

Figure 49: Latin America Market Value (US$ Million) by Product, 2022 to 2032

Figure 50: Latin America Market Value (US$ Million) by Application, 2022 to 2032

Figure 51: Latin America Market Value (US$ Million) by End-Use, 2022 to 2032

Figure 52: Latin America Market Value (US$ Million) by Country, 2022 to 2032

Figure 53: Latin America Market Value (US$ Million) Analysis by Country, 2017 to 2032

Figure 54: Latin America Market Volume (Units) Analysis by Country, 2017 to 2032

Figure 55: Latin America Market Value Share (%) and BPS Analysis by Country, 2022 to 2032

Figure 56: Latin America Market Y-o-Y Growth (%) Projections by Country, 2022 to 2032

Figure 57: Latin America Market Value (US$ Million) Analysis by Product, 2017 to 2032

Figure 58: Latin America Market Volume (Units) Analysis by Product, 2017 to 2032

Figure 59: Latin America Market Value Share (%) and BPS Analysis by Product, 2022 to 2032

Figure 60: Latin America Market Y-o-Y Growth (%) Projections by Product, 2022 to 2032

Figure 61: Latin America Market Value (US$ Million) Analysis by Application, 2017 to 2032

Figure 62: Latin America Market Volume (Units) Analysis by Application, 2017 to 2032

Figure 63: Latin America Market Value Share (%) and BPS Analysis by Application, 2022 to 2032

Figure 64: Latin America Market Y-o-Y Growth (%) Projections by Application, 2022 to 2032

Figure 65: Latin America Market Value (US$ Million) Analysis by End-Use, 2017 to 2032

Figure 66: Latin America Market Volume (Units) Analysis by End-Use, 2017 to 2032

Figure 67: Latin America Market Value Share (%) and BPS Analysis by End-Use, 2022 to 2032

Figure 68: Latin America Market Y-o-Y Growth (%) Projections by End-Use, 2022 to 2032

Figure 69: Latin America Market Attractiveness by Product, 2022 to 2032

Figure 70: Latin America Market Attractiveness by Application, 2022 to 2032

Figure 71: Latin America Market Attractiveness by End-Use, 2022 to 2032

Figure 72: Latin America Market Attractiveness by Country, 2022 to 2032

Figure 73: Europe Market Value (US$ Million) by Product, 2022 to 2032

Figure 74: Europe Market Value (US$ Million) by Application, 2022 to 2032

Figure 75: Europe Market Value (US$ Million) by End-Use, 2022 to 2032

Figure 76: Europe Market Value (US$ Million) by Country, 2022 to 2032

Figure 77: Europe Market Value (US$ Million) Analysis by Country, 2017 to 2032

Figure 78: Europe Market Volume (Units) Analysis by Country, 2017 to 2032

Figure 79: Europe Market Value Share (%) and BPS Analysis by Country, 2022 to 2032

Figure 80: Europe Market Y-o-Y Growth (%) Projections by Country, 2022 to 2032

Figure 81: Europe Market Value (US$ Million) Analysis by Product, 2017 to 2032

Figure 82: Europe Market Volume (Units) Analysis by Product, 2017 to 2032

Figure 83: Europe Market Value Share (%) and BPS Analysis by Product, 2022 to 2032

Figure 84: Europe Market Y-o-Y Growth (%) Projections by Product, 2022 to 2032

Figure 85: Europe Market Value (US$ Million) Analysis by Application, 2017 to 2032

Figure 86: Europe Market Volume (Units) Analysis by Application, 2017 to 2032

Figure 87: Europe Market Value Share (%) and BPS Analysis by Application, 2022 to 2032

Figure 88: Europe Market Y-o-Y Growth (%) Projections by Application, 2022 to 2032

Figure 89: Europe Market Value (US$ Million) Analysis by End-Use, 2017 to 2032

Figure 90: Europe Market Volume (Units) Analysis by End-Use, 2017 to 2032

Figure 91: Europe Market Value Share (%) and BPS Analysis by End-Use, 2022 to 2032

Figure 92: Europe Market Y-o-Y Growth (%) Projections by End-Use, 2022 to 2032

Figure 93: Europe Market Attractiveness by Product, 2022 to 2032

Figure 94: Europe Market Attractiveness by Application, 2022 to 2032

Figure 95: Europe Market Attractiveness by End-Use, 2022 to 2032

Figure 96: Europe Market Attractiveness by Country, 2022 to 2032

Figure 97: Asia Pacific Market Value (US$ Million) by Product, 2022 to 2032

Figure 98: Asia Pacific Market Value (US$ Million) by Application, 2022 to 2032

Figure 99: Asia Pacific Market Value (US$ Million) by End-Use, 2022 to 2032

Figure 100: Asia Pacific Market Value (US$ Million) by Country, 2022 to 2032

Figure 101: Asia Pacific Market Value (US$ Million) Analysis by Country, 2017 to 2032

Figure 102: Asia Pacific Market Volume (Units) Analysis by Country, 2017 to 2032

Figure 103: Asia Pacific Market Value Share (%) and BPS Analysis by Country, 2022 to 2032

Figure 104: Asia Pacific Market Y-o-Y Growth (%) Projections by Country, 2022 to 2032

Figure 105: Asia Pacific Market Value (US$ Million) Analysis by Product, 2017 to 2032

Figure 106: Asia Pacific Market Volume (Units) Analysis by Product, 2017 to 2032

Figure 107: Asia Pacific Market Value Share (%) and BPS Analysis by Product, 2022 to 2032

Figure 108: Asia Pacific Market Y-o-Y Growth (%) Projections by Product, 2022 to 2032

Figure 109: Asia Pacific Market Value (US$ Million) Analysis by Application, 2017 to 2032

Figure 110: Asia Pacific Market Volume (Units) Analysis by Application, 2017 to 2032

Figure 111: Asia Pacific Market Value Share (%) and BPS Analysis by Application, 2022 to 2032

Figure 112: Asia Pacific Market Y-o-Y Growth (%) Projections by Application, 2022 to 2032

Figure 113: Asia Pacific Market Value (US$ Million) Analysis by End-Use, 2017 to 2032

Figure 114: Asia Pacific Market Volume (Units) Analysis by End-Use, 2017 to 2032

Figure 115: Asia Pacific Market Value Share (%) and BPS Analysis by End-Use, 2022 to 2032

Figure 116: Asia Pacific Market Y-o-Y Growth (%) Projections by End-Use, 2022 to 2032

Figure 117: Asia Pacific Market Attractiveness by Product, 2022 to 2032

Figure 118: Asia Pacific Market Attractiveness by Application, 2022 to 2032

Figure 119: Asia Pacific Market Attractiveness by End-Use, 2022 to 2032

Figure 120: Asia Pacific Market Attractiveness by Country, 2022 to 2032

Figure 121: Middle East and Africa Market Value (US$ Million) by Product, 2022 to 2032

Figure 122: Middle East and Africa Market Value (US$ Million) by Application, 2022 to 2032

Figure 123: Middle East and Africa Market Value (US$ Million) by End-Use, 2022 to 2032

Figure 124: Middle East and Africa Market Value (US$ Million) by Country, 2022 to 2032

Figure 125: Middle East and Africa Market Value (US$ Million) Analysis by Country, 2017 to 2032

Figure 126: Middle East and Africa Market Volume (Units) Analysis by Country, 2017 to 2032

Figure 127: Middle East and Africa Market Value Share (%) and BPS Analysis by Country, 2022 to 2032

Figure 128: Middle East and Africa Market Y-o-Y Growth (%) Projections by Country, 2022 to 2032

Figure 129: Middle East and Africa Market Value (US$ Million) Analysis by Product, 2017 to 2032

Figure 130: Middle East and Africa Market Volume (Units) Analysis by Product, 2017 to 2032

Figure 131: Middle East and Africa Market Value Share (%) and BPS Analysis by Product, 2022 to 2032

Figure 132: Middle East and Africa Market Y-o-Y Growth (%) Projections by Product, 2022 to 2032

Figure 133: Middle East and Africa Market Value (US$ Million) Analysis by Application, 2017 to 2032

Figure 134: Middle East and Africa Market Volume (Units) Analysis by Application, 2017 to 2032

Figure 135: Middle East and Africa Market Value Share (%) and BPS Analysis by Application, 2022 to 2032

Figure 136: Middle East and Africa Market Y-o-Y Growth (%) Projections by Application, 2022 to 2032

Figure 137: Middle East and Africa Market Value (US$ Million) Analysis by End-Use, 2017 to 2032

Figure 138: Middle East and Africa Market Volume (Units) Analysis by End-Use, 2017 to 2032

Figure 139: Middle East and Africa Market Value Share (%) and BPS Analysis by End-Use, 2022 to 2032

Figure 140: Middle East and Africa Market Y-o-Y Growth (%) Projections by End-Use, 2022 to 2032

Figure 141: Middle East and Africa Market Attractiveness by Product, 2022 to 2032

Figure 142: Middle East and Africa Market Attractiveness by Application, 2022 to 2032

Figure 143: Middle East and Africa Market Attractiveness by End-Use, 2022 to 2032

Figure 144: Middle East and Africa Market Attractiveness by Country, 2022 to 2032

Recommendations

Technology

RF Interconnect Market

Published : February 2023

Technology

Molded Interconnect Devices (MID) Market

Published : February 2023

Healthcare

Medical Device Technologies Market

Published : September 2022

Technology

Signalling Device Market

Published : March 2022

Explore Technology Insights

View Reports

High Density Interconnect Market