Methodology

High Purity Flow Meter Market Forecast and Outlook 2025 to 2035

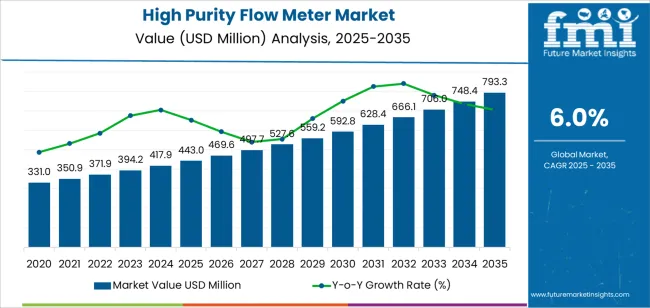
The high purity flow meter market is forecast to grow from USD 443.0 million in 2025 to USD 793.3 million by 2035, at a CAGR of 6.0%, with regional demand patterns shaping overall expansion. Asia Pacific remains the largest contributor to growth, supported by rapid semiconductor-fabrication investments across China, South Korea, Taiwan, and Japan. High-purity gas and fluid metering systems are installed across chip-manufacturing lines handling deposition gases, etching chemicals, CMP slurries, and ultrapure water, emphasizing particle-free construction, digital calibration, and corrosion-resistant pathways. Pharmaceutical and biotechnology facilities in India and Southeast Asia strengthen adoption as single-use bioprocessing expands and regulatory frameworks emphasise traceable, contamination-free fluid handling.

North America maintains a stable demand, driven by mature semiconductor fabs, biologics facilities, and high-spec clean-process environments. Upgrades in ultrapure-water plants, advanced therapy manufacturing, and analytical-lab workflows support consistent procurement of high-accuracy mass, Coriolis, and ultrasonic meters. Replacement cycles intensify as GMP alignment, audit expectations, and calibration traceability become stricter across industrial and research installations. Europe advances through regulated clean-process industries, particularly in Germany, the Netherlands, Ireland, and Switzerland. Biopharmaceutical producers use electropolished stainless-steel and fluoropolymer meters for sterile media, buffer handling, and filling operations, while the semiconductor and specialty-chemical sectors rely on high-purity gas metering for controlled-environment processing.
Quick Stats for High Purity Flow Meter Market

  • High Purity Flow Meter Market Value (2025): USD 443.0 million
  • High Purity Flow Meter Market Forecast Value (2035): USD 793.3 million
  • High Purity Flow Meter Market Forecast CAGR: 6.0%
  • Leading Type in High Purity Flow Meter Market: Gas Flow Meters
  • Key Growth Regions in High Purity Flow Meter Market: Asia Pacific, Europe, and North America
  • Top Players in High Purity Flow Meter Market: Horiba, Brooks Instrument, Beijing Sevenstar, Fujikin, MKS Instrument, Azbil, MK Precision, Kofloc, Bronkhorst

High Purity Flow Meter Market Market Value Analysis

What is the Growth Forecast for the High Purity Flow Meter Market through 2035?

Asia Pacific leads global market growth, driven by expanding semiconductor capacity and pharmaceutical manufacturing in China, South Korea, Taiwan, and Japan. Europe and North America maintain strong demand through established cleanroom industries and continuous technological upgrades. Key manufacturers include Horiba, Brooks Instrument, Beijing Sevenstar, Fujikin, MKS Instrument, Azbil, and MK Precision, focusing on measurement precision, contamination control, and integration with advanced process control systems.

The growth contribution index shows that semiconductor manufacturing will account for the largest share of incremental expansion during the early period from 2025 to 2029. Demand will be driven by precise flow-control requirements in chip fabrication, where contamination-free fluid handling is essential for deposition, etching, and cleaning processes. Biopharmaceutical production will also contribute significantly as facilities expand single-use systems and high-purity process lines.

Between 2030 and 2035, contributions will broaden across pharmaceuticals, specialty chemicals, and high-accuracy laboratory applications. Replacement cycles will gain weight as manufacturers update metering technologies to maintain compliance with purity, calibration, and traceability standards. Regional contributions will remain led by Asia Pacific due to concentrated semiconductor investment, while North America and Europe will add steady gains through regulated bioprocessing and analytical workflows. The overall contribution index reflects a market shaped by precision requirements, contamination-control standards, and steady integration of high-purity metering technologies across advanced industrial and laboratory environments.

High Purity Flow Meter Market Key Takeaways

Metric Value
Market Value (2025) USD 443.0 million
Market Forecast Value (2035) USD 793.3 million
Forecast CAGR (2025-2035) 6.0%

Why is the High Performance Permanent Magnet Market Growing?

The high performance permanent magnet market is growing because industries are requiring magnetic materials that provide greater power density, thermal stability and energy efficiency in compact and demanding applications. Rare-earth magnets such as neodymium-iron-boron (NdFeB) and samarium-cobalt (SmCo) provide significantly higher magnetic strength compared to ferrite or alnico, enabling smaller motor and generator designs in electric vehicles, wind turbines and industrial automation. Surveys indicate that continuing electrification of transport, renewable energy adoption and sophisticated motion control systems drive magnet demand.

Supply-chain focus on rare-earth sourcing and magnet fabrication capacity is motivating investment in localised manufacturing. At the same time, the push for lightweight and efficient designs in aerospace and mobility applications enhances the requirement for advanced permanent magnets. Constraints include high cost of raw rare-earth materials, geopolitical risks associated with rare-earth mining and processing, and technical challenges in maintaining magnet performance under high temperatures.

Which Product Type and Application Segments Lead the High Purity Flow Meter Market?

The high purity flow meter market is segmented by product type and application. By product type, the market includes gas flow meters and fluid flow meters. Based on application, it is categorized into semiconductor, chemicals, pharmaceutical, and others. Regionally, the market is divided into Asia Pacific, Europe, North America, and other key regions.
By Product Type, the Gas Flow Meters Segment Accounts for the Largest Market Share

High Purity Flow Meter Market Analysis By Product Type

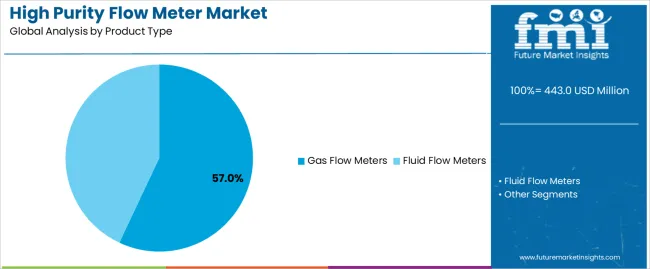
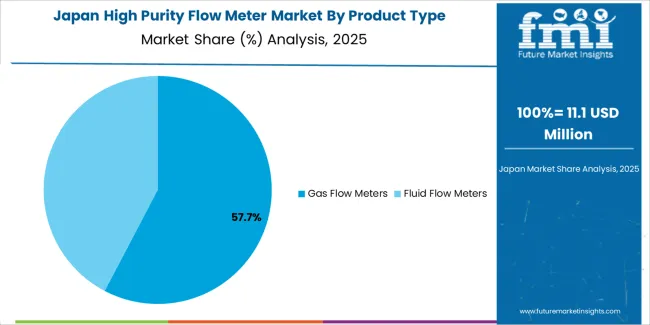
The gas flow meters segment holds the leading position in the high purity flow meter market, representing an estimated 57.0% of total market share in 2025. Gas flow meters are essential in environments requiring ultra-clean gas handling, including semiconductor fabrication, pharmaceutical sterile processing, and chemical vapor delivery. These meters maintain high accuracy at low flow rates and are constructed with contamination-resistant materials suited for high-purity gas distribution.

The fluid flow meters segment, estimated at 43.0%, serves applications involving ultrapure water systems, high-purity solvents, and chemical delivery lines used in microelectronics, life sciences, and specialty chemical processing.

Key factors supporting the gas flow meters segment include:
  • High demand for contamination-free gas measurement in semiconductor and pharmaceutical facilities.
  • Precise low-flow measurement capabilities needed for controlled gas distribution.
  • Compatibility with high-purity piping systems and inert materials.
  • Strong adoption in advanced fabrication and high-cleanliness manufacturing environments.

By Application, the Semiconductor Segment Represents the Dominant Market Category

High Purity Flow Meter Market Analysis By Application

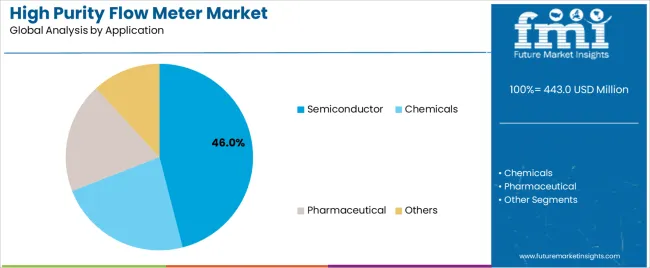
The semiconductor segment accounts for approximately 46.0% of the high purity flow meter market in 2025. Semiconductor manufacturing requires strict contamination control for processes such as chemical vapor deposition, etching, ultrapure water distribution, and process gas delivery. High purity flow meters ensure stable, traceable, and repeatable flow measurement in these critical steps.

The chemicals segment follows with an estimated 23.0%, supported by demand in high-purity chemical delivery and specialized production lines. The pharmaceutical segment accounts for roughly 19.0%, reflecting use in sterile processing, biologics manufacturing, and ultrapure water systems. The others category, representing about 12.0%, includes research laboratories, optical coating production, and precision manufacturing.

Primary dynamics driving demand from the semiconductor segment include:

  • Increasing complexity of wafer fabrication processes requiring precise gas and fluid control.
  • Growth in advanced node production, demanding enhanced purity standards.
  • Use of high-purity measurement systems to maintain yield and process stability.
  • Expansion of global semiconductor fabrication capacity.

What are the Drivers, Restraints, and Key Trends of the High Purity Flow Meter Market?

Growth in semiconductor manufacturing, rising demand for contamination-free fluid handling, and expansion of biotechnology production are driving market growth.

The high purity flow meter market is expanding as industries require accurate and contamination-resistant flow measurement for ultrapure water, high-grade chemicals, and clean gases. Semiconductor fabrication depends on high purity flow meters to manage etching chemicals, photoresists, CMP slurries, and process gases under strict purity and precision standards. Biopharmaceutical and cell-culture production facilities use these instruments to regulate media, buffers, and critical process fluids where even minor impurities affect product quality. Growth in advanced materials, specialty chemicals, and clean energy systems strengthens adoption of flow meters constructed from high-purity polymers, stainless steels, and corrosion-resistant alloys. Improvements in sensor design, digital calibration, and high-resolution measurement support wider use in mission-critical production environments.

High equipment cost, complex installation requirements, and limited compatibility with aggressive chemicals are restraining adoption.

High purity flow meters are more expensive than conventional meters due to advanced materials, precision machining, and stringent contamination-control standards. Installation often requires specialised fittings, cleanroom handling protocols, and certified technicians to maintain purity integrity, increasing deployment complexity. Some high-performance chemicals used in semiconductor and pharmaceutical operations can degrade certain flow meter materials, requiring frequent upgrades or specific material grades that add to cost. Smaller facilities with constrained budgets may rely on lower specification meters, slowing adoption in cost-sensitive markets.

Growth in single-use bioprocessing systems, expansion of semiconductor fabs in Asia Pacific, and increased integration of digital monitoring platforms are shaping industry trends.

Biopharmaceutical manufacturers are adopting single-use flow meters compatible with disposable process lines to reduce cleaning and contamination risks. Regional semiconductor investment in South Korea, Taiwan, Japan, and the United States is driving strong demand for high purity fluid-handling components. Digital technologies, including IoT-enabled diagnostics, real-time flow analytics, and automated calibration modules, are becoming standard in advanced manufacturing environments. These developments support increased reliability and precision, reinforcing the long-term growth trajectory of high purity flow meter solutions across multiple high-tech industries.

Analysis of the High Purity Flow Meter Market by Key Country

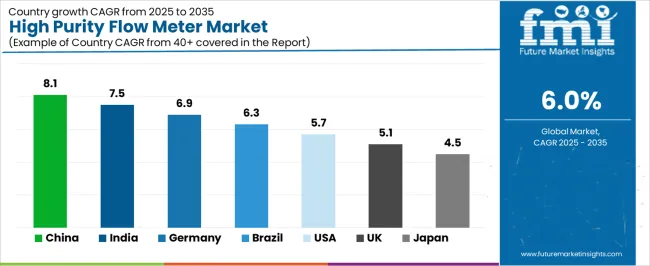
The global high purity flow meter market is expanding through 2035, supported by rising demand for contamination-free measurement systems in pharmaceuticals, biotechnology, semiconductor manufacturing, and precision chemical processing. China leads with a 8.1% CAGR, followed by India at 7.5%, reflecting strong investment in life-science manufacturing and controlled-environment production facilities. Germany grows at 6.9%, supported by strict regulatory standards and advanced instrumentation requirements. Brazil records 6.3%, driven by modernization of pharmaceutical and industrial plants. The United States grows at 5.7%, while the United Kingdom (5.1%) and Japan (4.5%) maintain stable demand through established clean-process industries and consistent equipment replacement cycles.
High Purity Flow Meter Market Cagr Analysis By Country

Country CAGR (%)
China 8.1
India 7.5
Germany 6.9
Brazil 6.3
USA 5.7
UK 5.1
Japan 4.5

How is China leading the High Purity Flow Meter Market?

China’s market grows at 8.1% CAGR, supported by expanding pharmaceutical production, rapid semiconductor-fabrication development, and increased investment in biotechnology facilities requiring contamination-controlled fluid-measurement equipment. High purity flow meters are used in ultrapure water systems, chemical-delivery lines, and process environments where precision and material compatibility are essential. Domestic manufacturers and global suppliers offer fluoropolymer, stainless-steel, and ceramics-based flow meters designed for high-cleanliness pipelines. Growth in biologics manufacturing and electronics assembly strengthens demand for high-accuracy instruments. The expansion of GMP-aligned facilities increases procurement of certified flow-measurement devices.

Key Market Factors:

  • Rising adoption in pharmaceutical, semiconductor, and biotech facilities.
  • Increased demand for fluoropolymer and stainless-steel high purity meters.
  • Broad use in ultrapure water and controlled-chemical delivery lines.
  • Expansion of GMP-compliant manufacturing driving equipment procurement.

How is India advancing the High Purity Flow Meter Market?

India’s market grows at 7.5% CAGR, driven by expansion in life-sciences manufacturing, growth in biologics and vaccine production, and rising demand for precision instrumentation in clean-process environments. High purity flow meters are used in water-for-injection systems, sterile processing lines, and controlled-flow pharmaceutical equipment. Domestic pharmaceutical clusters adopt advanced flow-measurement systems to meet regulatory requirements. Semiconductor assembly, specialty chemicals, and laboratory-process automation contribute to growing consumption. Suppliers offer polymer-lined and stainless-steel meters suited for sanitary and corrosive environments.

Market Development Factors:
  • Strong demand from pharmaceutical and biologics manufacturing sectors.
  • Increased adoption of flow meters in sterile and clean-process lines.
  • Growth in laboratory automation and specialty-chemical processing.
  • Regulatory requirements promoting certified high purity instrumentation.

How is Germany advancing the High Purity Flow Meter Market?

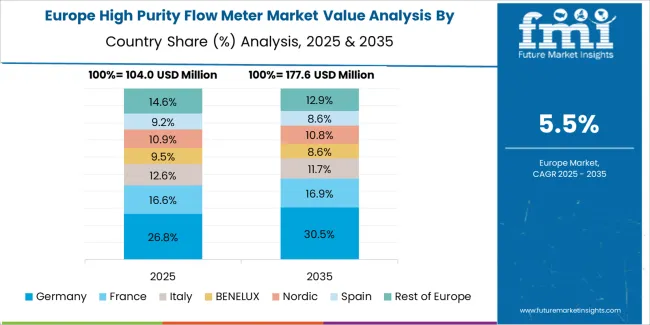
High Purity Flow Meter Market Europe Country Market Share Analysis, 2025 & 2035

Germany’s market grows at 6.9% CAGR, supported by stringent process-control standards and widespread adoption of high-precision instrumentation across pharmaceutical, biotechnology, and semiconductor industries. High purity flow meters are used in sterile fluid-handling systems, ultrapure-water distribution, and chemical-delivery pipelines requiring accuracy and documented cleanliness. German suppliers develop sensors constructed from electropolished stainless steel and high-grade polymers designed for strict hygienic standards. Demand increases in advanced manufacturing facilities where reliability, compliance, and traceable performance documentation are essential.

Key Market Characteristics:

  • Strong adherence to regulated hygienic and manufacturing standards.
  • High adoption in semiconductor, biotech, and pharmaceutical processing.
  • Development of electropolished and compliant high purity flow meters.
  • Industrial demand for documented performance and precision measurement.

How is Brazil developing the High Purity Flow Meter Market?

Brazil’s market grows at 6.3% CAGR, driven by modernization of pharmaceutical plants, increased investment in clean-process systems, and rising adoption of precision flow-measurement equipment. High purity flow meters support sterile production, purified-water systems, and controlled-chemical distribution in pharmaceutical and food-processing environments. Imported polymer-lined and stainless-steel meters dominate supply, while local distributors expand service networks for calibration and validation support. Growth in industrial automation and regulatory alignment with international standards increases the use of contamination-control instrumentation.

Market Development Factors:
  • Increased adoption in pharmaceutical and food-processing facilities.
  • Rising demand for meters supporting purified-water and sterile-fluid lines.
  • Expanded distributor networks offering calibration and maintenance.
  • Growth in automation and regulatory modernization.

How is the United States progressing in the High Purity Flow Meter Market?

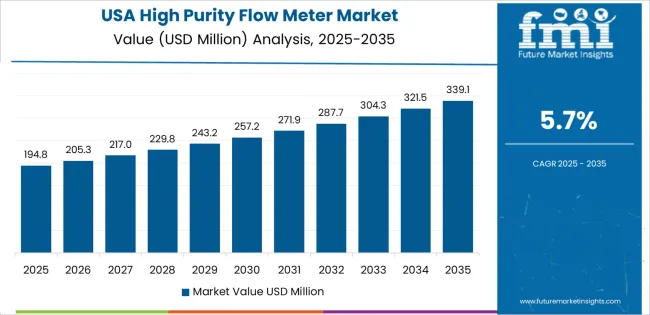
High Purity Flow Meter Market Country Value Analysis

The United States grows at 5.7% CAGR, supported by mature semiconductor fabrication, advanced pharmaceutical manufacturing, and strong biotechnology research activity. High purity flow meters are used in ultrapure-water plants, clean-chemical delivery systems, and sterile production environments. Manufacturers introduce meters with high-accuracy sensors, low dead-volume designs, and materials engineered for cleanroom compliance. Increased demand for process repeatability in biologics, microelectronics, and laboratory automation strengthens adoption. Replacement cycles remain steady across regulated industries maintaining validated equipment.

Key Market Factors:

  • Strong demand from semiconductor fabs, biotech labs, and pharma plants.
  • Development of precision, low-dead-volume flow-measurement designs.
  • High use in ultrapure-water and chemical-delivery applications.
  • Stable replacement needs in validated production environments.

How is the United Kingdom developing the High Purity Flow Meter Market?

The United Kingdom’s market grows at 5.1% CAGR, supported by established pharmaceutical and biotechnology industries and consistent modernization of clean-process systems. High purity flow meters are used in sterile production lines, research laboratories, purified-water pipelines, and controlled-chemical dispensing. Suppliers offer sanitary-certified stainless-steel and fluoropolymer meters aligned with regional regulatory expectations. Growth in advanced therapy manufacturing, analytical laboratories, and process-control upgrades supports steady equipment demand.

Market Development Factors:
  • High adoption in pharmaceutical, biotech, and laboratory environments.
  • Use of sanitary-certified and corrosion-resistant flow meters.
  • Increased investment in advanced therapy and clean-process systems.
  • Consistent demand driven by process-control modernization.

How is Japan maintaining the High Purity Flow Meter Market?

High Purity Flow Meter Market Japan Market Share Analysis By Product Type

Japan’s market grows at 4.5% CAGR, supported by precision manufacturing, strong pharmaceutical activity, and widespread demand for contamination-free flow-measurement technologies. High purity flow meters are integrated into semiconductor-water systems, clean-chemical lines, and sterile production equipment requiring accurate, low-contamination fluid control. Domestic manufacturers emphasize compact, corrosion-resistant designs and high-accuracy sensors suited for controlled-environment processes. Growth in electronics, medical-device production, and fine-chemical industries supports continued adoption.

Key Market Characteristics:
  • Strong use in semiconductor, electronics, and sterile manufacturing.
  • Development of compact, corrosion-resistant flow-measurement devices.
  • High focus on precision and contamination-control performance.
  • Stable demand across regulated and high-precision industrial sectors.

What is the competitive landscape of the High Purity Flow Meter Market?

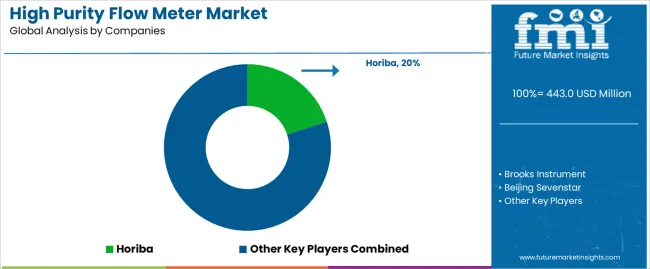
High Purity Flow Meter Market Analysis By Company

The high purity flow meter market is moderately consolidated, with about eighteen manufacturers supplying precision instruments for semiconductor, pharmaceutical, and high-spec industrial processes. Horiba leads the market with an estimated 20.0% global share, supported by its strong position in semiconductor mass flow technology, stable measurement accuracy, and long-term integration with wafer fabrication equipment. Its leadership is reinforced by cleanroom-compliant designs and consistent performance in ultra-high-purity gas and liquid systems.

Brooks Instrument, MKS Instruments, Fujikin, and Bronkhorst follow as major competitors, offering high-precision thermal, Coriolis, and pressure-based flow meters designed for contamination-sensitive applications. Their competitive strengths include repeatable flow control, robust calibration protocols, and adherence to industry standards for high-purity materials handling. Azbil, Alicat Scientific, Tokyo Keiso, and Malema (Dover) maintain strong mid-tier positions, serving semiconductor and biotech facilities with instruments optimized for chemical delivery, slurry monitoring, and ultrapure water systems.

Regional suppliers such as Beijing Sevenstar, MK Precision, Kofloc, LINTEC, SONIC Corporation, Sierra Instruments, SONOTEC, Katronic, and Intek (Bionetics) expand market access through cost-efficient designs, ultrasonic measurement options, and localized service networks.

Competition centers on measurement stability, contamination control, calibration accuracy, material compatibility, and responsiveness to process variations. Market growth is driven by rising semiconductor fabrication capacity, stricter purity standards in advanced manufacturing, and increased adoption of non-contact and high-precision flow measurement technologies for critical process environments.

Key Players in the High Purity Flow Meter Market

  • Horiba
  • Brooks Instrument
  • Beijing Sevenstar
  • Fujikin
  • MKS Instrument
  • Azbil
  • MK Precision Co.,Ltd
  • Kofloc
  • Bronkhorst
  • LINTEC
  • Alicat Scientific
  • FLEXIM
  • SONIC Corporation
  • TOKYO KEISO
  • Malema (Dover)
  • Sierra Instruments
  • SONOTEC
  • Katronic
  • Intek (Bionetics)

Scope of the Report

Items Values
Quantitative Units USD million
Product Type Gas Flow Meters, Fluid Flow Meters
Application Semiconductor, Chemicals, Pharmaceutical, Others
Regions Covered Asia Pacific, Europe, North America, Latin America, Middle East & Africa
Countries Covered India, China, USA, Germany, South Korea, Japan, Italy, and 40+ countries
Key Companies Profiled Horiba, Brooks Instrument, Beijing Sevenstar, Fujikin, MKS Instrument, Azbil, MK Precision Co., Ltd., Kofloc, Bronkhorst, LINTEC, Alicat Scientific, FLEXIM, SONIC Corporation, TOKYO KEISO, Malema (Dover), Sierra Instruments, SONOTEC, Katronic, Intek (Bionetics)
Additional Attributes Dollar sales by product type and application categories; regional adoption trends across Asia Pacific, Europe, and North America; competitive landscape of high-purity flow measurement technology providers; advancements in ultra-clean gas and fluid flow measurement for semiconductor and pharmaceutical applications; integration with precision manufacturing, chemical processing, and advanced instrumentation systems.

High Purity Flow Meter Market by Segment

Product Type:

  • Gas Flow Meters
  • Fluid Flow Meters

Application:

  • Semiconductor
  • Chemicals
  • Pharmaceutical
  • Others

Region:

  • Asia Pacific
    • China
    • Japan
    • South Korea
    • India
    • Australia & New Zealand
    • ASEAN
    • Rest of Asia Pacific
  • Europe
    • Germany
    • United Kingdom
    • France
    • Italy
    • Spain
    • Nordic
    • BENELUX
    • Rest of Europe
  • North America
    • United States
    • Canada
    • Mexico
  • Latin America
    • Brazil
    • Chile
    • Rest of Latin America
  • Middle East & Africa
    • Kingdom of Saudi Arabia
    • Other GCC Countries
    • Turkey
    • South Africa
    • Other African Union
    • Rest of Middle East & Africa

Frequently Asked Questions

How big is the high purity flow meter market in 2025?

The global high purity flow meter market is estimated to be valued at USD 443.0 million in 2025.

What will be the size of high purity flow meter market in 2035?

The market size for the high purity flow meter market is projected to reach USD 793.3 million by 2035.

How much will be the high purity flow meter market growth between 2025 and 2035?

The high purity flow meter market is expected to grow at a 6.0% CAGR between 2025 and 2035.

What are the key product types in the high purity flow meter market?

The key product types in high purity flow meter market are gas flow meters and fluid flow meters.

Which application segment to contribute significant share in the high purity flow meter market in 2025?

In terms of application, semiconductor segment to command 46.0% share in the high purity flow meter market in 2025.

Table of Content

  1. Executive Summary
    • Global Market Outlook
    • Demand to side Trends
    • Supply to side Trends
    • Technology Roadmap Analysis
    • Analysis and Recommendations
  2. Market Overview
    • Market Coverage / Taxonomy
    • Market Definition / Scope / Limitations
  3. Market Background
    • Market Dynamics
      • Drivers
      • Restraints
      • Opportunity
      • Trends
    • Scenario Forecast
      • Demand in Optimistic Scenario
      • Demand in Likely Scenario
      • Demand in Conservative Scenario
    • Opportunity Map Analysis
    • Product Life Cycle Analysis
    • Supply Chain Analysis
    • Investment Feasibility Matrix
    • Value Chain Analysis
    • PESTLE and Porter’s Analysis
    • Regulatory Landscape
    • Regional Parent Market Outlook
    • Production and Consumption Statistics
    • Import and Export Statistics
  4. Global Market Analysis 2020 to 2024 and Forecast, 2025 to 2035
    • Historical Market Size Value (USD Million) Analysis, 2020 to 2024
    • Current and Future Market Size Value (USD Million) Projections, 2025 to 2035
      • Y to o to Y Growth Trend Analysis
      • Absolute $ Opportunity Analysis
  5. Global Market Pricing Analysis 2020 to 2024 and Forecast 2025 to 2035
  6. Global Market Analysis 2020 to 2024 and Forecast 2025 to 2035, By Product Type
    • Introduction / Key Findings
    • Historical Market Size Value (USD Million) Analysis By Product Type , 2020 to 2024
    • Current and Future Market Size Value (USD Million) Analysis and Forecast By Product Type , 2025 to 2035
      • Gas Flow Meters
      • Fluid Flow Meters
    • Y to o to Y Growth Trend Analysis By Product Type , 2020 to 2024
    • Absolute $ Opportunity Analysis By Product Type , 2025 to 2035
  7. Global Market Analysis 2020 to 2024 and Forecast 2025 to 2035, By Application
    • Introduction / Key Findings
    • Historical Market Size Value (USD Million) Analysis By Application, 2020 to 2024
    • Current and Future Market Size Value (USD Million) Analysis and Forecast By Application, 2025 to 2035
      • Semiconductor
      • Chemicals
      • Pharmaceutical
      • Others
    • Y to o to Y Growth Trend Analysis By Application, 2020 to 2024
    • Absolute $ Opportunity Analysis By Application, 2025 to 2035
  8. Global Market Analysis 2020 to 2024 and Forecast 2025 to 2035, By Region
    • Introduction
    • Historical Market Size Value (USD Million) Analysis By Region, 2020 to 2024
    • Current Market Size Value (USD Million) Analysis and Forecast By Region, 2025 to 2035
      • North America
      • Latin America
      • Western Europe
      • Eastern Europe
      • East Asia
      • South Asia and Pacific
      • Middle East & Africa
    • Market Attractiveness Analysis By Region
  9. North America Market Analysis 2020 to 2024 and Forecast 2025 to 2035, By Country
    • Historical Market Size Value (USD Million) Trend Analysis By Market Taxonomy, 2020 to 2024
    • Market Size Value (USD Million) Forecast By Market Taxonomy, 2025 to 2035
      • By Country
        • USA
        • Canada
        • Mexico
      • By Product Type
      • By Application
    • Market Attractiveness Analysis
      • By Country
      • By Product Type
      • By Application
    • Key Takeaways
  10. Latin America Market Analysis 2020 to 2024 and Forecast 2025 to 2035, By Country
    • Historical Market Size Value (USD Million) Trend Analysis By Market Taxonomy, 2020 to 2024
    • Market Size Value (USD Million) Forecast By Market Taxonomy, 2025 to 2035
      • By Country
        • Brazil
        • Chile
        • Rest of Latin America
      • By Product Type
      • By Application
    • Market Attractiveness Analysis
      • By Country
      • By Product Type
      • By Application
    • Key Takeaways
  11. Western Europe Market Analysis 2020 to 2024 and Forecast 2025 to 2035, By Country
    • Historical Market Size Value (USD Million) Trend Analysis By Market Taxonomy, 2020 to 2024
    • Market Size Value (USD Million) Forecast By Market Taxonomy, 2025 to 2035
      • By Country
        • Germany
        • UK
        • Italy
        • Spain
        • France
        • Nordic
        • BENELUX
        • Rest of Western Europe
      • By Product Type
      • By Application
    • Market Attractiveness Analysis
      • By Country
      • By Product Type
      • By Application
    • Key Takeaways
  12. Eastern Europe Market Analysis 2020 to 2024 and Forecast 2025 to 2035, By Country
    • Historical Market Size Value (USD Million) Trend Analysis By Market Taxonomy, 2020 to 2024
    • Market Size Value (USD Million) Forecast By Market Taxonomy, 2025 to 2035
      • By Country
        • Russia
        • Poland
        • Hungary
        • Balkan & Baltic
        • Rest of Eastern Europe
      • By Product Type
      • By Application
    • Market Attractiveness Analysis
      • By Country
      • By Product Type
      • By Application
    • Key Takeaways
  13. East Asia Market Analysis 2020 to 2024 and Forecast 2025 to 2035, By Country
    • Historical Market Size Value (USD Million) Trend Analysis By Market Taxonomy, 2020 to 2024
    • Market Size Value (USD Million) Forecast By Market Taxonomy, 2025 to 2035
      • By Country
        • China
        • Japan
        • South Korea
      • By Product Type
      • By Application
    • Market Attractiveness Analysis
      • By Country
      • By Product Type
      • By Application
    • Key Takeaways
  14. South Asia and Pacific Market Analysis 2020 to 2024 and Forecast 2025 to 2035, By Country
    • Historical Market Size Value (USD Million) Trend Analysis By Market Taxonomy, 2020 to 2024
    • Market Size Value (USD Million) Forecast By Market Taxonomy, 2025 to 2035
      • By Country
        • India
        • ASEAN
        • Australia & New Zealand
        • Rest of South Asia and Pacific
      • By Product Type
      • By Application
    • Market Attractiveness Analysis
      • By Country
      • By Product Type
      • By Application
    • Key Takeaways
  15. Middle East & Africa Market Analysis 2020 to 2024 and Forecast 2025 to 2035, By Country
    • Historical Market Size Value (USD Million) Trend Analysis By Market Taxonomy, 2020 to 2024
    • Market Size Value (USD Million) Forecast By Market Taxonomy, 2025 to 2035
      • By Country
        • Kingdom of Saudi Arabia
        • Other GCC Countries
        • Turkiye
        • South Africa
        • Other African Union
        • Rest of Middle East & Africa
      • By Product Type
      • By Application
    • Market Attractiveness Analysis
      • By Country
      • By Product Type
      • By Application
    • Key Takeaways
  16. Key Countries Market Analysis
    • USA
      • Pricing Analysis
      • Market Share Analysis, 2024
        • By Product Type
        • By Application
    • Canada
      • Pricing Analysis
      • Market Share Analysis, 2024
        • By Product Type
        • By Application
    • Mexico
      • Pricing Analysis
      • Market Share Analysis, 2024
        • By Product Type
        • By Application
    • Brazil
      • Pricing Analysis
      • Market Share Analysis, 2024
        • By Product Type
        • By Application
    • Chile
      • Pricing Analysis
      • Market Share Analysis, 2024
        • By Product Type
        • By Application
    • Germany
      • Pricing Analysis
      • Market Share Analysis, 2024
        • By Product Type
        • By Application
    • UK
      • Pricing Analysis
      • Market Share Analysis, 2024
        • By Product Type
        • By Application
    • Italy
      • Pricing Analysis
      • Market Share Analysis, 2024
        • By Product Type
        • By Application
    • Spain
      • Pricing Analysis
      • Market Share Analysis, 2024
        • By Product Type
        • By Application
    • France
      • Pricing Analysis
      • Market Share Analysis, 2024
        • By Product Type
        • By Application
    • India
      • Pricing Analysis
      • Market Share Analysis, 2024
        • By Product Type
        • By Application
    • ASEAN
      • Pricing Analysis
      • Market Share Analysis, 2024
        • By Product Type
        • By Application
    • Australia & New Zealand
      • Pricing Analysis
      • Market Share Analysis, 2024
        • By Product Type
        • By Application
    • China
      • Pricing Analysis
      • Market Share Analysis, 2024
        • By Product Type
        • By Application
    • Japan
      • Pricing Analysis
      • Market Share Analysis, 2024
        • By Product Type
        • By Application
    • South Korea
      • Pricing Analysis
      • Market Share Analysis, 2024
        • By Product Type
        • By Application
    • Russia
      • Pricing Analysis
      • Market Share Analysis, 2024
        • By Product Type
        • By Application
    • Poland
      • Pricing Analysis
      • Market Share Analysis, 2024
        • By Product Type
        • By Application
    • Hungary
      • Pricing Analysis
      • Market Share Analysis, 2024
        • By Product Type
        • By Application
    • Kingdom of Saudi Arabia
      • Pricing Analysis
      • Market Share Analysis, 2024
        • By Product Type
        • By Application
    • Turkiye
      • Pricing Analysis
      • Market Share Analysis, 2024
        • By Product Type
        • By Application
    • South Africa
      • Pricing Analysis
      • Market Share Analysis, 2024
        • By Product Type
        • By Application
  17. Market Structure Analysis
    • Competition Dashboard
    • Competition Benchmarking
    • Market Share Analysis of Top Players
      • By Regional
      • By Product Type
      • By Application
  18. Competition Analysis
    • Competition Deep Dive
      • Horiba
        • Overview
        • Product Portfolio
        • Profitability by Market Segments (Product/Age /Sales Channel/Region)
        • Sales Footprint
        • Strategy Overview
          • Marketing Strategy
          • Product Strategy
          • Channel Strategy
      • Brooks Instrument
      • Beijing Sevenstar
      • Fujikin
      • MKS Instrument
      • Azbil
      • MK Precision Co.,Ltd
      • Kofloc
      • Bronkhorst
      • LINTEC
      • Alicat Scientific
      • FLEXIM
      • SONIC Corporation
      • TOKYO KEISO
      • Malema (Dover)
      • Sierra Instruments
      • SONOTEC
      • Katronic
      • Intek (Bionetics)
  19. Assumptions & Acronyms Used
  20. Research Methodology

List of Tables

  • Table 1: Global Market Value (USD Million) Forecast by Region, 2020 to 2035
  • Table 2: Global Market Value (USD Million) Forecast by Product Type , 2020 to 2035
  • Table 3: Global Market Value (USD Million) Forecast by Application, 2020 to 2035
  • Table 4: North America Market Value (USD Million) Forecast by Country, 2020 to 2035
  • Table 5: North America Market Value (USD Million) Forecast by Product Type , 2020 to 2035
  • Table 6: North America Market Value (USD Million) Forecast by Application, 2020 to 2035
  • Table 7: Latin America Market Value (USD Million) Forecast by Country, 2020 to 2035
  • Table 8: Latin America Market Value (USD Million) Forecast by Product Type , 2020 to 2035
  • Table 9: Latin America Market Value (USD Million) Forecast by Application, 2020 to 2035
  • Table 10: Western Europe Market Value (USD Million) Forecast by Country, 2020 to 2035
  • Table 11: Western Europe Market Value (USD Million) Forecast by Product Type , 2020 to 2035
  • Table 12: Western Europe Market Value (USD Million) Forecast by Application, 2020 to 2035
  • Table 13: Eastern Europe Market Value (USD Million) Forecast by Country, 2020 to 2035
  • Table 14: Eastern Europe Market Value (USD Million) Forecast by Product Type , 2020 to 2035
  • Table 15: Eastern Europe Market Value (USD Million) Forecast by Application, 2020 to 2035
  • Table 16: East Asia Market Value (USD Million) Forecast by Country, 2020 to 2035
  • Table 17: East Asia Market Value (USD Million) Forecast by Product Type , 2020 to 2035
  • Table 18: East Asia Market Value (USD Million) Forecast by Application, 2020 to 2035
  • Table 19: South Asia and Pacific Market Value (USD Million) Forecast by Country, 2020 to 2035
  • Table 20: South Asia and Pacific Market Value (USD Million) Forecast by Product Type , 2020 to 2035
  • Table 21: South Asia and Pacific Market Value (USD Million) Forecast by Application, 2020 to 2035
  • Table 22: Middle East & Africa Market Value (USD Million) Forecast by Country, 2020 to 2035
  • Table 23: Middle East & Africa Market Value (USD Million) Forecast by Product Type , 2020 to 2035
  • Table 24: Middle East & Africa Market Value (USD Million) Forecast by Application, 2020 to 2035

List of Figures

  • Figure 1: Global Market Pricing Analysis
  • Figure 2: Global Market Value (USD Million) Forecast 2020-2035
  • Figure 3: Global Market Value Share and BPS Analysis by Product Type , 2025 and 2035
  • Figure 4: Global Market Y-o-Y Growth Comparison by Product Type , 2025-2035
  • Figure 5: Global Market Attractiveness Analysis by Product Type
  • Figure 6: Global Market Value Share and BPS Analysis by Application, 2025 and 2035
  • Figure 7: Global Market Y-o-Y Growth Comparison by Application, 2025-2035
  • Figure 8: Global Market Attractiveness Analysis by Application
  • Figure 9: Global Market Value (USD Million) Share and BPS Analysis by Region, 2025 and 2035
  • Figure 10: Global Market Y-o-Y Growth Comparison by Region, 2025-2035
  • Figure 11: Global Market Attractiveness Analysis by Region
  • Figure 12: North America Market Incremental Dollar Opportunity, 2025-2035
  • Figure 13: Latin America Market Incremental Dollar Opportunity, 2025-2035
  • Figure 14: Western Europe Market Incremental Dollar Opportunity, 2025-2035
  • Figure 15: Eastern Europe Market Incremental Dollar Opportunity, 2025-2035
  • Figure 16: East Asia Market Incremental Dollar Opportunity, 2025-2035
  • Figure 17: South Asia and Pacific Market Incremental Dollar Opportunity, 2025-2035
  • Figure 18: Middle East & Africa Market Incremental Dollar Opportunity, 2025-2035
  • Figure 19: North America Market Value Share and BPS Analysis by Country, 2025 and 2035
  • Figure 20: North America Market Value Share and BPS Analysis by Product Type , 2025 and 2035
  • Figure 21: North America Market Y-o-Y Growth Comparison by Product Type , 2025-2035
  • Figure 22: North America Market Attractiveness Analysis by Product Type
  • Figure 23: North America Market Value Share and BPS Analysis by Application, 2025 and 2035
  • Figure 24: North America Market Y-o-Y Growth Comparison by Application, 2025-2035
  • Figure 25: North America Market Attractiveness Analysis by Application
  • Figure 26: Latin America Market Value Share and BPS Analysis by Country, 2025 and 2035
  • Figure 27: Latin America Market Value Share and BPS Analysis by Product Type , 2025 and 2035
  • Figure 28: Latin America Market Y-o-Y Growth Comparison by Product Type , 2025-2035
  • Figure 29: Latin America Market Attractiveness Analysis by Product Type
  • Figure 30: Latin America Market Value Share and BPS Analysis by Application, 2025 and 2035
  • Figure 31: Latin America Market Y-o-Y Growth Comparison by Application, 2025-2035
  • Figure 32: Latin America Market Attractiveness Analysis by Application
  • Figure 33: Western Europe Market Value Share and BPS Analysis by Country, 2025 and 2035
  • Figure 34: Western Europe Market Value Share and BPS Analysis by Product Type , 2025 and 2035
  • Figure 35: Western Europe Market Y-o-Y Growth Comparison by Product Type , 2025-2035
  • Figure 36: Western Europe Market Attractiveness Analysis by Product Type
  • Figure 37: Western Europe Market Value Share and BPS Analysis by Application, 2025 and 2035
  • Figure 38: Western Europe Market Y-o-Y Growth Comparison by Application, 2025-2035
  • Figure 39: Western Europe Market Attractiveness Analysis by Application
  • Figure 40: Eastern Europe Market Value Share and BPS Analysis by Country, 2025 and 2035
  • Figure 41: Eastern Europe Market Value Share and BPS Analysis by Product Type , 2025 and 2035
  • Figure 42: Eastern Europe Market Y-o-Y Growth Comparison by Product Type , 2025-2035
  • Figure 43: Eastern Europe Market Attractiveness Analysis by Product Type
  • Figure 44: Eastern Europe Market Value Share and BPS Analysis by Application, 2025 and 2035
  • Figure 45: Eastern Europe Market Y-o-Y Growth Comparison by Application, 2025-2035
  • Figure 46: Eastern Europe Market Attractiveness Analysis by Application
  • Figure 47: East Asia Market Value Share and BPS Analysis by Country, 2025 and 2035
  • Figure 48: East Asia Market Value Share and BPS Analysis by Product Type , 2025 and 2035
  • Figure 49: East Asia Market Y-o-Y Growth Comparison by Product Type , 2025-2035
  • Figure 50: East Asia Market Attractiveness Analysis by Product Type
  • Figure 51: East Asia Market Value Share and BPS Analysis by Application, 2025 and 2035
  • Figure 52: East Asia Market Y-o-Y Growth Comparison by Application, 2025-2035
  • Figure 53: East Asia Market Attractiveness Analysis by Application
  • Figure 54: South Asia and Pacific Market Value Share and BPS Analysis by Country, 2025 and 2035
  • Figure 55: South Asia and Pacific Market Value Share and BPS Analysis by Product Type , 2025 and 2035
  • Figure 56: South Asia and Pacific Market Y-o-Y Growth Comparison by Product Type , 2025-2035
  • Figure 57: South Asia and Pacific Market Attractiveness Analysis by Product Type
  • Figure 58: South Asia and Pacific Market Value Share and BPS Analysis by Application, 2025 and 2035
  • Figure 59: South Asia and Pacific Market Y-o-Y Growth Comparison by Application, 2025-2035
  • Figure 60: South Asia and Pacific Market Attractiveness Analysis by Application
  • Figure 61: Middle East & Africa Market Value Share and BPS Analysis by Country, 2025 and 2035
  • Figure 62: Middle East & Africa Market Value Share and BPS Analysis by Product Type , 2025 and 2035
  • Figure 63: Middle East & Africa Market Y-o-Y Growth Comparison by Product Type , 2025-2035
  • Figure 64: Middle East & Africa Market Attractiveness Analysis by Product Type
  • Figure 65: Middle East & Africa Market Value Share and BPS Analysis by Application, 2025 and 2035
  • Figure 66: Middle East & Africa Market Y-o-Y Growth Comparison by Application, 2025-2035
  • Figure 67: Middle East & Africa Market Attractiveness Analysis by Application
  • Figure 68: Global Market - Tier Structure Analysis
  • Figure 69: Global Market - Company Share Analysis
Dashboard
Dashboard
Dashboard
Dashboard
Dashboard
Dashboard

Our Research Products

Full Research Suite

The "Full Research Suite" delivers actionable market intel, deep dives on markets or technologies, so clients act faster, cut risk, and unlock growth.

Competitor Leaderboard Report

The Leaderboard benchmarks and ranks top vendors, classifying them as Established Leaders, Leading Challengers, or Disruptors & Challengers.

Future Leaders Index

Locates where complements amplify value and substitutes erode it, forecasting net impact by horizon

Market Data & Forecasts

We deliver granular, decision-grade intel: market sizing, 5-year forecasts, pricing, adoption, usage, revenue, and operational KPIs—plus competitor tracking, regulation, and value chains—across 60 countries broadly.

Market Focus Report

Spot the shifts before they hit your P&L. We track inflection points, adoption curves, pricing moves, and ecosystem plays to show where demand is heading, why it is changing, and what to do next across high-growth markets and disruptive tech

Survey Report

Real-time reads of user behavior. We track shifting priorities, perceptions of today’s and next-gen services, and provider experience, then pace how fast tech moves from trial to adoption, blending buyer, consumer, and channel inputs with social signals (#WhySwitch, #UX).

Bespoke Reports

Partner with our analyst team to build a custom report designed around your business priorities. From analysing market trends to assessing competitors or crafting bespoke datasets, we tailor insights to your needs.

Supplier Intelligence

Discovery & Profiling

Capacity & Footprint

Performance & Risk

Compliance & Governance

Commercial Readiness

Who Supplies Whom

Scorecards & Shortlists

Playbooks & Docs

Category Intelligence

Definition & Scope

Demand & Use Cases

Cost Drivers

Market Structure

Supply Chain Map

Trade & Policy

Operating Norms

Deliverables

Buyer Intelligence

Account Basics

Spend & Scope

Procurement Model

Vendor Requirements

Terms & Policies

Entry Strategy

Pain Points & Triggers

Outputs

Pricing Analysis

Benchmarks

Trends

Should-Cost

Indexation

Landed Cost

Commercial Terms

Deliverables

Brand Analysis

Positioning & Value Prop

Share & Presence

Customer Evidence

Go-to-Market

Digital & Reputation

Compliance & Trust

KPIs & Gaps

Outputs

Full Research Suite comprises of:

Market outlook & trends analysis

Market outlook & trends analysis

Interviews & case studies

Interviews & case studies

Strategic recommendations

Strategic recommendations

Vendor profiles & capabilities analysis

Vendor profiles & capabilities analysis

5-year forecasts

5-year forecasts

8 regions and 60+ country-level data splits

8 regions and 60+ country-level data splits

Market segment data splits

Market segment data splits

12 months of continuous data updates

12 months of continuous data updates

DELIVERED AS:

PDF EXCEL ONLINE

Full Research Suite


$5000

$7500

$10000

Buy Report Now
Similar Industry Reports

Similar Industry Reports

High Purity Gas Flow Meter Market

High Purity Gas Flow Meter Market Size and Share Forecast Outlook 2025 to 2035

High Protein Powders Market

High Protein Powders Market Analysis - Size, Share, and Forecast Outlook 2025 to 2035

High Performance Permanent Magnet Market

High Performance Permanent Magnet Market Size and Share Forecast Outlook 2025 to 2035

High Airtight Storage Cabinets Market

High Airtight Storage Cabinets Market Size and Share Forecast Outlook 2025 to 2035

High Voltage Porcelain Bushing Market

High Voltage Porcelain Bushing Market Size and Share Forecast Outlook 2025 to 2035

High Octane Racing Fuel Market

High Octane Racing Fuel Market Size and Share Forecast Outlook 2025 to 2035

High Voltage Air-cooled Battery Compartment Market

High Voltage Air-cooled Battery Compartment Market Size and Share Forecast Outlook 2025 to 2035

High Temperature NiMH Battery Market

High Temperature NiMH Battery Market Size and Share Forecast Outlook 2025 to 2035

High Current Power Supply for Electrophoresis Market

High Current Power Supply for Electrophoresis Market Size and Share Forecast Outlook 2025 to 2035

High Voltage Cable Termination Market

High Voltage Cable Termination Market Size and Share Forecast Outlook 2025 to 2035

High Security Wedge Barricades Market

High Security Wedge Barricades Market Size and Share Forecast Outlook 2025 to 2035

High Performance Liquid Chromatography-Tandem Mass Spectrometry System Market

High Performance Liquid Chromatography-Tandem Mass Spectrometry System Market Size and Share Forecast Outlook 2025 to 2035

High-vacuum Fiber Feedthrough Flanges Market

High-vacuum Fiber Feedthrough Flanges Market Size and Share Forecast Outlook 2025 to 2035

High Pressure Grease Hose Market

High Pressure Grease Hose Market Size and Share Forecast Outlook 2025 to 2035

High Performing Matting Agent Market

High Performing Matting Agent Market Size and Share Forecast Outlook 2025 to 2035

High Reliability Oscillators Market

High Reliability Oscillators Market Size and Share Forecast Outlook 2025 to 2035

High-performance Dual-core Processor Market

High-performance Dual-core Processor Market Size and Share Forecast Outlook 2025 to 2035

High Performance Magnet Market

High Performance Magnet Market Size and Share Forecast Outlook 2025 to 2035

High-frequency RF Evaluation Board Market

High-frequency RF Evaluation Board Market Size and Share Forecast Outlook 2025 to 2035

High Viscosity Mixer Market

High Viscosity Mixer Market Size and Share Forecast Outlook 2025 to 2035

Future Market Insights

High Purity Flow Meter Market

Chat With MaRIA

Chat With

MaRIA

Hi There, I am MaRIA, Your Market Research Intelligence Assistant. How may I help you?