

- Market Size (2026)
- USD 12.1 Bn
- Forecast (2036)
- USD 49.8 Bn
- CAGR (2026 to 2036)
- 15.2%
How big is the High-Protein Functional Soda & Beverage Market in 2026?
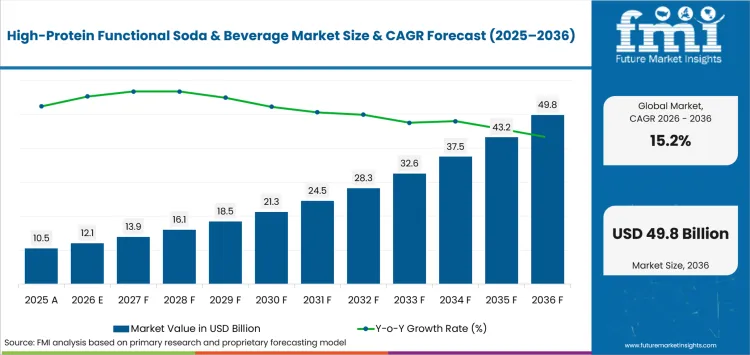
USD 12.1 billion in 2026 and USD 49.8 billion by 2036 at a 15.2% CAGR.
Sales of high-protein functional soda & beverage are projected to rise from USD 12.1 billion in 2026 to USD 49.8 billion by 2036 at a 15.2% CAGR. Protein soda succeeds when brands make protein feel like a clear soft drink rather than a heavy shake. This makes flavour clarity and shelf stability central to repeat purchase.
Retail strategy depends on both claim rules and shelf access. Protein content must match the label promise before a drink moves into ready-to-drink beverages. The same shelf must compete with protein supplements when consumers compare grams of protein per serving. Companies with clear claim evidence and stable taste are better placed to move from trial to repeat orders.
Key Takeaways of High-Protein Functional Soda & Beverage Market
- Demand for high-protein functional soda and beverages is shaped by the need to maintain protein clarity, carbonation stability, and low-sugar positioning while meeting retail shelf-life and label claim requirements across mainstream grocery channels.
- By product, Protein Soda holds 45.3% share in 2026, while Whey accounts for 53.2% share in 2026 within protein source, reflecting clear light drinking occasion fit and the established formulation route for acidic, transparent protein beverages.
- Canada leads country growth at 13.2% CAGR through 2036, followed by Australia at 12.8% and the USA at 12.4%, shaped by retail scale, health-positioned beverage demand, and food and beverage processing capacity.
- Competition centers on PepsiCo, Coca-Cola, Glanbia, Arla Foods Ingredients, Danone, Nestlé, OLIPOP, and Cargill, spanning manufacturing scale, clear whey formulation, protein nutrition, and sugar reduction capabilities.
- Protein claim evidence, stability documentation, carbonation and flavor retention through storage, and repeat-sales performance remain key considerations for wider retail adoption.
- Commercial expansion is expected to follow measured repeat-purchase trends and complaint monitoring, with retail agreements defining protein claim responsibility and quality documentation before broader distribution begins.
Analyst Perspective
"The high-protein functional soda & beverage market is increasingly shaped by repeat consumption rather than nutritional positioning alone. Brands are evaluating protein stability, carbonation, taste, mouthfeel, and label compliance across production and distribution conditions. Companies that maintain sensory quality while delivering credible protein claims and consistent product performance will be better positioned to build sustained consumer acceptance."
- Nandini Roy Choudhury, Principal Analyst at Future Market Insights
Source: FMI's proprietary forecasting model and primary research
How is the High-Protein Functional Soda & Beverage Market segmented?
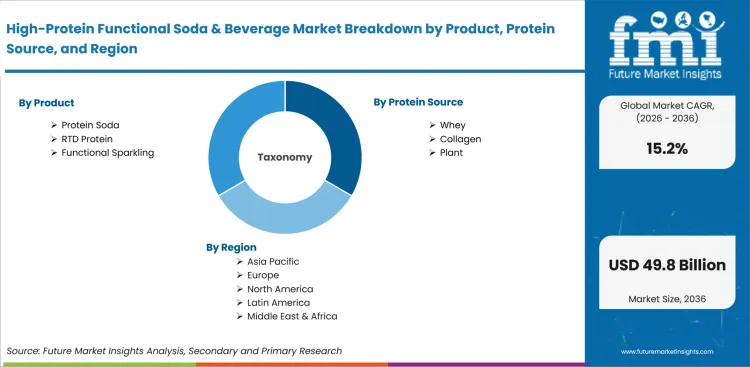
The high-protein functional soda & beverage industry is segmented by product, protein source, sales channel, and region.
The segmentation framework separates the finished drink format from the protein base and route to customer. Product analysis covers Protein Soda, RTD Protein and Functional Sparkling. Protein source analysis covers Whey, Collagen and Plant. Sales channel analysis covers Hypermarkets/Supermarkets, Convenience Stores, Specialty Stores, Online Retail and Foodservice/HoReCa. Regional analysis shows how claims and grocery routes affect adoption across markets.
What supports demand for protein soda within the product category?
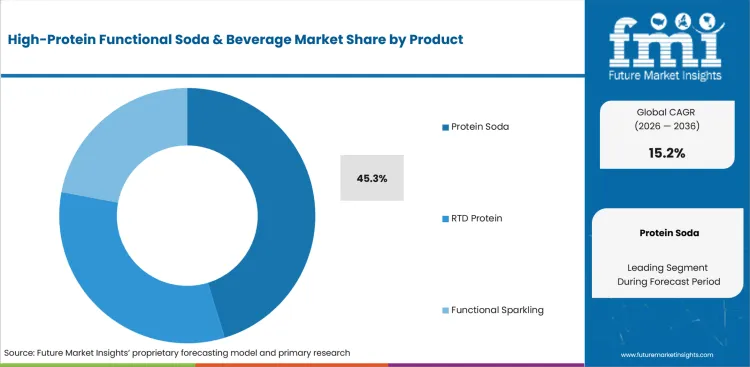
Protein Soda leads the Product category because it solves the hardest launch problem in this market. The product must stay clear after carbonation and still carry a credible protein message. This is why brands benchmark it against protein water and mainstream soda during early testing.
- Protein Soda is expected to hold 45.3% share in 2026 due to its direct fit with the clear and light drinking occasion.
- Retail acceptance improves when the drink keeps its clear look and flavour profile after normal storage.
How does whey shape demand within the protein source category?
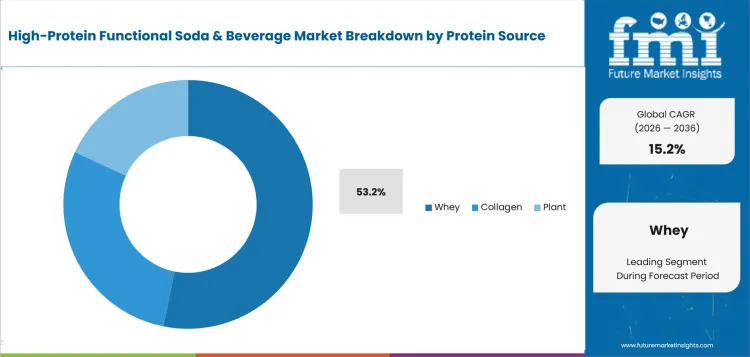
Whey remains central because clear acidic beverages usually depend on processed whey fractions that stay dispersed at low pH. The issue is not protein content alone. Brands have to manage acid taste and haze before a product reaches repeat purchase. This gives whey protein ingredients and whey protein isolate a direct role in formulation work.
- Whey is projected to account for 53.2% share in 2026 as it gives manufacturers a familiar route for clear protein drinks.
- Commercial approval depends on matching a defined whey specification with carbonation and shelf-life targets.
Why do hypermarkets/supermarkets lead the sales channel category?
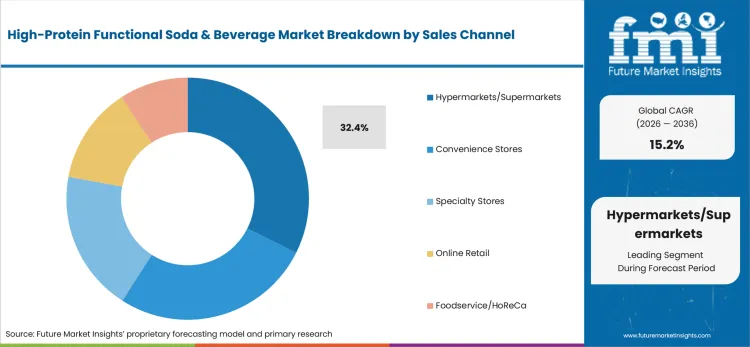
Hypermarkets/Supermarkets lead because protein soda still needs visible shelf trial before repeat purchase builds. A retail set lets consumers compare taste and nutrition claims with familiar soda and protein drinks. The channel is demanding because a new drink has to prove movement without creating returns or spoilage problems.
- Hypermarkets/Supermarkets are estimated to hold 32.4% share in 2026 due to their role in mainstream beverage trial.
- The channel remains selective when the product has to justify shelf space with repeat sales and stable in-store quality.
What are the drivers, restraints, and opportunities in the High-Protein Functional Soda & Beverage Market?
Clear whey processing, claim validation and low-sugar formulation economics are shaping demand for high-protein functional soda & beverage.
- Driver: Clear whey processing gives beverage brands a route to add protein without a heavy shake texture.
- Restraint: Protein and sweetener claims require country-specific documentation before labels are approved.
- Opportunity: Functional soda launches create space for protein formats that keep taste and clarity stable.
Demand is expected to rise where brands make protein feel closer to soda than a shake. Arla Foods Ingredients announced in May 2025 that it would showcase a protein soda concept built with Lacprodan BLG-100 at Vitafoods Europe. The announcement gives manufacturers a clear example of how pure whey fractions are being positioned for carbonated drinks. Commercial value depends on whether the same clarity and taste hold after scale-up.
The main restraint is the cost of proving claims across jurisdictions. Under 21 CFR 101.54, a good source claim in the United States requires 10% to 19% of the Daily Reference Value per reference amount customarily consumed; for protein specifically, quality must also be assessed using a corrected protein quality score before the claim can appear on packaging. This makes protein quality and serving size part of the commercial label file. Brands that miss this step risk reformulation before listing. Acid stability then adds another check because poor flavour control weakens repeat purchase.
The primary opportunity is concentrated in formats that combine low sugar with light texture and credible nutrition positioning. PepsiCo announced Pepsi Prebiotic Cola in July 2025 after completing its poppi acquisition earlier that year, with the product available online in fall 2025 and at retail in early 2026. The launch shows how functional soda is moving into mainstream cola space. Protein versions can use the same shelf route when the drink stays clear and easy to repeat purchase.
Which country CAGRs are profiled in the High-Protein Functional Soda & Beverage Market?
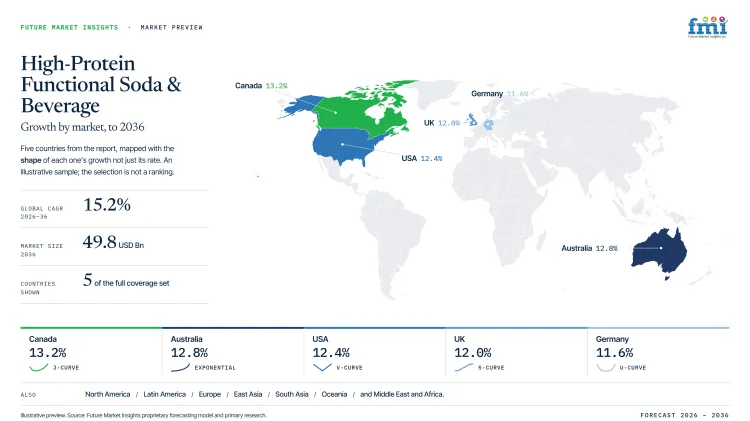
| Country | CAGR |
|---|---|
| USA | 12.4% |
| UK | 12.0% |
| Germany | 11.6% |
| Australia | 12.8% |
| Canada | 13.2% |
How do country-level CAGRs compare in the High-Protein Functional Soda & Beverage Market?
The country comparison shows a moderate step-down across the five profiled markets. Canada and Australia are at the upper end of the range. The USA and UK form a close middle band. Germany records the lowest country CAGR in the set. The 1.6 percentage-point spread shows that growth remains grouped even though entry conditions differ by country.
- Canada leads the comparison and shows the fastest route from retail trial to repeat purchasing.
- Australia follows Canada with a small gap and benefits from health-positioned beverage trial.
- The USA and UK remain close because both markets combine large retail systems with strict claim checks.
- Germany records the slowest growth among the listed countries due to stronger price and documentation pressure.
- The pattern shows a gradual slope and not a sharp divide between high-growth and lower-growth countries.
Markets with similar CAGRs can still require different entry plans due to label rules and shelf economics. The full report provides country-level analysis across North America, Latin America, Europe, East Asia, South Asia, Oceania and the Middle East and Africa.
Country-wise Analysis
- Canada records the highest country CAGR in the set because retail scale and local processing capacity support repeat grocery tests. Sales are projected to expand at 13.2% CAGR from 2026 to 2036. Launch plans need bilingual labels and proof that protein claims meet Canadian rules before broad listing.
- Australia combines supermarket reach with a warm beverage occasion that favours light refreshment. Demand is forecast to rise at 12.8% CAGR through 2036. Product testing still has to prove flavour stability because protein bitterness can weaken repeat purchase.
- United States retailers give brands a large trial base for protein soda and clear protein drinks. Demand is projected to post 12.4% CAGR from 2026 to 2036. USDA ERS reported in June 2026 that total USA food spending reached USD 2.51 trillion in 2025. The USA Census Bureau reported in May 2026 that e-commerce accounted for 16.9% of total retail sales in Q1 2026. The figures support both shelf trial and digital replenishment after consumers accept taste. Launch files still need clear protein quality evidence before a good-source message moves into packaging.
- UK growth is shaped by retail recovery and sugar levy rules together. Demand is estimated to expand at 12.0% CAGR from 2026 to 2036. ONS reported in June 2026 that Great Britain retail sales volumes rose 3.2% over the year to May 2026. GOV.UK lists April 2026 Soft Drinks Industry Levy rates of GBP 2.08 and GBP 2.78 per 10 litres for lower and higher sugar bands. This means protein soda launches need a label route that balances sugar reduction with taste. Retailers are expected to ask for repeat-sales evidence before moving the format beyond trial shelves.
- Germany is expected to move more slowly because retailers require careful claim evidence and stable shelf performance. Demand is forecast to advance at 11.6% CAGR through 2036. Destatis reported in June 2026 that retail turnover rose 1.1% in real terms in May 2026 from April 2026. EFSA confirmed in February 2026 that the sucralose acceptable daily intake remains 15 mg/kg body weight per day. The retail figure supports controlled launch tests in a large grocery setting. The sweetener review keeps reduced-sugar formulation under close safety and exposure checks.
Who are the notable companies in the High-Protein Functional Soda & Beverage Market?
PepsiCo, The Coca-Cola Company, Nestlé S.A., Glanbia plc, Danone S.A., Arla Foods Ingredients Group P/S, OLIPOP PBC, and Cargill, Incorporated are the notable companies profiled in this market.
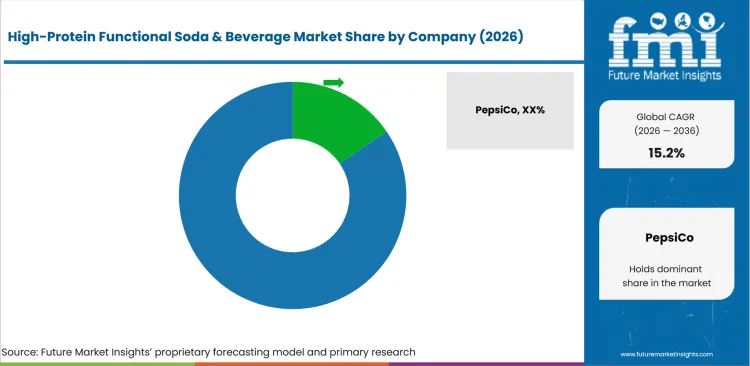
The competitive outlook combines beverage companies with protein ingredient groups and functional soda brands. Beverage companies compete through shelf access and repeat purchase. Ingredient groups compete through solubility and taste support. Functional soda brands compete through consumer familiarity with low-sugar carbonated wellness drinks.
- PepsiCo and The Coca-Cola Company bring beverage scale and retailer access. Their role is strongest where functional soda or protein beverage brands need national distribution support.
- Glanbia plc and Arla Foods Ingredients Group P/S support the formulation route. Their commercial fit depends on clear whey performance and application support for acidic drinks.
- Danone S.A. and Nestlé S.A. add high-protein nutrition experience across dairy and wellness beverages. OLIPOP PBC brings functional soda positioning that shapes consumer expectations.
- Cargill, Incorporated supports sugar reduction and ingredient balancing. This role becomes useful when protein soda must protect sweetness and mouthfeel without excess sugar.
Competitive Benchmarking: High-Protein Functional Soda & Beverage Market
| Company | Functional Soda or RTD Brand Position | Protein Beverage or Ingredient Fit | Formulation or Scale Support | Geographic Reach |
|---|---|---|---|---|
| PepsiCo | High | Medium | High | Global beverage network |
| The Coca-Cola Company | High | High | High | Global beverage network |
| Nestlé S.A. | Medium | High | High | Global nutrition footprint |
| Glanbia plc | Low | High | High | Global ingredient supply |
| Danone S.A. | Medium | High | Medium | Global dairy and plant-based network |
| Arla Foods Ingredients Group P/S | Low | High | High | Global ingredient supply |
| OLIPOP PBC | High | Low | Medium | United States with expanding retail reach |
| Cargill, Incorporated | Low | Medium | High | Global ingredient supply |
Scoring basis: High indicates documented core capability inside the exact workflow or a directly adjacent commercial offer. Medium indicates support through ingredients or beverage platforms. Low indicates limited direct evidence for the named capability inside protein soda.
Key Developments in the High-Protein Functional Soda & Beverage Market
- In May 2025, PepsiCo completed the acquisition of poppi for USD 1.95 billion. The transaction moved a fast-growing prebiotic soda brand into a global beverage company.
- In July 2026, Danone USA expanded the Silk Protein lineup with protein shakes that contain 30g of protein per ready-to-drink serving. The launch gives Danone a stronger plant-based protein beverage offer for retail shelves where dairy and non-dairy protein drinks compete.
- In July 2026, fairlife announced Nutrition Plan Vanilla availability and said production was underway at its new Webster facility. The update supports wider supply of lactose-free high-protein drinks within The Coca-Cola Company portfolio.
- In September 2025,Cargill said EverSweet stevia sweetener was named a finalist in the 2025 Global Good Awards. The ingredient supports sugar reduction work for drinks that need sweetness without adding heavy sugar loads.
Key Players in the High-Protein Functional Soda & Beverage Market
Beverage and Functional Soda Companies
- PepsiCo
- The Coca-Cola Company
- OLIPOP PBC
Protein Nutrition and Dairy Beverage Companies
- Nestlé S.A.
- Danone S.A.
Ingredient and Formulation Providers
- Glanbia plc
- Arla Foods Ingredients Group P/S
- Cargill, Incorporated
High-Protein Functional Soda & Beverage Market - Report Scope
| Coverage field | Report scope |
|---|---|
| Market breakdown | Product, protein source, sales channel, and region. |
| Quantitative Units | USD Billion, CAGR in %. |
| Market Definition | Packaged carbonated or ready-to-drink beverages that carry high-protein or functional positioning and are sold through retail, online, foodservice, or similar consumer channels. |
| Regions Covered | North America, Latin America, Europe, East Asia, South Asia, Oceania, and Middle East and Africa. |
| Countries Covered | USA, UK, Germany, Australia, and Canada are profiled in the country CAGR section. |
| Key Companies Profiled | PepsiCo, The Coca-Cola Company, Nestlé S.A., Glanbia plc, Danone S.A., Arla Foods Ingredients Group P/S, OLIPOP PBC, and Cargill, Incorporated. |
| Forecast Period | 2026 to 2036. |
| Approach | Hybrid bottom-up and top-down market sizing supported by primary interviews and official desk research. |
High-Protein Functional Soda & Beverage Market - Research Methodology
| Method | Approach |
|---|---|
| Primary Research | FMI analysts gathered input from manufacturers, service providers, technology developers, distributors, end users, procurement teams, and subject-matter experts. Interviews examined purchasing decisions, product or service evaluation, adoption barriers, approval requirements, pricing considerations, and expectations for technical or commercial support. Respondents were also asked what evidence is required before a trial, pilot, or initial order develops into regular purchasing. |
| Desk Research | Desk research covered government statistics, regulatory publications, trade data, industry associations, technical literature, standards, company filings, product information, and official corporate announcements. Sources were reviewed for relevance, publication date, geographic coverage, and consistency with the defined market scope. Claims relating to performance, applications, approvals, capacity, investment, and commercial activity were retained only when supported by credible public evidence. |
| Market Sizing and Forecasting | The market model combined the baseline value with historical performance, segment structure, pricing and volume indicators, adoption levels, company participation, and country-level demand conditions. Forecast assumptions considered economic activity, investment trends, regulatory developments, technology adoption, purchasing cycles, supply availability, and barriers to wider market use. Segment and regional estimates were reconciled before the final market total was calculated. |
| Data Validation | Estimates were checked against multiple independent indicators, including public data, company activity, trade patterns, industry developments, and findings from primary interviews. Validation also tested whether products, services, applications, and company revenues fell within the defined market boundaries. Adjacent categories, unsupported claims, overlapping revenues, and activities without direct market relevance were excluded to reduce double counting and maintain consistency across segments and countries. |
High-Protein Functional Soda & Beverage Market by Segments
High-Protein Functional Soda & Beverage Market segmented by Product:
- Protein Soda
- RTD Protein
- Functional Sparkling
High-Protein Functional Soda & Beverage Market segmented by Protein Source:
- Whey
- Collagen
- Plant
High-Protein Functional Soda & Beverage Market segmented by Sales Channel:
- Hypermarkets/Supermarkets
- Convenience Stores
- Specialty Stores
- Online Retail
- Foodservice/HoReCa
High-Protein Functional Soda & Beverage Market by Region:
- North America
- United States
- Canada
- Latin America
- Brazil
- Mexico
- Argentina
- Chile
- Western Europe
- Germany
- France
- United Kingdom
- Italy
- Spain
- Benelux
- Nordics
- Eastern Europe
- Poland
- Czech Republic
- Romania
- Hungary
- East Asia
- China
- Japan
- South Korea
- South Asia and Pacific
- India
- ASEAN
- Australia and New Zealand
- Middle East and Africa
- GCC Countries
- South Africa
- Türkiye
- Israel
Research Sources and Bibliography
- Arla Foods Ingredients. (2025, May 6). Arla Foods Ingredients showcases protein soda concept at Vitafoods Europe.
- Electronic Code of Federal Regulations. (2026). 21 CFR 101.54: Nutrient content claims for good source, high, more, and high potency.
- PepsiCo. (2025, July 21). PepsiCo launches first ever Prebiotic Cola in traditional cola category.
- USA Department of Agriculture, Economic Research Service. (2026, June). Total USA food spending reached $2.51 trillion in 2025.
- USA Census Bureau. (2026, May 18). Quarterly Retail E-Commerce Sales Report.
- USA Bureau of Labor Statistics. (2026, July 14). Consumer Price Index News Release - 2026 M06 Results.
- Office for National Statistics. (2026, June 19). Retail sales, Great Britain: May 2026.
- Statistisches Bundesamt. (2026, June 30). Einzelhandelsumsatz im Mai 2026 real um 1,1 % höher als im Vormonat.
- European Food Safety Authority. (2026, February 17). EFSA finds sucralose safe when used as currently authorised; cannot confirm safety of extending its use.
- Australian Bureau of Statistics. (2026, June 25). Monthly Household Spending Indicator, May 2026.
- Australian Institute of Health and Welfare. (2026, June 24). Growing rates of overweight and obesity in Australia.
- Agriculture and Agri-Food Canada. (2026, February 12). Deputy minister’s briefing book: February 12, 2026.
- PepsiCo. (2025, May 19). PepsiCo completes acquisition of poppi, accelerating strategic portfolio transformation.
- Danone. (2026, July). Silk expands plant-powered nutrition offerings in high-protein and fiber with new Silk Protein Yogurt and Shakes.
- fairlife. (2026, July 6). fairlife Nutrition Plan Vanilla is Now Available.
- Cargill. (2025, September 26). Cargill’s EverSweet stevia sweetener named a finalist in the 2025 Global Good Awards Game Changing Innovation of the Year.
This bibliography is provided for reader reference and is not exhaustive. The full report contains the complete reference list and detailed citations.
This Report Answers
- How large is the high-protein functional soda & beverage market in 2026 and 2036?
- Which formulation pressures support investment in clear high-protein soda?
- Why does Protein Soda lead the Product category in 2026?
- How does Whey influence protein source selection?
- Why do Hypermarkets/Supermarkets hold the leading sales channel share?
- How do country growth rates differ across the profiled country set?
- Which companies support protein beverages and functional soda development?
- What limits faster adoption across acidic and carbonated protein drinks?
- How can brands reduce launch risk before national retail rollout?
Frequently Asked Questions
How big is the High-Protein Functional Soda & Beverage Market in 2026?
The high-protein functional soda and beverage market is valued at USD 12.1 billion in 2026 and is forecast to reach USD 49.8 billion by 2036, rising from USD 10.5 billion in 2025, driven by demand for clear, light, and carbonated protein formats that compete with conventional soft drinks and heavy protein shakes.
What is the CAGR of the High-Protein Functional Soda & Beverage Market from 2026 to 2036?
The high-protein functional soda and beverage market is projected to grow at a CAGR of 15.2% between 2026 and 2036, supported by expanding consumer demand for low-sugar functional beverages that combine credible protein content with flavor clarity and shelf stability across mainstream retail channels.
Which product leads the High-Protein Functional Soda & Beverage Market?
Protein Soda accounts for 45.3% of the high-protein functional soda and beverage market by product in 2026, driven by its fit with clear and light carbonated drinking occasions where brands must maintain protein clarity, flavor profile, and carbonation stability through normal storage and retail handling.
Which country is growing fastest in the High-Protein Functional Soda & Beverage Market?
The high-protein functional soda and beverage market in Canada is projected to grow at a CAGR of 13.2% through 2036, supported by retail scale, local food and beverage processing capacity, and a grocery environment that allows brands to build repeat purchasing after successful shelf trials.
Who are the leading companies in the High-Protein Functional Soda & Beverage Market?
Leading companies in the high-protein functional soda and beverage market include PepsiCo, The Coca-Cola Company, Nestlé, Danone, Glanbia, Arla Foods Ingredients, OLIPOP, and Cargill, spanning global beverage distribution networks, clear whey formulation expertise, functional soda positioning, and sugar reduction ingredient supply.
Preview the report firsthand - request a free sample
Get SampleGet the brochure for pricing and purchase details.
Get PDFTable of Content
- Key Takeaways
- Market Size and CAGR
- Top Growth Driver
- Fastest Growing Segment
- Leading Region
- Key Companies
- Emerging Opportunities
- Executive Summary
- Global Market Outlook
- Demand-side Trends
- Supply-side Trends
- Technology Roadmap Analysis
- Analysis and Recommendations
- Analyst Perspective (What is happening? Why now? What should investors know?)
- Key Questions Answered
- How large is the market?
- What is the CAGR?
- What are key trends?
- Which region dominates?
- Who are the leaders?
- Market Overview
- Market Coverage / Taxonomy
- Market Definition / Scope / Limitations
- Research Methodology
- Chapter Orientation
- Analytical Lens and Working Hypotheses
- Market Structure, Signals, and Trend Drivers
- Benchmarking and Cross-market Comparability
- Market Sizing, Forecasting, and Opportunity Mapping
- Research Design and Evidence Framework
- Desk Research Programme (Secondary Evidence)
- Expert Input and Fieldwork (Primary Evidence)
- Tooling, Models, and Reference Databases
- Data Engineering and Model Build
- Quality Assurance and Audit Trail
- Market Background
- Market Dynamics (Drivers, Restraints, Opportunity, Trends)
- Scenario Forecast (Optimistic, Likely, Conservative)
- Impact Analysis
- AI Impact
- Sustainability Impact
- Regulatory Impact
- Technology Impact
- Consumer / Buyer Analysis
- Purchase Drivers
- Adoption Barriers
- Buyer Journey
- Opportunity Map Analysis
- Product Life Cycle Analysis
- Supply Chain Analysis
- Investment Feasibility Matrix
- Value Chain Analysis
- PESTLE and Porter's Analysis
- Regulatory Landscape
- Regional Parent Market Outlook
- Production and Consumption Statistics
- Import and Export Statistics
- Global Market Analysis and Forecast, 2021 to 2036
- Historical Market Size Value (USD Billion) Analysis, 2021 to 2025
- Current and Future Market Size Value (USD Billion) Projections, 2026 to 2036
- Y-o-Y Growth Trend Analysis
- Absolute $ Opportunity Analysis
- Global Market Pricing Analysis, 2021 to 2036
- Global Market Analysis and Forecast, By Product, 2021 to 2036
- Introduction / Key Findings
- Historical Market Size Value (USD Billion) Analysis By Product, 2021 to 2025
- Current and Future Market Size Value (USD Billion) Analysis and Forecast By Product, 2026 to 2036
- Protein Soda
- RTD Protein
- Functional Sparkling
- Protein Soda
- Y-o-Y Growth Trend Analysis By Product, 2021 to 2025
- Absolute $ Opportunity Analysis By Product, 2026 to 2036
- Global Market Analysis and Forecast, By Protein Source, 2021 to 2036
- Introduction / Key Findings
- Historical Market Size Value (USD Billion) Analysis By Protein Source, 2021 to 2025
- Current and Future Market Size Value (USD Billion) Analysis and Forecast By Protein Source, 2026 to 2036
- Whey
- Collagen
- Plant
- Whey
- Y-o-Y Growth Trend Analysis By Protein Source, 2021 to 2025
- Absolute $ Opportunity Analysis By Protein Source, 2026 to 2036
- Global Market Analysis and Forecast, By Sales Channel, 2021 to 2036
- Introduction / Key Findings
- Historical Market Size Value (USD Billion) Analysis By Sales Channel, 2021 to 2025
- Current and Future Market Size Value (USD Billion) Analysis and Forecast By Sales Channel, 2026 to 2036
- Hypermarkets/Supermarkets
- Convenience Stores
- Specialty Stores
- Online Retail
- Foodservice/HoReCa
- Hypermarkets/Supermarkets
- Y-o-Y Growth Trend Analysis By Sales Channel, 2021 to 2025
- Absolute $ Opportunity Analysis By Sales Channel, 2026 to 2036
- Global Market Analysis and Forecast, By Region, 2021 to 2036
- Introduction
- Historical Market Size Value (USD Billion) Analysis By Region, 2021 to 2025
- Current Market Size Value (USD Billion) Analysis and Forecast By Region, 2026 to 2036
- North America
- Latin America
- Western Europe
- Eastern Europe
- East Asia
- South Asia and Pacific
- Middle East & Africa
- Market Attractiveness Analysis By Region
- North America Market Analysis and Forecast, By Country, 2021 to 2036
- Historical Market Size Value (USD Billion) Trend Analysis By Market Taxonomy, 2021 to 2025
- Market Size Value (USD Billion) Forecast By Market Taxonomy, 2026 to 2036
- By Country
- USA
- Canada
- By Product
- By Protein Source
- By Sales Channel
- By Country
- Market Attractiveness Analysis
- By Country
- By Product
- By Protein Source
- By Sales Channel
- Key Takeaways
- Latin America Market Analysis and Forecast, By Country
- Historical Market Size Value (USD Billion) Trend Analysis By Market Taxonomy, 2021 to 2025
- Market Size Value (USD Billion) Forecast By Market Taxonomy, 2026 to 2036
- By Country
- Brazil
- Mexico
- Chile
- Rest of Latin America
- By Product
- By Protein Source
- By Sales Channel
- By Country
- Market Attractiveness Analysis
- By Country
- By Product
- By Protein Source
- By Sales Channel
- Key Takeaways
- Western Europe Market Analysis and Forecast, By Country
- Historical Market Size Value (USD Billion) Trend Analysis By Market Taxonomy, 2021 to 2025
- Market Size Value (USD Billion) Forecast By Market Taxonomy, 2026 to 2036
- By Country
- Germany
- UK
- Italy
- Spain
- France
- Nordic
- BENELUX
- Rest of Western Europe
- By Product
- By Protein Source
- By Sales Channel
- By Country
- Market Attractiveness Analysis
- By Country
- By Product
- By Protein Source
- By Sales Channel
- Key Takeaways
- Eastern Europe Market Analysis and Forecast, By Country
- Historical Market Size Value (USD Billion) Trend Analysis By Market Taxonomy, 2021 to 2025
- Market Size Value (USD Billion) Forecast By Market Taxonomy, 2026 to 2036
- By Country
- Russia
- Poland
- Hungary
- Balkan & Baltic
- Rest of Eastern Europe
- By Product
- By Protein Source
- By Sales Channel
- By Country
- Market Attractiveness Analysis
- By Country
- By Product
- By Protein Source
- By Sales Channel
- Key Takeaways
- East Asia Market Analysis and Forecast, By Country
- Historical Market Size Value (USD Billion) Trend Analysis By Market Taxonomy, 2021 to 2025
- Market Size Value (USD Billion) Forecast By Market Taxonomy, 2026 to 2036
- By Country
- China
- Japan
- South Korea
- By Product
- By Protein Source
- By Sales Channel
- By Country
- Market Attractiveness Analysis
- By Country
- By Product
- By Protein Source
- By Sales Channel
- Key Takeaways
- South Asia and Pacific Market Analysis and Forecast, By Country
- Historical Market Size Value (USD Billion) Trend Analysis By Market Taxonomy, 2021 to 2025
- Market Size Value (USD Billion) Forecast By Market Taxonomy, 2026 to 2036
- By Country
- India
- ASEAN
- Australia & New Zealand
- Rest of South Asia and Pacific
- By Product
- By Protein Source
- By Sales Channel
- By Country
- Market Attractiveness Analysis
- By Country
- By Product
- By Protein Source
- By Sales Channel
- Key Takeaways
- Middle East & Africa Market Analysis and Forecast, By Country
- Historical Market Size Value (USD Billion) Trend Analysis By Market Taxonomy, 2021 to 2025
- Market Size Value (USD Billion) Forecast By Market Taxonomy, 2026 to 2036
- By Country
- Kingdom of Saudi Arabia
- Other GCC Countries
- Türkiye
- South Africa
- Other African Union
- Rest of Middle East & Africa
- By Product
- By Protein Source
- By Sales Channel
- By Country
- Market Attractiveness Analysis
- By Country
- By Product
- By Protein Source
- By Sales Channel
- Key Takeaways
- Key Countries Market Analysis
- USA
- Pricing Analysis
- Market Share Analysis, 2025
- By Product
- By Protein Source
- By Sales Channel
- Canada
- Pricing Analysis
- Market Share Analysis, 2025
- By Product
- By Protein Source
- By Sales Channel
- Mexico
- Pricing Analysis
- Market Share Analysis, 2025
- By Product
- By Protein Source
- By Sales Channel
- Brazil
- Pricing Analysis
- Market Share Analysis, 2025
- By Product
- By Protein Source
- By Sales Channel
- Chile
- Pricing Analysis
- Market Share Analysis, 2025
- By Product
- By Protein Source
- By Sales Channel
- Germany
- Pricing Analysis
- Market Share Analysis, 2025
- By Product
- By Protein Source
- By Sales Channel
- UK
- Pricing Analysis
- Market Share Analysis, 2025
- By Product
- By Protein Source
- By Sales Channel
- Italy
- Pricing Analysis
- Market Share Analysis, 2025
- By Product
- By Protein Source
- By Sales Channel
- Spain
- Pricing Analysis
- Market Share Analysis, 2025
- By Product
- By Protein Source
- By Sales Channel
- France
- Pricing Analysis
- Market Share Analysis, 2025
- By Product
- By Protein Source
- By Sales Channel
- India
- Pricing Analysis
- Market Share Analysis, 2025
- By Product
- By Protein Source
- By Sales Channel
- ASEAN
- Pricing Analysis
- Market Share Analysis, 2025
- By Product
- By Protein Source
- By Sales Channel
- Australia & New Zealand
- Pricing Analysis
- Market Share Analysis, 2025
- By Product
- By Protein Source
- By Sales Channel
- China
- Pricing Analysis
- Market Share Analysis, 2025
- By Product
- By Protein Source
- By Sales Channel
- Japan
- Pricing Analysis
- Market Share Analysis, 2025
- By Product
- By Protein Source
- By Sales Channel
- South Korea
- Pricing Analysis
- Market Share Analysis, 2025
- By Product
- By Protein Source
- By Sales Channel
- Russia
- Pricing Analysis
- Market Share Analysis, 2025
- By Product
- By Protein Source
- By Sales Channel
- Poland
- Pricing Analysis
- Market Share Analysis, 2025
- By Product
- By Protein Source
- By Sales Channel
- Hungary
- Pricing Analysis
- Market Share Analysis, 2025
- By Product
- By Protein Source
- By Sales Channel
- Kingdom of Saudi Arabia
- Pricing Analysis
- Market Share Analysis, 2025
- By Product
- By Protein Source
- By Sales Channel
- Türkiye
- Pricing Analysis
- Market Share Analysis, 2025
- By Product
- By Protein Source
- By Sales Channel
- South Africa
- Pricing Analysis
- Market Share Analysis, 2025
- By Product
- By Protein Source
- By Sales Channel
- USA
- Market Structure Analysis
- Competition Dashboard
- Competition Benchmarking
- Market Share Analysis of Top Players
- By Regional
- By Product
- By Protein Source
- By Sales Channel
- Emerging Startups
- Innovation Benchmarking
- Competition Analysis
- Competition Deep Dive
- PepsiCo
- Overview
- Product Portfolio
- Profitability by Market Segments
- Sales Footprint
- Strategy Overview
- Marketing Strategy
- Product Strategy
- Channel Strategy
- Coca-Cola
- Nestlé
- Glanbia
- Danone
- Arla
- Olipop
- Poppi
- Cargill
- PepsiCo
- Case Studies
- Success Stories
- Recent Developments
- Competition Deep Dive
- Assumptions & Acronyms Used


