Holography in Medical Imaging Market Size and Share Forecast Outlook 2025 to 2035

The holography in medical imaging market is projected to expand from USD 3.7 billion in 2025 to USD 49.1 billion by 2035, at a CAGR of 29.5%. Year-on-year growth rises consistently, from USD 1.1 billion in 2026 to USD 6.7 billion by 2035.
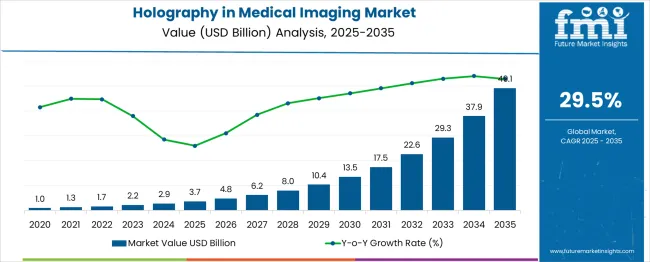
Quick Stats for Holography in Medical Imaging Market

  • Holography in Medical Imaging Market Size (2025): USD 3.7 billion
  • Projected Holography in Medical Imaging Market Size (2035): USD 49.1 billion
  • Forecast CAGR of Holography in Medical Imaging Market (2025 to 2035): 29.5%
  • Leading Segment of Holography in Medical Imaging Market (2025): Medical Imaging (43%)
  • Key Growth Regions of Holography in Medical Imaging Market: South Asia (India with 36.9% CAGR)
  • Top Key Players of Holography in Medical Imaging Market: RealView Imaging Ltd., Holoxica Ltd., EchoPixel Inc., Eon Reality, zSpace,

Holography In Medical Imaging Market Market Value Analysis

Metric Value
Industry Size (2025E) USD 3.7 billion
Industry Value (2035F) USD 49.1 billion
CAGR (2025 to 2035) 29.5%

This trajectory reflects the compounding effect of increased adoption across clinical diagnostics, surgical pre-planning, and academic training. Key drivers include the application of 3D anatomical modeling, neurosurgical visualization, and high-resolution imaging tools.

Post-2029, growth accelerates further due to declining hardware costs and expanded clinical acceptance. Suppliers that establish early compatibility with radiology platforms and surgical workflow tools are positioned to command substantial revenue share throughout the decade.

On March 7, 2024, Christian Zapf, Head of Digital and Automation at Siemens Healthineers, stated: “Cinematic Reality gives people the opportunity to immerse themselves in a world of photorealistic renderings of the human anatomy.

Apple Vision Pro perfectly presents that three-dimensional experience, combined with great flexibility and standalone use. We see great potential for the technology for clinical as well as educational purposes.”

Holography in medical imaging currently holds a modest share across its parent markets. Within the USD 41.6 billion global medical imaging sector, its share stands at approximately 2-3%, reflecting early-stage clinical adoption. In the broader holographic imaging industry, medical use cases account for nearly 15-20% of total market value.

The biomedical research and diagnostics tools market, valued in tens of billions, sees less than 1% contribution from holographic systems due to limited integration. In medical education and training technologies, holography commands a stronger 20-30% share, driven by immersive simulation tools. In surgical planning and navigation platforms, holography accounts for 5-10%, supporting real-time 3D visualization in preoperative and intraoperative workflows. Growth remains high despite current niche positioning.

Analyzing Holography in Medical Imaging Market by Top Investment Segments

The market has been segmented by product, imaging modality, application, and region. Product types include holographic displays, holography microscopes, and holographic prints. Imaging modalities cover computed tomography (CT), ultrasound, X-ray, and magnetic resonance imaging (MRI).

Applications span medical imaging, medical education, and biomedical research. The regional segmentation includes North America, Europe, Asia Pacific, Latin America, and the Middle East & Africa, where adoption rates vary based on reimbursement models, diagnostic infrastructure, and academic investment in imaging technologies.
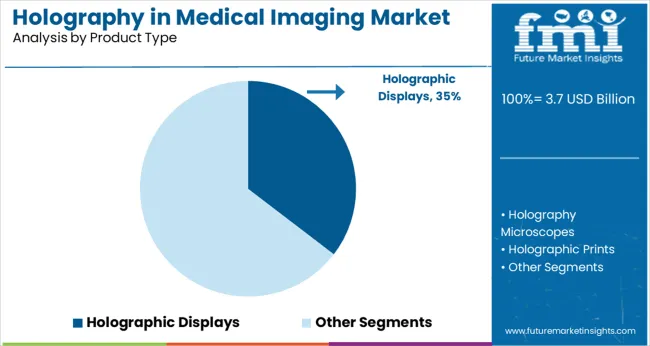
Holographic Displays Maintain Segment Leadership with 35% Share

Holography In Medical Imaging Market Analysis By Product Type

Holographic displays are projected to retain dominance across the medical holography sector, beginning with a 35% share in 2025. Between 2025 and 2027, adoption is driven by academic imaging labs and neurosurgical simulators integrating light field-based visualization.

By 2028, increased precision in digital anatomy renders 3D volumetric imaging standard in radiology training. From 2029 to 2031, cost reductions in AR-compatible holographic panels expand use in secondary hospitals. Between 2032 and 2035, real-time teleholography gains traction in diagnostics, boosting demand for larger-format displays.

Despite competition from holography software, displays maintain over 33% share in 2035, driven by their critical role in physical simulation, surgical planning, and multi-angle visualization in clinical workflows and educational settings.
  • Used in surgical planning for neurological and orthopedic procedures
  • Adopted by leading centers such as Mayo Clinic and Charité
  • Offers interactive visualization beyond traditional 2D display limits

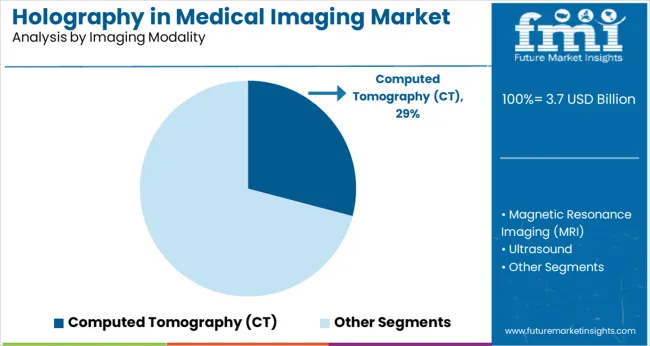
Computed Tomography Leads Imaging Modalities with 29.1% Share

Holography In Medical Imaging Market Analysis By Imaging Modality

Computed tomography leads imaging modalities in the medical holography segment with a 29.1% share in 2025. From 2025 to 2027, holographic reconstruction from CT slices becomes routine in trauma centers and oncology wards, driven by integration with volumetric rendering platforms. Between 2028 and 2030, multislice CT-based holography enhances cardiac and spinal surgery preplanning, particularly in tertiary hospitals.

Cost-per-scan efficiencies and improved spatial resolution fuel expansion across diagnostic hubs by 2031. From 2032 to 2035, CT-based holography is deployed for remote diagnostics in military and field hospitals, supporting its leadership. Despite MRI and PET gaining ground for soft-tissue contrast, CT remains preferred for bone and structural mapping across clinical, educational, and interventional domains.
  • Applied in cancer care centers for treatment planning
  • Used to generate 3D anatomical structures in cardiac diagnostics
  • Adopted in radiology units for thoracic and orthopedic scans

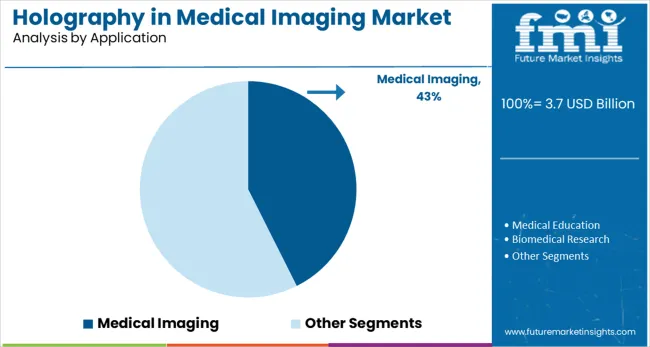
Medical Imaging Holds Top Application Position at 43% Share

Holography In Medical Imaging Market Analysis By Application

Medical imaging holds the top application share at 43% in 2025, reflecting its role as the principal driver of holography adoption in healthcare. Between 2025 and 2027, integration with radiology workstations supports 3D visualization of tumors, vascular malformations, and orthopedic structures. From 2028 to 2030, hospitals increasingly deploy holographic platforms in pre-surgical planning for neurology and cardiology.

Advancements in holographic segmentation and PACS compatibility further boost diagnostic utility. By 2031, portable holography units enter emergency care, expanding access to spatial visualization in trauma cases. Between 2032 and 2035, real-time imaging overlays using intraoperative scans reinforce usage across surgical suites. Medical imaging stands the largest share due to its cross-specialty relevance and procedural decision-making value.

  • Deployed in real-time diagnostic settings for trauma and stroke
  • Adopted by Indian diagnostic labs for histopathological screening
  • Enabled spatial depth clarity in neurology and pulmonary scans

Top Holography in Medical Imaging Market Dynamics

The industry is undergoing transformation as advanced visualization techniques improve diagnostic clarity, surgical accuracy, and medical education. Holography’s adoption is supported by institutional funding and digital health convergence, but its expansion is limited by high system costs, technical complexity, and infrastructure gaps.

High-Fidelity Visualization Enhancing Clinical Precision

Demand for real-time, non-invasive 3D imaging has strengthened the case for holography across surgical planning, diagnostics, and anatomical education. The technology improves depth perception, spatial orientation, and remote collaboration. Integration with AR/VR systems has enabled holographic workflows in cardiology, neurology, and oncology.

  • Academic medical centers use holography to train clinicians on rare pathologies
  • Portable display systems improve access in mobile surgical units
  • North America and Asia-Pacific lead R&D investment in holographic imaging

Infrastructure Costs and Workflow Integration Remain Barriers

Widespread deployment has been slowed by the capital investment required for holography hardware and computing infrastructure. Limited compatibility with PACS/RIS systems and lack of reimbursement frameworks impede hospital-level integration. Regulations governing 3D imaging devices differ by region, delaying clearances.
  • Hardware costs exceed thresholds for most mid-sized clinical centers
  • Workflow integration with existing DICOM imaging stacks is still incomplete
  • Variability in regulatory approval timelines delays commercial rollouts across Asia and EU

Top Countries Advancing, Adopting, and Scaling Holography in Medical Imaging

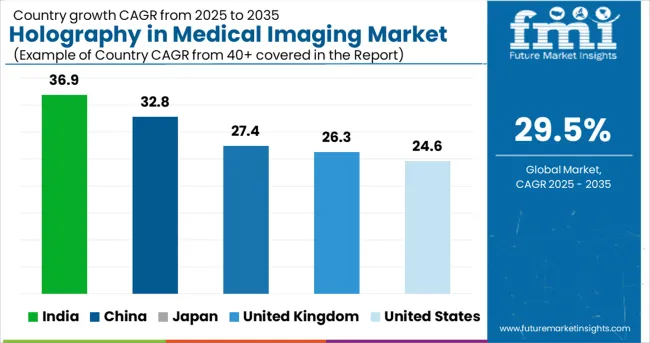
Holography In Medical Imaging Market Cagr Analysis By Country

Countries CAGR (2025 to 2035)
United States 24.6%
United Kingdom 26.3%
India 36.9%
China 32.8%
Japan 27.4%

The global CAGR for holography in medical imaging is projected at 29.5% from 2025 to 2035. India leads at 36.9%, followed by China at 32.8%, both exceeding the global trend due to aggressive medtech scaling, public-private R&D support, and surgical visualization demand. Japan records 27.4%, while the United Kingdom and United States trail at 26.3% and 24.6% respectively.

In India, tertiary care networks and training hospitals are deploying holographic systems for preoperative planning. China is advancing rapidly with AI-linked holography across orthopedics and neurology. USA adoption remains fragmented due to FDA bottlenecks and reimbursement gaps. The United Kingdom and Japan are gradually adopting solutions through institutional pilots and specialist centers.

These five countries serve as benchmarks within the 40+ nations analyzed.

Demand Outlook for Holography in Medical Imaging in the United States

From 2025 to 2035, the holography in medical imaging market in the United States is expected to grow at a CAGR of 24.6%. Broader integration into neurosurgery, interventional cardiology, and remote diagnostics is anticipated. AI-driven platforms and modular holographic units are being embedded into surgical planning systems.

FDA guidance has streamlined device approvals, encouraging clinical adoption. During 2020 to 2024, use was limited to academic pilots and niche radiology centers. Hospitals began testing 3D visualization tools, but large-scale deployment had not occurred. Limited reimbursement and uncertain regulatory classification previously slowed growth.

  • Over 160 hospitals adopted holography labs by end-2024, compared to 21 in 2020
  • FDA cleared five Class II devices for clinical use by early 2025
  • 3D cranial imaging expanded from 4.6 percent in 2020 to 41 percent in 2024

Sales Analysis of Holography in Medical Imaging in the United Kingdom

The United Kingdom market is forecast to grow at a CAGR of 26.3% between 2025 and 2035. NHS digital initiatives and MHRA innovation pathways are driving widespread holography deployment across teaching hospitals. Surgical training, robotic surgery support, and preoperative visualization will dominate clinical applications.

Between 2020 and 2024, usage was limited to research institutions and under 10 NHS trusts. Adoption was experimental, with early trials focusing on static 3D modeling. UKRI increased grant funding post-2021, leading to operational expansion. Clinical validation and trust-level funding approvals became common only after 2022.

  • NHS trusts using holography increased from 8 in 2022 to 31 in 2024
  • UKRI grant funding rose from £4.1 million in 2020 to £18.6 million in 2024
  • Cambridge hospitals transitioned from lab-based trials to full OR integration

In-depth Analysis of Holography in Medical Imaging Market in India

India is projected to experience 36.9% CAGR between 2025 and 2035 in its holography in medical imaging industry. Implementation is being led by private hospital chains, metro diagnostic centers, and national medical institutions. Oncology and neurology departments are incorporating holography for treatment planning and education.

From 2020 to 2024, the technology was largely absent from medical infrastructure, with limited exposure outside conferences and feasibility studies. AIIMS and leading multispecialty hospitals began pilot programs only in 2023. State-backed initiatives and capacity-building efforts have since emerged.

  • AIIMS launched 3 pilot sites in 2024, from zero adoption in 2020
  • Eleven metro-based hospitals added holographic systems for neurosurgery
  • NITI Aayog shifted from draft strategy to active funding deployment in 2025

Opportunity Analysis of Holography in Medical Imaging in China

China is forecast to register 32.8% CAGR between 2025 and 2035. National innovation programs are scaling holography across provincial hospitals, simulation centers, and trauma units. Integration with surgical robotics and AI diagnostics has been prioritized under Med-Innovate 2025.

Between 2020 and 2024, deployment was restricted to tier-one academic and military-linked institutions. Usage remained research-focused, with clinical evaluations limited by infrastructure gaps and procurement delays. Subsidies and regulatory acceleration have since been introduced to stimulate provincial expansion.

  • Four provinces financed holography systems for trauma care by 2024
  • Domestic OEM filings for NMPA approval increased from 1 in 2021 to 6 by 2025
  • Top-tier hospitals expanded use of trauma simulations by 5× from 2020 to 2024

Demand Analysis for Holography in Medical Imaging in Japan

Japan is expected to witness a 27.4% CAGR between 2025 and 2035 for holography in medical imaging. Cardiovascular and orthopedic surgical departments are integrating 3D holography into procedural planning. MHLW has supported pilot reimbursement and curriculum integration across teaching hospitals.

During 2020 to 2024, Japan remained focused on foundational research and limited educational use. Medical universities trialed static 3D modeling tools but avoided clinical transition due to cost and lack of training protocols. The shift began only after 2023 with MHLW policy updates.
  • Seventeen medical schools adopted holography modules by 2025, up from two in 2022
  • Tokyo Medical University transitioned to real-world use in cardiovascular surgery
  • MHLW introduced reimbursement guidelines absent from earlier policy drafts

Competitive Landscape Overview in Holography in Medical Imaging Market

Holography In Medical Imaging Market Analysis By Company

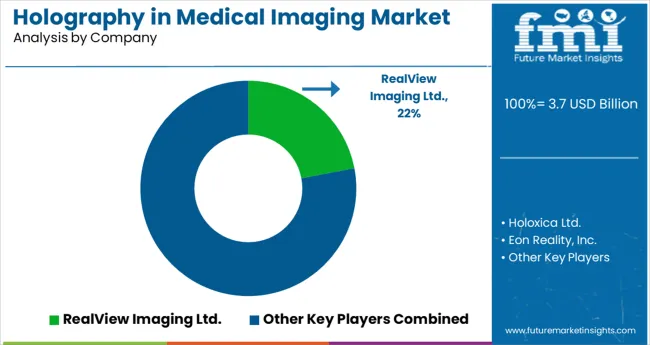
The landscape of the holography in medical imaging market is defined by companies advancing clinical-grade 3D visualization, holographic diagnostics, and simulation-based medical education.RealView Imaging leads with its Holoscope-i system, offering real-time 3D holography for interventional procedures.

EchoPixel’s FDA-cleared True 3D platform supports radiology and surgical planning, while Holoxica focuses on neurological and cardiac holograms. Nanolive SA specializes in live-cell holographic microscopy for biomedical research. Eon Reality and zSpace supply educational holographic tools, widely adopted in anatomy and medical training programs.

Firms like Holografika, Looking Glass Factory, and Leia Inc. drive advancements in light field and autostereoscopic displays for surgical and diagnostic imaging. Mach7 Technologies, while primarily an enterprise imaging platform provider, is positioned to integrate holographic workflows. These companies collectively influence innovation, adoption, and commercialization across education, diagnostics, and clinical visualization.

Leading Company - RealView Imaging Ltd.Industry Share - 22%

Recent Industry News

  • In April 2024, USST researchers developed a split Lohmann lens-based holography method enabling real-time, high-quality 3D visualization with reduced computation, revolutionizing medical imaging, virtual reality, and entertainment applications.
  • In October 2024, Concordia University introduced Holographic Direct Sound Printing (HDSP), a 3D-printing breakthrough using sound waves to rapidly create complex biomedical structures with lower energy use and no layering constraints.

Leading Companies in Holography in Medical Imaging Market

  • RealView Imaging Ltd.
  • Holoxica Ltd.
  • Eon Reality, Inc.
  • EchoPixel Inc.
  • zSpace, Inc.
  • Holografika Kft.
  • Nanolive SA
  • Looking Glass Factory, Inc.
  • Leia Inc.
  • Mach7 Technologies Ltd.

Research Coverage and Scope Summary

Report Attributes Details
Market Size (2025) USD 3.7 billion
Projected Market Size (2035) USD 49.1 billion
CAGR (2025 to 2035) 29.5%
Base Year for Estimation 2024
Historical Period 2020 to 2024
Projections Period 2025 to 2035
Quantitative Units USD billion for value and thousand installations for volume
Product Types Analyzed (Segment 1) Holographic Displays, Holography Microscopes, Holographic Prints, Holography Software, Holoscopes
Imagin g Modalities Analyzed (Segment 2) Computed Tomography (CT), Magnetic Resonance Imaging (MRI), Ultrasound, X-ray, Others
Applications Analyzed (Segment 3) Medical Imaging, Ophthalmology, Dentistry, Urology, Otology, Orthopedics, Other Medical Imaging Applications, Medical Education, Biomedical Research
Regions Covered North America, Europe, Asia Pacific, Latin America, Middle East & Africa
Countries Covered United States, Canada, Germany, United Kingdom, France, Italy, Spain, China, India, Japan, South Korea, Australia, Brazil, Mexico, Argentina, Saudi Arabia, UAE, South Africa
Key Players RealView Imaging Ltd., Holoxica Ltd., Eon Reality, Inc., EchoPixel Inc., zSpace, Inc., Holografika Kft., Nanolive SA, Looking Glass Factory, Inc., Leia Inc., Mach7 Technologies Ltd.
Additional Attributes Dollar sales, share by product and imaging modality, real-time 3D visualization demand, use in surgical planning and medical education, AI integration in diagnostic platforms, expansion of immersive imaging in clinical settings

Key Segments

By Product Type:

This includes Holographic Displays, Holography Microscopes, Holographic Prints, Holography Software, and Holoscopes.

By Imaging Modality:

This includes Computed Tomography (CT), Magnetic Resonance Imaging (MRI), Ultrasound, X-ray, and Others.

By Application:

The segment covers Medical Imaging, Ophthalmology, Dentistry, Urology, Otology, Orthopedics, Other Medical Imaging Applications, Medical Education, and Biomedical Research.

By Region:

Regional analysis includes North America, Europe, Asia Pacific, Latin America, and Middle East & Africa.

Table of Content

  1. Executive Summary
    • Global Market Outlook
    • Demand-side Trends
    • Supply-side Trends
    • Technology Roadmap Analysis
    • Analysis and Recommendations
  2. Market Overview
    • Market Coverage / Taxonomy
    • Market Definition / Scope / Limitations
  3. Market Background
    • Market Dynamics
      • Drivers
      • Restraints
      • Opportunity
      • Trends
    • Scenario Forecast
      • Demand in Optimistic Scenario
      • Demand in Likely Scenario
      • Demand in Conservative Scenario
    • Opportunity Map Analysis
    • Product Life Cycle Analysis
    • Supply Chain Analysis
      • Supply Side Participants and their Roles
        • Producers
        • Mid-Level Participants (Traders/ Agents/ Brokers)
        • Wholesalers and Distributors
      • Value Added and Value Created at Node in the Supply Chain
      • List of Raw Material Suppliers
      • List of Existing and Potential Buyer’s
    • Investment Feasibility Matrix
    • Value Chain Analysis
      • Profit Margin Analysis
      • Wholesalers and Distributors
      • Retailers
    • PESTLE and Porter’s Analysis
    • Regulatory Landscape
      • By Key Regions
      • By Key Countries
    • Regional Parent Market Outlook
    • Production and Consumption Statistics
    • Import and Export Statistics
  4. Global Market Analysis 2020 to 2024 and Forecast, 2025 to 2035
    • Historical Market Size Value (USD Billion) & Volume (Thousand Installations) Analysis, 2020 to 2024
    • Current and Future Market Size Value (USD Billion) & Volume (Thousand Installations) Projections, 2025 to 2035
      • Y-o-Y Growth Trend Analysis
      • Absolute $ Opportunity Analysis
  5. Global Market Pricing Analysis 2020 to 2024 and Forecast 2025 to 2035
  6. Global Market Analysis 2020 to 2024 and Forecast 2025 to 2035, By Product
    • Introduction / Key Findings
    • Historical Market Size Value (USD Billion) & Volume (Thousand Installations) Analysis By Product, 2020 to 2024
    • Current and Future Market Size Value (USD Billion) & Volume (Thousand Installations) Analysis and Forecast By Product, 2025 to 2035
      • Holographic Displays
      • Holography Microscopes
      • Holographic Prints
      • Holography Software
      • Holoscopes
    • Y-o-Y Growth Trend Analysis By Product, 2020 to 2024
    • Absolute $ Opportunity Analysis By Product, 2025 to 2035
  7. Global Market Analysis 2020 to 2024 and Forecast 2025 to 2035, By Imaging Modality
    • Introduction / Key Findings
    • Historical Market Size Value (USD Billion) & Volume (Thousand Installations) Analysis By Imaging Modality, 2020 to 2024
    • Current and Future Market Size Value (USD Billion) & Volume (Thousand Installations) Analysis and Forecast By Imaging Modality, 2025 to 2035
      • Computed Tomography (CT)
      • Magnetic Resonance Imaging (MRI)
      • Ultrasound
      • X-ray
      • Others
    • Y-o-Y Growth Trend Analysis By Imaging Modality, 2020 to 2024
    • Absolute $ Opportunity Analysis By Imaging Modality, 2025 to 2035
  8. Global Market Analysis 2020 to 2024 and Forecast 2025 to 2035, By Application
    • Introduction / Key Findings
    • Historical Market Size Value (USD Billion) & Volume (Thousand Installations) Analysis By Application, 2020 to 2024
    • Current and Future Market Size Value (USD Billion) & Volume (Thousand Installations) Analysis and Forecast By Application, 2025 to 2035
      • Medical Imaging
        • Ophthalmology
        • Dentistry
        • Urology
        • Otology
        • Orthopedics
        • Other Medical Imaging Applications
      • Medical Education
      • Biomedical Research
    • Y-o-Y Growth Trend Analysis By Application, 2020 to 2024
    • Absolute $ Opportunity Analysis By Application, 2025 to 2035
  9. Global Market Analysis 2020 to 2024 and Forecast 2025 to 2035, By Region
    • Introduction
    • Historical Market Size Value (USD Billion) & Volume (Thousand Installations) Analysis By Region, 2020 to 2024
    • Current Market Size Value (USD Billion) & Volume (Thousand Installations) Analysis and Forecast By Region, 2025 to 2035
      • North America
      • Latin America
      • Western Europe
      • Eastern Europe
      • East Asia
      • South Asia & Pacific
      • Middle East and Africa
    • Market Attractiveness Analysis By Region
  10. North America Market Analysis 2020 to 2024 and Forecast 2025 to 2035, By Country
    • Historical Market Size Value (USD Billion) & Volume (Thousand Installations) Trend Analysis By Market Taxonomy, 2020 to 2024
    • Market Size Value (USD Billion) & Volume (Thousand Installations) Forecast By Market Taxonomy, 2025 to 2035
      • By Country
        • USA
        • Canada
        • Mexico
      • By Product
      • By Imaging Modality
      • By Application
    • Market Attractiveness Analysis
      • By Country
      • By Product
      • By Imaging Modality
      • By Application
    • Key Takeaways
  11. Latin America Market Analysis 2020 to 2024 and Forecast 2025 to 2035, By Country
    • Historical Market Size Value (USD Billion) & Volume (Thousand Installations) Trend Analysis By Market Taxonomy, 2020 to 2024
    • Market Size Value (USD Billion) & Volume (Thousand Installations) Forecast By Market Taxonomy, 2025 to 2035
      • By Country
        • Brazil
        • Argentina
        • Rest of LATAM
      • By Product
      • By Imaging Modality
      • By Application
    • Market Attractiveness Analysis
      • By Country
      • By Product
      • By Imaging Modality
      • By Application
    • Key Takeaways
  12. Western Europe Market Analysis 2020 to 2024 and Forecast 2025 to 2035, By Country
    • Historical Market Size Value (USD Billion) & Volume (Thousand Installations) Trend Analysis By Market Taxonomy, 2020 to 2024
    • Market Size Value (USD Billion) & Volume (Thousand Installations) Forecast By Market Taxonomy, 2025 to 2035
      • By Country
        • Germany
        • Italy
        • France
        • UK
        • Spain
        • BENELUX
        • Nordic
        • Rest of W.Europe
      • By Product
      • By Imaging Modality
      • By Application
    • Market Attractiveness Analysis
      • By Country
      • By Product
      • By Imaging Modality
      • By Application
    • Key Takeaways
  13. Eastern Europe Market Analysis 2020 to 2024 and Forecast 2025 to 2035, By Country
    • Historical Market Size Value (USD Billion) & Volume (Thousand Installations) Trend Analysis By Market Taxonomy, 2020 to 2024
    • Market Size Value (USD Billion) & Volume (Thousand Installations) Forecast By Market Taxonomy, 2025 to 2035
      • By Country
        • Russia
        • Hungary
        • Poland
        • Balkan & Baltics
        • Rest of E. Europe
      • By Product
      • By Imaging Modality
      • By Application
    • Market Attractiveness Analysis
      • By Country
      • By Product
      • By Imaging Modality
      • By Application
    • Key Takeaways
  14. East Asia Market Analysis 2020 to 2024 and Forecast 2025 to 2035, By Country
    • Historical Market Size Value (USD Billion) & Volume (Thousand Installations) Trend Analysis By Market Taxonomy, 2020 to 2024
    • Market Size Value (USD Billion) & Volume (Thousand Installations) Forecast By Market Taxonomy, 2025 to 2035
      • By Country
        • China
        • Japan
        • South Korea
      • By Product
      • By Imaging Modality
      • By Application
    • Market Attractiveness Analysis
      • By Country
      • By Product
      • By Imaging Modality
      • By Application
    • Key Takeaways
  15. South Asia & Pacific Market Analysis 2020 to 2024 and Forecast 2025 to 2035, By Country
    • Historical Market Size Value (USD Billion) & Volume (Thousand Installations) Trend Analysis By Market Taxonomy, 2020 to 2024
    • Market Size Value (USD Billion) & Volume (Thousand Installations) Forecast By Market Taxonomy, 2025 to 2035
      • By Country
        • India
        • Australia & New Zealand
        • ASEAN
        • Rest of SAP
      • By Product
      • By Imaging Modality
      • By Application
    • Market Attractiveness Analysis
      • By Country
      • By Product
      • By Imaging Modality
      • By Application
    • Key Takeaways
  16. Middle East and Africa Market Analysis 2020 to 2024 and Forecast 2025 to 2035, By Country
    • Historical Market Size Value (USD Billion) & Volume (Thousand Installations) Trend Analysis By Market Taxonomy, 2020 to 2024
    • Market Size Value (USD Billion) & Volume (Thousand Installations) Forecast By Market Taxonomy, 2025 to 2035
      • By Country
        • GCC Countries
        • Northern Africa
        • South Africa
        • Turkiye
        • Rest of MEA
      • By Product
      • By Imaging Modality
      • By Application
    • Market Attractiveness Analysis
      • By Country
      • By Product
      • By Imaging Modality
      • By Application
    • Key Takeaways
  17. Key Countries Market Analysis
    • USA
      • Pricing Analysis
      • Market Share Analysis, 2024
        • By Product
        • By Imaging Modality
        • By Application
    • Canada
      • Pricing Analysis
      • Market Share Analysis, 2024
        • By Product
        • By Imaging Modality
        • By Application
    • Brazil
      • Pricing Analysis
      • Market Share Analysis, 2024
        • By Product
        • By Imaging Modality
        • By Application
    • Mexico
      • Pricing Analysis
      • Market Share Analysis, 2024
        • By Product
        • By Imaging Modality
        • By Application
    • Argentina
      • Pricing Analysis
      • Market Share Analysis, 2024
        • By Product
        • By Imaging Modality
        • By Application
  18. Market Structure Analysis
    • Competition Dashboard
    • Competition Benchmarking
    • Market Share Analysis of Top Players
      • By Regional
      • By Product
      • By Imaging Modality
      • By Application
  19. Competition Analysis
    • Competition Deep Dive
      • RealView Imaging Ltd.
        • Overview
        • Product Portfolio
        • Profitability by Market Segments (Product/Age /Sales Channel/Region)
        • Sales Footprint
        • Strategy Overview
          • Marketing Strategy
          • Product Strategy
          • Channel Strategy
      • Holoxica Ltd.
        • Overview
        • Product Portfolio
        • Profitability by Market Segments (Product/Age /Sales Channel/Region)
        • Sales Footprint
        • Strategy Overview
          • Marketing Strategy
          • Product Strategy
          • Channel Strategy
      • Eon Reality, Inc.
        • Overview
        • Product Portfolio
        • Profitability by Market Segments (Product/Age /Sales Channel/Region)
        • Sales Footprint
        • Strategy Overview
          • Marketing Strategy
          • Product Strategy
          • Channel Strategy
      • EchoPixel Inc.
        • Overview
        • Product Portfolio
        • Profitability by Market Segments (Product/Age /Sales Channel/Region)
        • Sales Footprint
        • Strategy Overview
          • Marketing Strategy
          • Product Strategy
          • Channel Strategy
      • zSpace, Inc.
        • Overview
        • Product Portfolio
        • Profitability by Market Segments (Product/Age /Sales Channel/Region)
        • Sales Footprint
        • Strategy Overview
          • Marketing Strategy
          • Product Strategy
          • Channel Strategy
      • Holografika Kft.
        • Overview
        • Product Portfolio
        • Profitability by Market Segments (Product/Age /Sales Channel/Region)
        • Sales Footprint
        • Strategy Overview
          • Marketing Strategy
          • Product Strategy
          • Channel Strategy
      • Nanolive SA
        • Overview
        • Product Portfolio
        • Profitability by Market Segments (Product/Age /Sales Channel/Region)
        • Sales Footprint
        • Strategy Overview
          • Marketing Strategy
          • Product Strategy
          • Channel Strategy
      • Looking Glass Factory, Inc.
        • Overview
        • Product Portfolio
        • Profitability by Market Segments (Product/Age /Sales Channel/Region)
        • Sales Footprint
        • Strategy Overview
          • Marketing Strategy
          • Product Strategy
          • Channel Strategy
      • Leia Inc.
        • Overview
        • Product Portfolio
        • Profitability by Market Segments (Product/Age /Sales Channel/Region)
        • Sales Footprint
        • Strategy Overview
          • Marketing Strategy
          • Product Strategy
          • Channel Strategy
      • Mach7 Technologies Ltd.
        • Overview
        • Product Portfolio
        • Profitability by Market Segments (Product/Age /Sales Channel/Region)
        • Sales Footprint
        • Strategy Overview
          • Marketing Strategy
          • Product Strategy
          • Channel Strategy
  20. Assumptions & Acronyms Used
  21. Research Methodology

List of Tables

  • Table 1: Global Market Value (USD Billion) Forecast by Region, 2020-2035
  • Table 2: Global Market Volume (Thousand Installations) Forecast by Region, 2020-2035
  • Table 3: Global Market Value (USD Billion) Forecast by Product, 2020-2035
  • Table 4: Global Market Volume (Thousand Installations) Forecast by Product, 2020-2035
  • Table 5: Global Market Value (USD Billion) Forecast by Imaging Modality, 2020-2035
  • Table 6: Global Market Volume (Thousand Installations) Forecast by Imaging Modality, 2020-2035
  • Table 7: Global Market Value (USD Billion) Forecast by Application, 2020-2035
  • Table 8: Global Market Volume (Thousand Installations) Forecast by Application, 2020-2035
  • Table 9: North America Market Value (USD Billion) Forecast by Country, 2020-2035
  • Table 10: North America Market Volume (Thousand Installations) Forecast by Country, 2020-2035
  • Table 11: North America Market Value (USD Billion) Forecast by Product, 2020-2035
  • Table 12: North America Market Volume (Thousand Installations) Forecast by Product, 2020-2035
  • Table 13: North America Market Value (USD Billion) Forecast by Imaging Modality, 2020-2035
  • Table 14: North America Market Volume (Thousand Installations) Forecast by Imaging Modality, 2020-2035
  • Table 15: North America Market Value (USD Billion) Forecast by Application, 2020-2035
  • Table 16: North America Market Volume (Thousand Installations) Forecast by Application, 2020-2035
  • Table 17: Latin America Market Value (USD Billion) Forecast by Country, 2020-2035
  • Table 18: Latin America Market Volume (Thousand Installations) Forecast by Country, 2020-2035
  • Table 19: Latin America Market Value (USD Billion) Forecast by Product, 2020-2035
  • Table 20: Latin America Market Volume (Thousand Installations) Forecast by Product, 2020-2035
  • Table 21: Latin America Market Value (USD Billion) Forecast by Imaging Modality, 2020-2035
  • Table 22: Latin America Market Volume (Thousand Installations) Forecast by Imaging Modality, 2020-2035
  • Table 23: Latin America Market Value (USD Billion) Forecast by Application, 2020-2035
  • Table 24: Latin America Market Volume (Thousand Installations) Forecast by Application, 2020-2035
  • Table 25: Western Europe Market Value (USD Billion) Forecast by Country, 2020-2035
  • Table 26: Western Europe Market Volume (Thousand Installations) Forecast by Country, 2020-2035
  • Table 27: Western Europe Market Value (USD Billion) Forecast by Product, 2020-2035
  • Table 28: Western Europe Market Volume (Thousand Installations) Forecast by Product, 2020-2035
  • Table 29: Western Europe Market Value (USD Billion) Forecast by Imaging Modality, 2020-2035
  • Table 30: Western Europe Market Volume (Thousand Installations) Forecast by Imaging Modality, 2020-2035
  • Table 31: Western Europe Market Value (USD Billion) Forecast by Application, 2020-2035
  • Table 32: Western Europe Market Volume (Thousand Installations) Forecast by Application, 2020-2035
  • Table 33: Eastern Europe Market Value (USD Billion) Forecast by Country, 2020-2035
  • Table 34: Eastern Europe Market Volume (Thousand Installations) Forecast by Country, 2020-2035
  • Table 35: Eastern Europe Market Value (USD Billion) Forecast by Product, 2020-2035
  • Table 36: Eastern Europe Market Volume (Thousand Installations) Forecast by Product, 2020-2035
  • Table 37: Eastern Europe Market Value (USD Billion) Forecast by Imaging Modality, 2020-2035
  • Table 38: Eastern Europe Market Volume (Thousand Installations) Forecast by Imaging Modality, 2020-2035
  • Table 39: Eastern Europe Market Value (USD Billion) Forecast by Application, 2020-2035
  • Table 40: Eastern Europe Market Volume (Thousand Installations) Forecast by Application, 2020-2035
  • Table 41: East Asia Market Value (USD Billion) Forecast by Country, 2020-2035
  • Table 42: East Asia Market Volume (Thousand Installations) Forecast by Country, 2020-2035
  • Table 43: East Asia Market Value (USD Billion) Forecast by Product, 2020-2035
  • Table 44: East Asia Market Volume (Thousand Installations) Forecast by Product, 2020-2035
  • Table 45: East Asia Market Value (USD Billion) Forecast by Imaging Modality, 2020-2035
  • Table 46: East Asia Market Volume (Thousand Installations) Forecast by Imaging Modality, 2020-2035
  • Table 47: East Asia Market Value (USD Billion) Forecast by Application, 2020-2035
  • Table 48: East Asia Market Volume (Thousand Installations) Forecast by Application, 2020-2035
  • Table 49: South Asia & Pacific Market Value (USD Billion) Forecast by Country, 2020-2035
  • Table 50: South Asia & Pacific Market Volume (Thousand Installations) Forecast by Country, 2020-2035
  • Table 51: South Asia & Pacific Market Value (USD Billion) Forecast by Product, 2020-2035
  • Table 52: South Asia & Pacific Market Volume (Thousand Installations) Forecast by Product, 2020-2035
  • Table 53: South Asia & Pacific Market Value (USD Billion) Forecast by Imaging Modality, 2020-2035
  • Table 54: South Asia & Pacific Market Volume (Thousand Installations) Forecast by Imaging Modality, 2020-2035
  • Table 55: South Asia & Pacific Market Value (USD Billion) Forecast by Application, 2020-2035
  • Table 56: South Asia & Pacific Market Volume (Thousand Installations) Forecast by Application, 2020-2035
  • Table 57: Middle East and Africa Market Value (USD Billion) Forecast by Country, 2020-2035
  • Table 58: Middle East and Africa Market Volume (Thousand Installations) Forecast by Country, 2020-2035
  • Table 59: Middle East and Africa Market Value (USD Billion) Forecast by Product, 2020-2035
  • Table 60: Middle East and Africa Market Volume (Thousand Installations) Forecast by Product, 2020-2035
  • Table 61: Middle East and Africa Market Value (USD Billion) Forecast by Imaging Modality, 2020-2035
  • Table 62: Middle East and Africa Market Volume (Thousand Installations) Forecast by Imaging Modality, 2020-2035
  • Table 63: Middle East and Africa Market Value (USD Billion) Forecast by Application, 2020-2035
  • Table 64: Middle East and Africa Market Volume (Thousand Installations) Forecast by Application, 2020-2035

List of Figures

  • Figure 1: Global Market Volume (Thousand Installations) Forecast 2020-2035
  • Figure 2: Global Market Pricing Analysis
  • Figure 3: Global Market Value (USD Billion) Forecast 2020-2035
  • Figure 4: Global Market Value Share and BPS Analysis by Product, 2025 and 2035
  • Figure 5: Global Market Y-o-Y Growth Comparison by Product, 2025-2035
  • Figure 6: Global Market Attractiveness Analysis by Product
  • Figure 7: Global Market Value Share and BPS Analysis by Imaging Modality, 2025 and 2035
  • Figure 8: Global Market Y-o-Y Growth Comparison by Imaging Modality, 2025-2035
  • Figure 9: Global Market Attractiveness Analysis by Imaging Modality
  • Figure 10: Global Market Value Share and BPS Analysis by Application, 2025 and 2035
  • Figure 11: Global Market Y-o-Y Growth Comparison by Application, 2025-2035
  • Figure 12: Global Market Attractiveness Analysis by Application
  • Figure 13: Global Market Value (USD Billion) Share and BPS Analysis by Region, 2025 and 2035
  • Figure 14: Global Market Y-o-Y Growth Comparison by Region, 2025-2035
  • Figure 15: Global Market Attractiveness Analysis by Region
  • Figure 16: North America Market Incremental $ Opportunity, 2025-2035
  • Figure 17: Latin America Market Incremental $ Opportunity, 2025-2035
  • Figure 18: Western Europe Market Incremental $ Opportunity, 2025-2035
  • Figure 19: Eastern Europe Market Incremental $ Opportunity, 2025-2035
  • Figure 20: East Asia Market Incremental $ Opportunity, 2025-2035
  • Figure 21: South Asia & Pacific Market Incremental $ Opportunity, 2025-2035
  • Figure 22: Middle East and Africa Market Incremental $ Opportunity, 2025-2035
  • Figure 23: North America Market Value Share and BPS Analysis by Country, 2025 and 2035
  • Figure 24: North America Market Value Share and BPS Analysis by Product, 2025 and 2035
  • Figure 25: North America Market Y-o-Y Growth Comparison by Product, 2025-2035
  • Figure 26: North America Market Attractiveness Analysis by Product
  • Figure 27: North America Market Value Share and BPS Analysis by Imaging Modality, 2025 and 2035
  • Figure 28: North America Market Y-o-Y Growth Comparison by Imaging Modality, 2025-2035
  • Figure 29: North America Market Attractiveness Analysis by Imaging Modality
  • Figure 30: North America Market Value Share and BPS Analysis by Application, 2025 and 2035
  • Figure 31: North America Market Y-o-Y Growth Comparison by Application, 2025-2035
  • Figure 32: North America Market Attractiveness Analysis by Application
  • Figure 33: Latin America Market Value Share and BPS Analysis by Country, 2025 and 2035
  • Figure 34: Latin America Market Value Share and BPS Analysis by Product, 2025 and 2035
  • Figure 35: Latin America Market Y-o-Y Growth Comparison by Product, 2025-2035
  • Figure 36: Latin America Market Attractiveness Analysis by Product
  • Figure 37: Latin America Market Value Share and BPS Analysis by Imaging Modality, 2025 and 2035
  • Figure 38: Latin America Market Y-o-Y Growth Comparison by Imaging Modality, 2025-2035
  • Figure 39: Latin America Market Attractiveness Analysis by Imaging Modality
  • Figure 40: Latin America Market Value Share and BPS Analysis by Application, 2025 and 2035
  • Figure 41: Latin America Market Y-o-Y Growth Comparison by Application, 2025-2035
  • Figure 42: Latin America Market Attractiveness Analysis by Application
  • Figure 43: Western Europe Market Value Share and BPS Analysis by Country, 2025 and 2035
  • Figure 44: Western Europe Market Value Share and BPS Analysis by Product, 2025 and 2035
  • Figure 45: Western Europe Market Y-o-Y Growth Comparison by Product, 2025-2035
  • Figure 46: Western Europe Market Attractiveness Analysis by Product
  • Figure 47: Western Europe Market Value Share and BPS Analysis by Imaging Modality, 2025 and 2035
  • Figure 48: Western Europe Market Y-o-Y Growth Comparison by Imaging Modality, 2025-2035
  • Figure 49: Western Europe Market Attractiveness Analysis by Imaging Modality
  • Figure 50: Western Europe Market Value Share and BPS Analysis by Application, 2025 and 2035
  • Figure 51: Western Europe Market Y-o-Y Growth Comparison by Application, 2025-2035
  • Figure 52: Western Europe Market Attractiveness Analysis by Application
  • Figure 53: Eastern Europe Market Value Share and BPS Analysis by Country, 2025 and 2035
  • Figure 54: Eastern Europe Market Value Share and BPS Analysis by Product, 2025 and 2035
  • Figure 55: Eastern Europe Market Y-o-Y Growth Comparison by Product, 2025-2035
  • Figure 56: Eastern Europe Market Attractiveness Analysis by Product
  • Figure 57: Eastern Europe Market Value Share and BPS Analysis by Imaging Modality, 2025 and 2035
  • Figure 58: Eastern Europe Market Y-o-Y Growth Comparison by Imaging Modality, 2025-2035
  • Figure 59: Eastern Europe Market Attractiveness Analysis by Imaging Modality
  • Figure 60: Eastern Europe Market Value Share and BPS Analysis by Application, 2025 and 2035
  • Figure 61: Eastern Europe Market Y-o-Y Growth Comparison by Application, 2025-2035
  • Figure 62: Eastern Europe Market Attractiveness Analysis by Application
  • Figure 63: East Asia Market Value Share and BPS Analysis by Country, 2025 and 2035
  • Figure 64: East Asia Market Value Share and BPS Analysis by Product, 2025 and 2035
  • Figure 65: East Asia Market Y-o-Y Growth Comparison by Product, 2025-2035
  • Figure 66: East Asia Market Attractiveness Analysis by Product
  • Figure 67: East Asia Market Value Share and BPS Analysis by Imaging Modality, 2025 and 2035
  • Figure 68: East Asia Market Y-o-Y Growth Comparison by Imaging Modality, 2025-2035
  • Figure 69: East Asia Market Attractiveness Analysis by Imaging Modality
  • Figure 70: East Asia Market Value Share and BPS Analysis by Application, 2025 and 2035
  • Figure 71: East Asia Market Y-o-Y Growth Comparison by Application, 2025-2035
  • Figure 72: East Asia Market Attractiveness Analysis by Application
  • Figure 73: South Asia & Pacific Market Value Share and BPS Analysis by Country, 2025 and 2035
  • Figure 74: South Asia & Pacific Market Value Share and BPS Analysis by Product, 2025 and 2035
  • Figure 75: South Asia & Pacific Market Y-o-Y Growth Comparison by Product, 2025-2035
  • Figure 76: South Asia & Pacific Market Attractiveness Analysis by Product
  • Figure 77: South Asia & Pacific Market Value Share and BPS Analysis by Imaging Modality, 2025 and 2035
  • Figure 78: South Asia & Pacific Market Y-o-Y Growth Comparison by Imaging Modality, 2025-2035
  • Figure 79: South Asia & Pacific Market Attractiveness Analysis by Imaging Modality
  • Figure 80: South Asia & Pacific Market Value Share and BPS Analysis by Application, 2025 and 2035
  • Figure 81: South Asia & Pacific Market Y-o-Y Growth Comparison by Application, 2025-2035
  • Figure 82: South Asia & Pacific Market Attractiveness Analysis by Application
  • Figure 83: Middle East and Africa Market Value Share and BPS Analysis by Country, 2025 and 2035
  • Figure 84: Middle East and Africa Market Value Share and BPS Analysis by Product, 2025 and 2035
  • Figure 85: Middle East and Africa Market Y-o-Y Growth Comparison by Product, 2025-2035
  • Figure 86: Middle East and Africa Market Attractiveness Analysis by Product
  • Figure 87: Middle East and Africa Market Value Share and BPS Analysis by Imaging Modality, 2025 and 2035
  • Figure 88: Middle East and Africa Market Y-o-Y Growth Comparison by Imaging Modality, 2025-2035
  • Figure 89: Middle East and Africa Market Attractiveness Analysis by Imaging Modality
  • Figure 90: Middle East and Africa Market Value Share and BPS Analysis by Application, 2025 and 2035
  • Figure 91: Middle East and Africa Market Y-o-Y Growth Comparison by Application, 2025-2035
  • Figure 92: Middle East and Africa Market Attractiveness Analysis by Application
  • Figure 93: Global Market - Tier Structure Analysis
  • Figure 94: Global Market - Company Share Analysis

Frequently Asked Questions

What is the projected industry value of the holography in medical imaging market in 2025?

The industry is projected to reach USD 3.7 billion in 2025.

What is the expected global CAGR for the holography in medical imaging market from 2025 to 2035?

The industry is expected to grow at a CAGR of 29.5% from 2025 to 2035.

Which segment is expected to dominate the holography in medical imaging market in 2025?

Medical imaging is expected to capture 43% of the market share in 2025.

Which country is forecasted to register the highest growth in the holography in medical imaging market?

India is projected to lead with a CAGR of 36.9% from 2025 to 2035.

What is the forecasted industry value of the holography in medical imaging market by 2035?

The industry is projected to reach USD 49.1 billion by 2035.

Explore Similar Insights

Future Market Insights

Holography in Medical Imaging Market