The IBC liner market is valued at USD 2.8 billion in 2025 and is projected to reach USD 5.4 billion by 2035, expanding at a 6.8% CAGR as industries increase their reliance on contamination-free bulk liquid handling and container-reuse systems. Growth is driven by rising chemical production, stricter purity requirements in food-grade liquid handling, and expanding pharmaceutical ingredient distribution. Polyethylene (PE) liners, holding 59% share, remain the dominant material category due to versatility, chemical resistance, and cost-efficient processing, while multi-layer EVOH and PP liners gain traction in applications requiring enhanced barrier protection. Chemical applications, at 47% of total demand, lead usage due to high cross-contamination risks and the need for solvent-resistant protective formats.
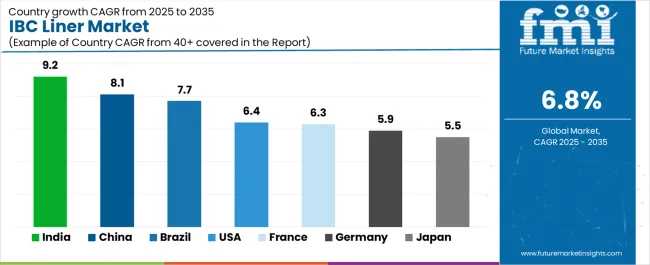
Regionally, expansion is led by India (9.2% CAGR) and China (8.1%), supported by growing pharmaceutical and chemical manufacturing capacities, while Brazil (7.7%), USA (6.4%), France (6.3%), Germany (5.9%), and Japan (5.5%) show steady, compliance-driven adoption backed by rising automation requirements and container-reuse programs. Competitive intensity remains moderate, with CDF Corporation, Nittel GmbH, Büscherhoff Packaging Solutions, LC Packaging, Berry Global, and Greif Inc. strengthening their positions through multi-layer film engineering, aseptic liner technologies, automated installation systems, and barrier-film customization for chemical, food-grade, and pharmaceutical environments.
A central dynamic driving market expansion is the rising use of bulk liquid transport in the chemical and specialty materials industries. Companies increasingly rely on IBC liners to handle inks, coatings, adhesives, lubricants, solvents, and high-value chemicals that require contamination-free containment. Liners help maintain material integrity and reduce cleaning downtime, enabling higher turnaround efficiency for tank fleets. Their ability to prevent chemical interactions with the container walls improves safety and reduces risk of cross-contamination, critical in regulated industrial environments.
Technological advancements are reshaping competitive dynamics. Manufacturers are developing high-barrier liners with enhanced puncture resistance, multi-layer film structures, improved oxygen and moisture barriers, and anti-static properties for sensitive or hazardous materials. Form-fit liners, bottom-discharge liners, pillow-style liners, and high-temperature–compatible variants are gaining traction as industries demand application-specific flexibility. Integration with dispensing valves, caps, and fitments enhances controlled flow and reduces product waste during unloading.
Operational efficiency is another major driver. IBC liners minimize cleaning time, reduce reliance on water and detergents, and eliminate the risk of tank contamination from prior loads. These advantages significantly lower operating costs for companies managing large fleets of IBC totes. The trend toward reusable and returnable rigid IBCs paired with single-use liners supports both cost management and logistical flexibility.
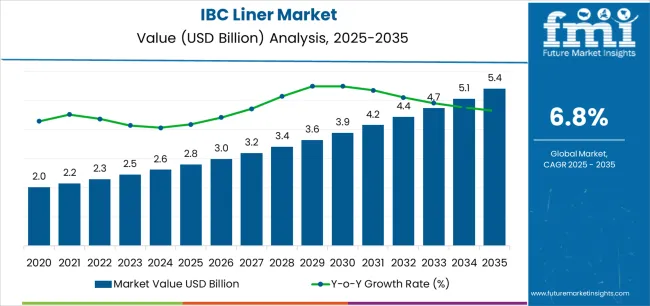
| Metric | Value |
|---|---|
| Estimated Value in (2025E) | USD 2.8 billion |
| Forecast Value in (2035F) | USD 5.4 billion |
| Forecast CAGR (2025 to 2035) | 6.8% |
Market expansion is being supported by the increasing global demand for contamination-free bulk liquid transportation solutions and the corresponding need for protective liner systems that can provide superior product isolation and barrier protection while enabling efficient container reuse and contamination prevention across various chemical, pharmaceutical, and food-grade distribution applications. Modern chemical processors and food ingredient distributors are increasingly focused on implementing liner solutions that can protect sensitive liquids, prevent cross-contamination between different products, and provide consistent barrier performance throughout complex multi-product container utilization cycles.
IBC liner packaging's proven ability to deliver exceptional contamination prevention against residual product contact, enable efficient container cleaning operations, and support cost-effective logistics make them essential packaging formats for contemporary chemical distribution and food-grade liquid operations.
The growing emphasis on product purity and operational efficiency is driving demand for IBC liners that can support high-volume filling requirements, improve product integrity maintenance, and enable rapid container turnaround formats. Manufacturers' preference for packaging that combines effective barrier protection with processing efficiency and material economy is creating opportunities for innovative IBC liner implementations. The rising influence of pharmaceutical cold chain logistics and specialty chemical distribution is also contributing to increased demand for IBC liners that can provide oxygen barrier protection, moisture resistance, and reliable performance across temperature-controlled transit conditions.
The IBC liner market is poised for rapid growth and transformation. As industries across chemicals, food ingredients, pharmaceuticals, lubricants, and industrial liquids seek packaging that delivers exceptional contamination prevention, barrier performance, and operational convenience, IBC liners are gaining prominence not just as commodity packaging but as strategic enablers of product purity and supply chain efficiency.
Rising pharmaceutical manufacturing in Asia-Pacific and expanding food-grade liquid markets globally amplify demand, while manufacturers are leveraging innovations in multi-layer barrier films, aseptic liner technologies, and quick-deployment fitment systems.
Pathways like pharmaceutical-grade aseptic formulations, automated filling integration, and application-specific customization promise strong margin uplift, especially in high-value segments. Geographic expansion and vertical integration will capture volume, particularly where regulatory compliance capabilities and technical support proximity are critical. Regulatory pressures around food safety standards, pharmaceutical purity requirements, chemical handling protocols, and cross-contamination prevention give structural support.
The market is segmented by material type, capacity, application, end-use industry, thickness, and region. By material type, the market is divided into polyethylene (PE), polypropylene (PP), ethylene vinyl alcohol (EVOH), and others. By capacity, it covers small capacity (up to 500 liters), medium capacity (500-1000 liters), and large capacity (above 1000 liters). By application, the market is segmented into chemicals, food & beverages, pharmaceuticals, lubricants & oils, and others. The thickness includes standard (100-200 microns), heavy-duty (200-300 microns), and extra heavy-duty (above 300 microns). By end-use industry, it is categorized into chemical manufacturing, food processing, pharmaceutical production, agriculture, and others. Regionally, the market is divided into North America, Europe, East Asia, South Asia & Pacific, Latin America, and the Middle East & Africa.
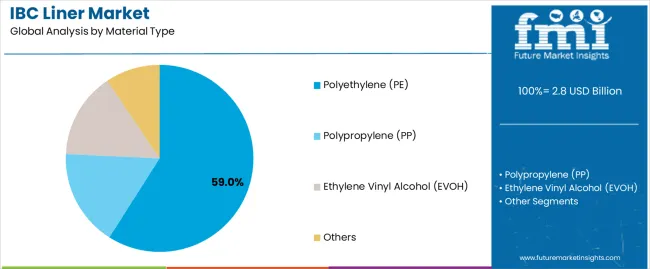
The polyethylene segment is projected to account for 59% of the IBC liner market in 2025, reaffirming its position as the leading material category. Chemical processors and food ingredient distributors increasingly utilize polyethylene IBC liners for their superior chemical resistance properties when processed through blown film extrusion technologies, excellent flexibility characteristics, and cost-effectiveness in applications ranging from industrial chemical containment to food-grade liquid packaging. Polyethylene IBC liner technology's advanced barrier film capabilities and consistent material compatibility directly address the industrial requirements for reliable contamination prevention in high-volume liquid handling environments.
This material segment forms the foundation of modern chemical distribution operations, as it represents the IBC liner type with the greatest versatility and established market demand across multiple application categories and industry sectors. Manufacturer investments in enhanced barrier layer technologies and FDA-compliant formulation development continue to strengthen adoption among chemical processors and food manufacturers. With companies prioritizing product purity and container reuse optimization, polyethylene IBC liners align with both contamination prevention requirements and economic efficiency objectives, making them the central component of comprehensive liquid packaging strategies.
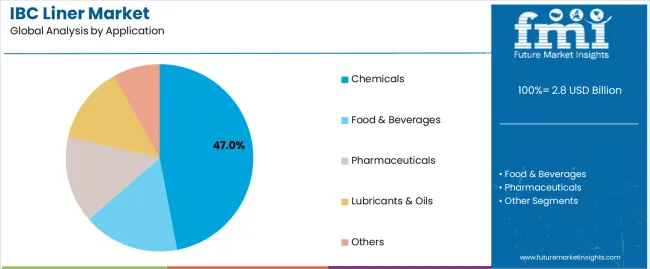
Chemicals applications are projected to represent 47% of IBC liner demand in 2025, underscoring their critical role as the primary industrial consumers of protective IBC liner packaging for specialty chemical transportation, industrial liquid handling, and hazardous material containment. Chemical manufacturing operators prefer IBC liners for their exceptional contamination prevention capabilities, chemical resistance characteristics, and ability to prevent cross-contamination while ensuring product purity with intact quality throughout storage and distribution. Positioned as essential packaging formats for modern chemical processing operations, IBC liners offer both protection advantages and operational efficiency benefits.
The segment is supported by continuous innovation in chemical-resistant formulation technologies and the growing availability of specialized barrier structures that enable solvent compatibility with enhanced puncture resistance and rapid deployment capabilities. Additionally, chemical manufacturers are investing in container reuse programs to support large-volume IBC liner utilization and logistics cost reduction. As specialty chemical production becomes more prevalent and regulatory compliance requirements increase, chemicals applications will continue to dominate the end-use market while supporting advanced barrier protection utilization and contamination prevention strategies.
The IBC liner market is advancing rapidly due to increasing demand for contamination-free liquid transportation and growing adoption of disposable liner solutions that provide superior product isolation and barrier protection while enabling efficient container reuse across diverse chemical, pharmaceutical, and food-grade distribution applications. However, the market faces challenges, including raw material price fluctuations, disposal concerns regarding single-use plastic products, and the need for specialized barrier technology investments. Innovation in biodegradable liner formulations and recycled content development continues to influence product development and market expansion patterns.
The growing adoption of aseptic liner formulations, gamma-radiation compatible materials, and validated sterilization systems is enabling manufacturers to produce pharmaceutical-grade IBC liners with superior sterility assurance, enhanced microbial barrier properties, and regulatory compliance functionalities. Advanced aseptic systems provide improved pharmaceutical ingredient protection while allowing more efficient cold chain distribution and consistent performance across various temperature conditions and storage durations. Manufacturers are increasingly recognizing the competitive advantages of pharmaceutical-grade liner capabilities for product differentiation and premium market positioning.
Modern IBC liner producers are incorporating automated liner installation systems, integrated discharge valves, and sensor-controlled filling mechanisms to enhance operational efficiency, enable labor cost reduction, and deliver value-added solutions to chemical and pharmaceutical customers. These technologies improve processing throughput while enabling new operational capabilities, including high-speed container filling, consistent product evacuation, and reduced contamination risk. Advanced automation integration also allows manufacturers to support large-scale production operations and facility modernization beyond traditional manual liner handling approaches.
| Country | CAGR (2025-2035) |
|---|---|
| India | 9.2% |
| China | 8.1% |
| USA | 6.4% |
| Brazil | 7.7% |
| Germany | 5.9% |
| Japan | 5.5% |
| France | 6.3% |
The IBC liner market is experiencing strong growth globally, with India leading at a 9.2% CAGR through 2035, driven by the expanding pharmaceutical manufacturing sector, growing chemical industry production, and significant investment in food processing infrastructure development. China follows at 8.1%, supported by rapid specialty chemical growth, increasing pharmaceutical ingredient manufacturing, and growing export packaging capabilities.
The USA shows growth at 6.4%, emphasizing pharmaceutical cold chain innovation and chemical processing automation development. Brazil records 7.7%, focusing on agricultural chemical expansion and food ingredient processing growth. Germany demonstrates 5.9% growth, prioritizing chemical industry excellence and advanced pharmaceutical manufacturing capabilities. Japan exhibits 5.5% growth, emphasizing precision chemical production and quality pharmaceutical ingredient packaging. France shows 6.3% growth, supported by specialty chemical manufacturing demand and pharmaceutical logistics concentration.
The report covers an in-depth analysis of 40+ countries top-performing countries are highlighted below.
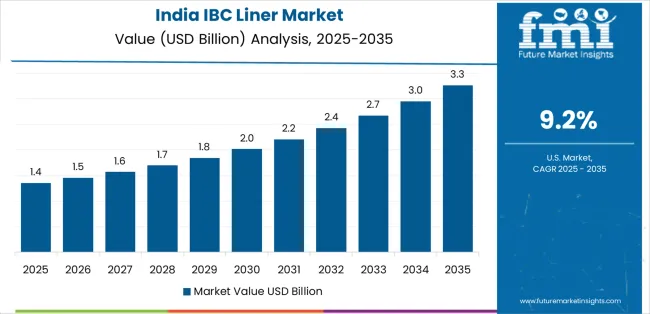
Revenue from IBC liners in India is projected to exhibit exceptional growth with a CAGR of 9.2% through 2035, driven by expanding pharmaceutical manufacturing capacity and rapidly growing chemical industry production supported by government initiatives promoting domestic manufacturing development. The country's strong position in active pharmaceutical ingredient (API) production and increasing investment in food processing infrastructure are creating substantial demand for hygienic IBC liner solutions. Major pharmaceutical manufacturers and chemical processors are establishing comprehensive IBC liner sourcing capabilities to serve both domestic production demand and export packaging markets.
Revenue from IBC liners in China is expanding at a CAGR of 8.1%, supported by the country's massive chemical manufacturing sector, expanding pharmaceutical ingredient production, and increasing adoption of automated liquid handling solutions. The country's government initiatives promoting manufacturing quality and growing specialty chemical capabilities are driving requirements for sophisticated contamination prevention packaging. International suppliers and domestic manufacturers are establishing extensive production and distribution capabilities to address the growing demand for IBC liner products.
Revenue from IBC liners in the USA is expanding at a CAGR of 6.4%, supported by the country's advanced pharmaceutical manufacturing capabilities, strong emphasis on food safety regulations, and robust demand for high-performance contamination prevention packaging in chemical and pharmaceutical distribution applications. The nation's mature pharmaceutical sector and compliance-focused operations are driving sophisticated aseptic IBC liner systems throughout the supply chain. Leading manufacturers and technology providers are investing extensively in sterilization-compatible materials and FDA-compliant formulations to serve both domestic and international markets.
Revenue from IBC liners in Brazil is growing at a CAGR of 7.7%, driven by the country's expanding agricultural chemical sector, growing food processing industry, and increasing investment in pharmaceutical manufacturing development. Brazil's large agricultural base and commitment to industrial expansion are supporting demand for protective IBC liner solutions across multiple liquid handling segments. Manufacturers are establishing comprehensive production capabilities to serve the growing domestic market and regional export opportunities.
Revenue from IBC liners in Germany is expanding at a CAGR of 5.9%, supported by the country's chemical industry leadership, advanced pharmaceutical manufacturing capabilities, and strategic focus on high-quality contamination prevention packaging. Germany's engineering excellence and chemical processing innovation are driving demand for IBC liners in specialty chemical production, pharmaceutical ingredient manufacturing, and industrial liquid handling applications. Manufacturers are investing in comprehensive quality assurance capabilities to serve both domestic chemical processors and international pharmaceutical markets.
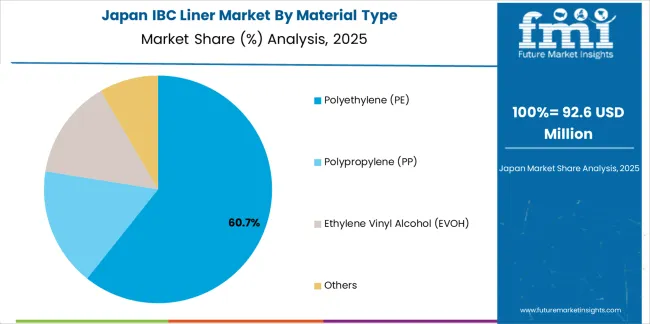
Revenue from IBC liners in Japan is growing at a CAGR of 5.5%, driven by the country's expertise in precision chemical manufacturing, emphasis on quality control, and strong position in pharmaceutical ingredient and specialty chemical production. Japan's established chemical processing capabilities and commitment to continuous improvement are supporting investment in advanced barrier technologies throughout major manufacturing centers. Industry leaders are establishing comprehensive contamination control systems to serve domestic pharmaceutical manufacturers and specialty chemical producers.
Revenue from IBC liners in France is expanding at a CAGR of 6.3%, supported by the country's specialty chemical manufacturing concentration, growing pharmaceutical sector, and strategic position in European chemical logistics networks. France's advanced chemical processing capabilities and integrated pharmaceutical infrastructure are driving demand for high-quality IBC liners in fine chemical production, pharmaceutical ingredient handling, and food-grade liquid applications. Leading manufacturers are investing in specialized capabilities to serve the stringent requirements of pharmaceutical and specialty chemical industries.
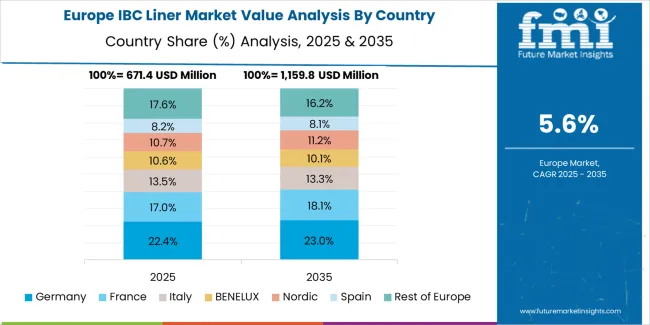
The IBC liner market in Europe is projected to grow from USD 760 million in 2025 to USD 1.5 billion by 2035, registering a CAGR of 7.0% over the forecast period. Germany is expected to maintain its leadership position with a 33% market share in 2025, declining slightly to 32.5% by 2035, supported by its strong chemical manufacturing industry, advanced pharmaceutical production capabilities, and comprehensive specialty chemical sector serving diverse IBC liner applications across Europe.
France follows with a 21% share in 2025, projected to reach 21.5% by 2035, driven by robust demand for IBC liners in specialty chemical production, pharmaceutical ingredient manufacturing, and food-grade liquid applications, combined with established chemical processing infrastructure and pharmaceutical manufacturing expertise. The United Kingdom holds a 17% share in 2025, expected to reach 17.5% by 2035, supported by strong pharmaceutical manufacturing sector and growing specialty chemical activities. Italy commands a 12% share in 2025, projected to reach 12.3% by 2035, while Spain accounts for 7.5% in 2025, expected to reach 8% by 2035.
The Netherlands maintains a 5% share in 2025, growing to 5.2% by 2035. The Rest of Europe region, including Nordic countries, Eastern Europe, Belgium, Poland, and other nations, is anticipated to maintain momentum, with its collective share moving from 4.5% to 3.0% by 2035, attributed to increasing pharmaceutical manufacturing in Eastern Europe and growing chemical processing operations in Nordic countries implementing advanced contamination prevention programs.
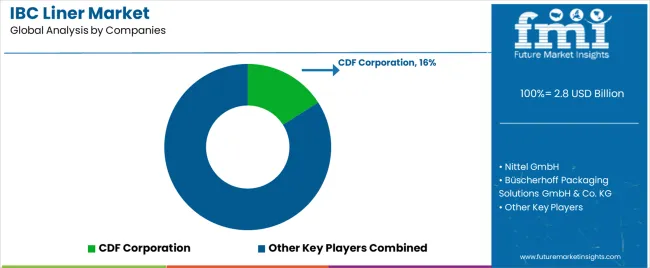
The IBC Liner Market is strengthening as global trade, chemical processing, food ingredients, and pharmaceutical logistics increasingly rely on safe, contamination-free bulk packaging solutions. IBC liners are widely adopted because they protect liquid and semi-liquid products from oxygen, moisture, and particulate exposure while ensuring full drainability and reduced cleaning requirements. As exporters shift toward hygienic, single-use and optimized multilayer barrier formats, demand for liners that meet stringent international transport and purity standards continues to rise.
CDF Corporation, Nittel GmbH, and Büscherhoff Packaging Solutions GmbH & Co. KG hold strong positions in the market with engineered liners designed for chemicals, food concentrates, syrups, and sensitive industrial fluids. Their focus on form-fit designs, multilayer barrier films, and high-performance dispensing systems ensures compatibility with a broad range of IBC types and filling environments.
LC Packaging International BV, Berry Global Inc., and Greif Inc. continue to expand their global presence by offering large-scale manufacturing capabilities and diversified liner solutions that integrate sustainability features such as recyclable materials and reduced-weight constructions. Their broad distribution networks allow rapid supply to high-volume end users across Europe, North America, and Asia.
Emerging and specialized suppliers including Composite Containers LLC, Qingdao LAF Packaging Co., Ltd., Shandong Fully Packing Materials Co., Ltd., and Trans Ocean Bulk Logistics Limited are increasingly influencing the competitive landscape by providing cost-efficient, export-grade liners tailored for agricultural products, edible oils, and bulk industrial intermediates. Their focus on customization, improved barrier technologies, and regional manufacturing presence is helping meet the rapidly growing demand from global bulk liquid transport sectors.
| Items | Values |
|---|---|
| Quantitative Units (2025) | USD 2.8 billion |
| Material Type | Polyethylene (PE), Polypropylene (PP), Ethylene Vinyl Alcohol (EVOH), Others |
| Capacity | Small Capacity (Up to 500 liters), Medium Capacity (500-1000 liters), Large Capacity (Above 1000 liters) |
| Application | Chemicals, Food & Beverages, Pharmaceuticals, Lubricants & Oils, Others |
| Thickness | Standard (100-200 microns), Heavy-Duty (200-300 microns), Extra Heavy-Duty (Above 300 microns) |
| End-Use Industry | Chemical Manufacturing, Food Processing, Pharmaceutical Production, Agriculture, Others |
| Regions Covered | North America, Europe, East Asia, South Asia & Pacific, Latin America, Middle East & Africa |
| Countries Covered | United States, Canada, United Kingdom, Germany, France, China, Japan, South Korea, India, Brazil, Australia and 40+ countries |
| Key Companies Profiled | CDF Corporation, Nittel GmbH, Büscherhoff Packaging Solutions GmbH & Co. KG, LC Packaging International BV, Berry Global Inc., Greif Inc., Composite Containers LLC, Qingdao LAF Packaging Co., Ltd., Shandong Fully Packing Materials Co., Ltd., Trans Ocean Bulk Logistics Limited |
| Additional Attributes | Dollar sales by material type and application category, regional demand trends, competitive landscape, technological advancements in barrier film systems, aseptic liner development, automated installation innovation, and supply chain integration |
The global IBC liner market is estimated to be valued at USD 2.8 billion in 2025.
The market size for the IBC liner market is projected to reach USD 5.4 billion by 2035.
The IBC liner market is expected to grow at a 6.8% CAGR between 2025 and 2035.
The key product types in IBC liner market are polyethylene (pe), polypropylene (pp), ethylene vinyl alcohol (evoh) and others.
In terms of application, chemicals segment to command 47.0% share in the IBC liner market in 2025.


Our Research Products

The "Full Research Suite" delivers actionable market intel, deep dives on markets or technologies, so clients act faster, cut risk, and unlock growth.

The Leaderboard benchmarks and ranks top vendors, classifying them as Established Leaders, Leading Challengers, or Disruptors & Challengers.

Locates where complements amplify value and substitutes erode it, forecasting net impact by horizon

We deliver granular, decision-grade intel: market sizing, 5-year forecasts, pricing, adoption, usage, revenue, and operational KPIs—plus competitor tracking, regulation, and value chains—across 60 countries broadly.

Spot the shifts before they hit your P&L. We track inflection points, adoption curves, pricing moves, and ecosystem plays to show where demand is heading, why it is changing, and what to do next across high-growth markets and disruptive tech

Real-time reads of user behavior. We track shifting priorities, perceptions of today’s and next-gen services, and provider experience, then pace how fast tech moves from trial to adoption, blending buyer, consumer, and channel inputs with social signals (#WhySwitch, #UX).

Partner with our analyst team to build a custom report designed around your business priorities. From analysing market trends to assessing competitors or crafting bespoke datasets, we tailor insights to your needs.
Supplier Intelligence
Discovery & Profiling
Capacity & Footprint
Performance & Risk
Compliance & Governance
Commercial Readiness
Who Supplies Whom
Scorecards & Shortlists
Playbooks & Docs
Category Intelligence
Definition & Scope
Demand & Use Cases
Cost Drivers
Market Structure
Supply Chain Map
Trade & Policy
Operating Norms
Deliverables
Buyer Intelligence
Account Basics
Spend & Scope
Procurement Model
Vendor Requirements
Terms & Policies
Entry Strategy
Pain Points & Triggers
Outputs
Pricing Analysis
Benchmarks
Trends
Should-Cost
Indexation
Landed Cost
Commercial Terms
Deliverables
Brand Analysis
Positioning & Value Prop
Share & Presence
Customer Evidence
Go-to-Market
Digital & Reputation
Compliance & Trust
KPIs & Gaps
Outputs
Full Research Suite comprises of:
Market outlook & trends analysis
Interviews & case studies
Strategic recommendations
Vendor profiles & capabilities analysis
5-year forecasts
8 regions and 60+ country-level data splits
Market segment data splits
12 months of continuous data updates
DELIVERED AS:
PDF EXCEL ONLINE
IBC Liner Market Share Insights & Industry Leaders
IBC Rental Business Market Size and Share Forecast Outlook 2025 to 2035
Linerless Label Market Size and Share Forecast Outlook 2025 to 2035
Linerless Closures Market Size and Share Forecast Outlook 2025 to 2035
Breakdown for IBC Rental Business Market: Trends, Players, and Innovations
Market Positioning & Share in Linerless Label Industry
Liner Bag Market Report – Key Trends & Forecast 2024-2034
Liner Hanger Market
IBC Caps Market
FIBC Market Size and Share Forecast Outlook 2025 to 2035
FIBC Industry Analysis in Japan Size and Share Forecast Outlook 2025 to 2035
Market Share Distribution Among FIBC (Flexible Intermediate Bulk Container) Manufacturers
Eyeliner and Kajal Sculpting Pencil Packaging Market Trends and Forecast 2025 to 2035
Evaluating Eyeliner and Kajal Sculpting Pencil Packaging Market Share & Provider Insights
Eyeliner Pen Market
Cap Liner Market Size and Share Forecast Outlook 2025 to 2035
Box Liners Market Size and Share Forecast Outlook 2025 to 2035
Pan Liner Market Insights – Demand, Growth & Industry Trends 2025-2035
EPE Liner Market Analysis – Size, Growth & Demand 2025 to 2035
Examining Market Share Trends in the Cap Liner Industry

Thank you!
You will receive an email from our Business Development Manager. Please be sure to check your SPAM/JUNK folder too.
Chat With
MaRIA