Industrial Operational Intelligence Solutions Market Size and Share Forecast Outlook 2025 to 2035

The Industrial Operational Intelligence Solutions Market is estimated to be valued at USD 25.0 billion in 2025 and is projected to reach USD 106.5 billion by 2035, registering a compound annual growth rate (CAGR) of 15.6% over the forecast period.
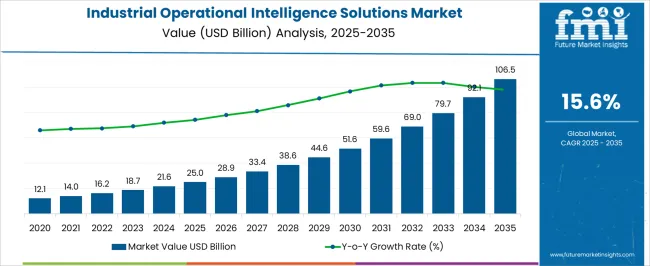
Quick Stats for Industrial Operational Intelligence Solutions Market

  • Industrial Operational Intelligence Solutions Market Value (2025): USD 25.0 billion
  • Industrial Operational Intelligence Solutions Market Forecast Value (2035): USD 106.5 billion
  • Industrial Operational Intelligence Solutions Market Forecast CAGR: 15.6%
  • Leading Segment in Industrial Operational Intelligence Solutions Market in 2025: Enterprise Manufacturing Operational Intelligence (26.9%)
  • Key Growth Regions in Industrial Operational Intelligence Solutions Market: North America, Asia-Pacific, Europe
  • Top Key Players in Industrial Operational Intelligence Solutions Market: Siemens AG, Splunk Corp, MapR Technologies, Inc, IFS, APRISO, Vitria Technology Inc, Starview Inc., Flexeye Ltd, ARC Advisory Group, AB&R® (American Barcode and RFID)

Industrial Operational Intelligence Solutions Market Market Value Analysis

Industrial Operational Intelligence Solutions Market Key Takeaways

Metric Value
Industrial Operational Intelligence Solutions Market Estimated Value in (2025 E) USD 25.0 billion
Industrial Operational Intelligence Solutions Market Forecast Value in (2035 F) USD 106.5 billion
Forecast CAGR (2025 to 2035) 15.6%

Why is the Industrial Operational Intelligence Solutions Market Growing?

The industrial operational intelligence solutions market is experiencing notable growth, supported by the increasing adoption of real-time analytics and decision-support systems across complex industrial environments. Rising demand for actionable insights that enhance productivity, reduce downtime, and improve supply chain visibility is fueling widespread implementation. These solutions integrate data streams from sensors, enterprise systems, and production equipment to deliver predictive and prescriptive intelligence.

The market is also being influenced by advancements in cloud computing, edge analytics, and artificial intelligence, which are enabling faster processing and improved scalability. Industries are prioritizing digital transformation strategies to achieve efficiency, resilience, and competitiveness, thereby expanding the scope for operational intelligence adoption.

In addition, growing regulatory requirements for safety, sustainability, and compliance are further encouraging industries to invest in integrated monitoring and intelligence platforms As industrial processes become increasingly interconnected, the demand for solutions that can unify data across diverse assets and functions is expected to intensify, positioning the market for consistent long-term expansion supported by ongoing innovation and enterprise-wide digital initiatives.

Segmental Analysis

The industrial operational intelligence solutions market is segmented by types, applications, end-use industry, and geographic regions. By types, industrial operational intelligence solutions market is divided into Enterprise Manufacturing Operational Intelligence, Enterprise Operational Intelligence Software, IT Service Intelligence, and Enterprise Security. In terms of applications, industrial operational intelligence solutions market is classified into Supply Chain And Logistics, Assembly Line Quality Assurance, Preventive Maintenance, Exploration & Production Optimisation, and Smart Meter Analysis. Based on end-use industry, industrial operational intelligence solutions market is segmented into Oil & Gas, Automobiles, Food & Beverages, Electronics, Logistics, and Aviation. Regionally, the industrial operational intelligence solutions industry is classified into North America, Latin America, Western Europe, Eastern Europe, Balkan & Baltic Countries, Russia & Belarus, Central Asia, East Asia, South Asia & Pacific, and the Middle East & Africa.
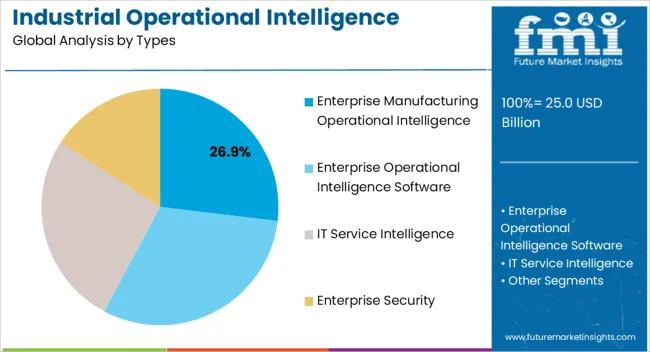
Insights into the Enterprise Manufacturing Operational Intelligence Type Segment

Industrial Operational Intelligence Solutions Market Analysis By Types

The enterprise manufacturing operational intelligence segment is projected to hold 26.9% of the industrial operational intelligence solutions market revenue share in 2025, making it the leading type. This leadership is being driven by its ability to unify manufacturing data from diverse sources and provide actionable insights for process optimization, quality management, and production planning. Adoption has been reinforced by the growing need for predictive maintenance, throughput improvement, and cost reduction across manufacturing facilities.

By leveraging real-time monitoring and analytics, manufacturers are able to proactively address inefficiencies and prevent costly downtime, which strengthens the appeal of these solutions. Integration with enterprise resource planning and manufacturing execution systems further enhances value by linking operational decisions with strategic objectives.

With digital transformation gaining momentum, enterprises are prioritizing solutions that can align factory-level intelligence with business-level outcomes Continuous advancements in industrial IoT, sensor integration, and edge analytics are enabling more granular insights, which is further consolidating the position of enterprise manufacturing operational intelligence as the preferred type within the market.
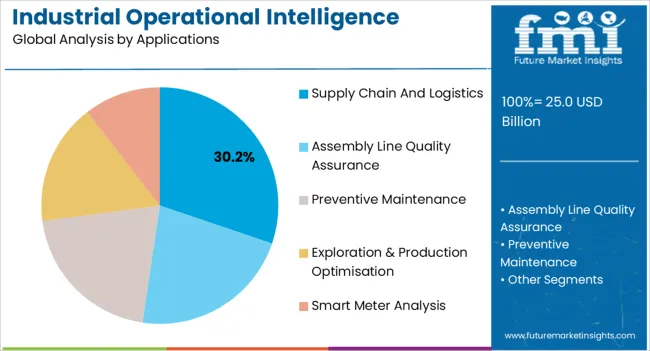
Insights into the Supply Chain and Logistics Application Segment

Industrial Operational Intelligence Solutions Market Analysis By Applications

The supply chain and logistics application segment is expected to account for 30.2% of the industrial operational intelligence solutions market revenue share in 2025, making it the leading application area. Its dominance is being driven by the growing complexity of global supply chains and the pressing need for real-time visibility, risk management, and optimization. Operational intelligence platforms are increasingly being deployed to monitor inventory flows, track shipments, and forecast demand, enabling enterprises to reduce bottlenecks and enhance delivery performance.

The ability to integrate with warehouse management systems, transportation management platforms, and supplier networks provides end-to-end visibility, which is crucial in a volatile market environment. The adoption of these solutions is also being encouraged by rising demand for predictive analytics that can anticipate disruptions and enable proactive decision-making.

Industries are leveraging operational intelligence to optimize costs, improve customer service, and meet sustainability objectives through efficient resource utilization As digital supply networks continue to evolve, the reliance on operational intelligence to ensure agility and resilience is expected to expand, solidifying the leadership of this application segment.
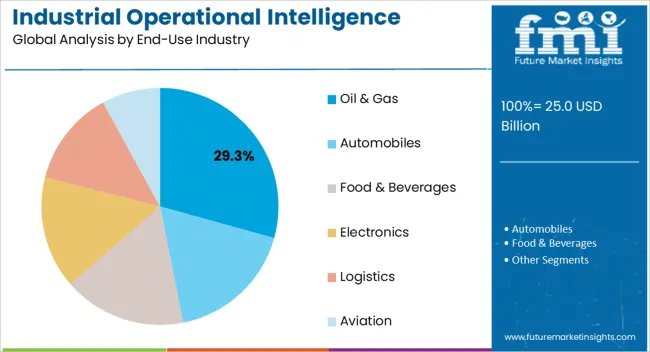
Insights into the Oil and Gas End-Use Industry Segment

Industrial Operational Intelligence Solutions Market Analysis By End Use Industry

The oil and gas segment is anticipated to capture 29.3% of the industrial operational intelligence solutions market revenue share in 2025, making it the leading end-use industry. This leadership is supported by the industry’s reliance on continuous monitoring, predictive maintenance, and real-time analytics to manage high-value assets and critical operations. Operational intelligence is being increasingly applied to optimize production processes, reduce downtime, and ensure regulatory compliance in upstream, midstream, and downstream activities.

With fluctuating global demand and price volatility, oil and gas companies are prioritizing solutions that improve operational efficiency and support cost management. The ability to integrate data from drilling equipment, pipelines, refineries, and distribution networks into a unified intelligence framework provides significant value by enabling informed decision-making.

Growing investments in digital oilfield initiatives and remote monitoring technologies are further reinforcing the adoption of operational intelligence platforms As sustainability goals and safety regulations intensify, the sector’s dependence on data-driven insights for risk mitigation and operational resilience is expected to sustain its dominant role in the market.

Market Overview

Industrial operational intelligence is a business analytics and real time dynamic solution that provides greater insights and visibility for businesses. Operational intelligence is used by organisations for real time capabilities to take immediate decisions like stopping any business process or making changes in any traditional systems.

Operational intelligence helps in improving and analysing business data through understanding the information related to shortfalls and finding simple ways of responding to any issues. Operational intelligence is simple and easy to be managed by skilled professionals. It helps to acquire information on financial performance of industries and enterprises, thus it has become a major trend in financial services sector.

Another major trend observed in operational intelligence is adoption of mobile tools for its operations. Thus in short operational intelligence automated the process of decision making that eliminates delays in process, and improves market responses and decision making. The industrial operational intelligence solutions market is anticipated to expand at a modest CAGR in the forecast period.
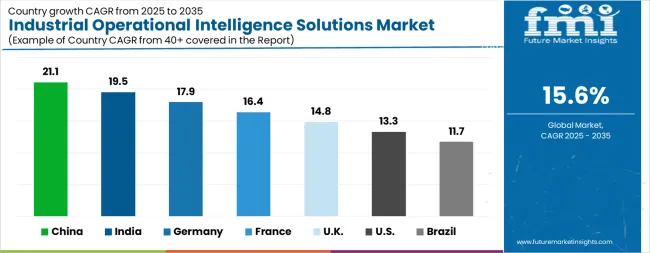
Analysis of Industrial Operational Intelligence Solutions Market By Key Countries

Industrial Operational Intelligence Solutions Market Cagr Analysis By Country

Country CAGR
China 21.1%
India 19.5%
Germany 17.9%
France 16.4%
UK 14.8%
USA 13.3%
Brazil 11.7%

Country-wise Analysis

The Industrial Operational Intelligence Solutions Market is expected to register a CAGR of 15.6% during the forecast period, exhibiting varied country level momentum. China leads with the highest CAGR of 21.1%, followed by India at 19.5%. Developed markets such as Germany, France, and the UK continue to expand steadily, while the USA is likely to grow at consistent rates. Brazil posts the lowest CAGR at 11.7%, yet still underscores a broadly positive trajectory for the global Industrial Operational Intelligence Solutions Market. In 2024, Germany held a dominant revenue in the Western Europe market and is expected to grow with a CAGR of 17.9%. The USA Industrial Operational Intelligence Solutions Market is estimated to be valued at USD 8.9 billion in 2025 and is anticipated to reach a valuation of USD 31.1 billion by 2035. Sales are projected to rise at a CAGR of 13.3% over the forecast period between 2025 and 2035. While Japan and South Korea markets are estimated to be valued at USD 1.2 billion and USD 654.6 million respectively in 2025.
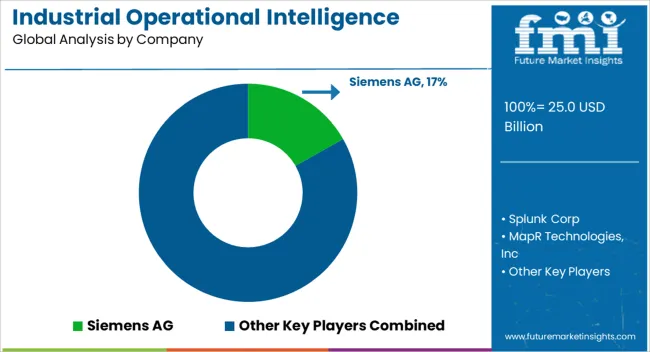
Key Players in the Industrial Operational Intelligence Solutions Market

Industrial Operational Intelligence Solutions Market Analysis By Company

  • Siemens AG
  • Splunk Corp
  • MapR Technologies, Inc
  • IFS
  • APRISO
  • Vitria Technology Inc
  • Starview Inc.
  • Flexeye Ltd
  • ARC Advisory Group
  • AB&R® (American Barcode and RFID)

Scope of the Report

Item Value
Quantitative Units USD 25.0 Billion
Types Enterprise Manufacturing Operational Intelligence, Enterprise Operational Intelligence Software, IT Service Intelligence, and Enterprise Security
Applications Supply Chain And Logistics, Assembly Line Quality Assurance, Preventive Maintenance, Exploration & Production Optimisation, and Smart Meter Analysis
End-Use Industry Oil & Gas, Automobiles, Food & Beverages, Electronics, Logistics, and Aviation
Regions Covered North America, Europe, Asia-Pacific, Latin America, Middle East & Africa
Country Covered United States, Canada, Germany, France, United Kingdom, China, Japan, India, Brazil, South Africa
Key Companies Profiled Siemens AG, Splunk Corp, MapR Technologies, Inc, IFS, APRISO, Vitria Technology Inc, Starview Inc., Flexeye Ltd, ARC Advisory Group, and AB&R® (American Barcode and RFID)

Industrial Operational Intelligence Solutions Market by Segments

Types:

  • Enterprise Manufacturing Operational Intelligence
  • Enterprise Operational Intelligence Software
  • IT Service Intelligence
  • Enterprise Security

Applications:

  • Supply Chain And Logistics
  • Assembly Line Quality Assurance
  • Preventive Maintenance
  • Exploration & Production Optimisation
  • Smart Meter Analysis

End-Use Industry:

  • Oil & Gas
  • Automobiles
  • Food & Beverages
  • Electronics
  • Logistics
  • Aviation

Region:

  • North America
    • USA
    • Canada
    • Mexico
  • Latin America
    • Brazil
    • Chile
    • Rest of Latin America
  • Western Europe
    • Germany
    • UK
    • Italy
    • Spain
    • France
    • Nordic
    • BENELUX
    • Rest of Western Europe
  • Eastern Europe
    • Russia
    • Poland
    • Hungary
    • Balkan & Baltic
    • Rest of Eastern Europe
  • East Asia
    • China
    • Japan
    • South Korea
  • South Asia and Pacific
    • India
    • ASEAN
    • Australia & New Zealand
    • Rest of South Asia and Pacific
  • Middle East & Africa
    • Kingdom of Saudi Arabia
    • Other GCC Countries
    • Turkiye
    • South Africa
    • Other African Union
    • Rest of Middle East & Africa

Table of Content

  1. Executive Summary
    • Global Market Outlook
    • Demand-side Trends
    • Supply-side Trends
    • Technology Roadmap Analysis
    • Analysis and Recommendations
  2. Market Overview
    • Market Coverage / Taxonomy
    • Market Definition / Scope / Limitations
  3. Market Background
    • Market Dynamics
      • Drivers
      • Restraints
      • Opportunity
      • Trends
    • Scenario Forecast
      • Demand in Optimistic Scenario
      • Demand in Likely Scenario
      • Demand in Conservative Scenario
    • Opportunity Map Analysis
    • Product Life Cycle Analysis
    • Supply Chain Analysis
    • Investment Feasibility Matrix
    • Value Chain Analysis
    • PESTLE and Porter’s Analysis
    • Regulatory Landscape
    • Regional Parent Market Outlook
    • Production and Consumption Statistics
    • Import and Export Statistics
  4. Global Market Analysis 2020 to 2024 and Forecast, 2025 to 2035
    • Historical Market Size Value (USD Million) Analysis, 2020 to 2024
    • Current and Future Market Size Value (USD Million) Projections, 2025 to 2035
      • Y-o-Y Growth Trend Analysis
      • Absolute $ Opportunity Analysis
  5. Global Market Pricing Analysis 2020 to 2024 and Forecast 2025 to 2035
  6. Global Market Analysis 2020 to 2024 and Forecast 2025 to 2035, By Types
    • Introduction / Key Findings
    • Historical Market Size Value (USD Million) Analysis By Types , 2020 to 2024
    • Current and Future Market Size Value (USD Million) Analysis and Forecast By Types , 2025 to 2035
      • Enterprise Manufacturing Operational Intelligence
      • Enterprise Operational Intelligence Software
      • IT Service Intelligence
      • Enterprise Security
    • Y-o-Y Growth Trend Analysis By Types , 2020 to 2024
    • Absolute $ Opportunity Analysis By Types , 2025 to 2035
  7. Global Market Analysis 2020 to 2024 and Forecast 2025 to 2035, By Applications
    • Introduction / Key Findings
    • Historical Market Size Value (USD Million) Analysis By Applications, 2020 to 2024
    • Current and Future Market Size Value (USD Million) Analysis and Forecast By Applications, 2025 to 2035
      • Supply Chain And Logistics
      • Assembly Line Quality Assurance
      • Preventive Maintenance
      • Exploration & Production Optimisation
      • Smart Meter Analysis
    • Y-o-Y Growth Trend Analysis By Applications, 2020 to 2024
    • Absolute $ Opportunity Analysis By Applications, 2025 to 2035
  8. Global Market Analysis 2020 to 2024 and Forecast 2025 to 2035, By End-Use Industry
    • Introduction / Key Findings
    • Historical Market Size Value (USD Million) Analysis By End-Use Industry, 2020 to 2024
    • Current and Future Market Size Value (USD Million) Analysis and Forecast By End-Use Industry, 2025 to 2035
      • Oil & Gas
      • Automobiles
      • Food & Beverages
      • Electronics
      • Logistics
      • Aviation
    • Y-o-Y Growth Trend Analysis By End-Use Industry, 2020 to 2024
    • Absolute $ Opportunity Analysis By End-Use Industry, 2025 to 2035
  9. Global Market Analysis 2020 to 2024 and Forecast 2025 to 2035, By Region
    • Introduction
    • Historical Market Size Value (USD Million) Analysis By Region, 2020 to 2024
    • Current Market Size Value (USD Million) Analysis and Forecast By Region, 2025 to 2035
      • North America
      • Latin America
      • Western Europe
      • Eastern Europe
      • East Asia
      • South Asia and Pacific
      • Middle East & Africa
    • Market Attractiveness Analysis By Region
  10. North America Market Analysis 2020 to 2024 and Forecast 2025 to 2035, By Country
    • Historical Market Size Value (USD Million) Trend Analysis By Market Taxonomy, 2020 to 2024
    • Market Size Value (USD Million) Forecast By Market Taxonomy, 2025 to 2035
      • By Country
        • USA
        • Canada
        • Mexico
      • By Types
      • By Applications
      • By End-Use Industry
    • Market Attractiveness Analysis
      • By Country
      • By Types
      • By Applications
      • By End-Use Industry
    • Key Takeaways
  11. Latin America Market Analysis 2020 to 2024 and Forecast 2025 to 2035, By Country
    • Historical Market Size Value (USD Million) Trend Analysis By Market Taxonomy, 2020 to 2024
    • Market Size Value (USD Million) Forecast By Market Taxonomy, 2025 to 2035
      • By Country
        • Brazil
        • Chile
        • Rest of Latin America
      • By Types
      • By Applications
      • By End-Use Industry
    • Market Attractiveness Analysis
      • By Country
      • By Types
      • By Applications
      • By End-Use Industry
    • Key Takeaways
  12. Western Europe Market Analysis 2020 to 2024 and Forecast 2025 to 2035, By Country
    • Historical Market Size Value (USD Million) Trend Analysis By Market Taxonomy, 2020 to 2024
    • Market Size Value (USD Million) Forecast By Market Taxonomy, 2025 to 2035
      • By Country
        • Germany
        • UK
        • Italy
        • Spain
        • France
        • Nordic
        • BENELUX
        • Rest of Western Europe
      • By Types
      • By Applications
      • By End-Use Industry
    • Market Attractiveness Analysis
      • By Country
      • By Types
      • By Applications
      • By End-Use Industry
    • Key Takeaways
  13. Eastern Europe Market Analysis 2020 to 2024 and Forecast 2025 to 2035, By Country
    • Historical Market Size Value (USD Million) Trend Analysis By Market Taxonomy, 2020 to 2024
    • Market Size Value (USD Million) Forecast By Market Taxonomy, 2025 to 2035
      • By Country
        • Russia
        • Poland
        • Hungary
        • Balkan & Baltic
        • Rest of Eastern Europe
      • By Types
      • By Applications
      • By End-Use Industry
    • Market Attractiveness Analysis
      • By Country
      • By Types
      • By Applications
      • By End-Use Industry
    • Key Takeaways
  14. East Asia Market Analysis 2020 to 2024 and Forecast 2025 to 2035, By Country
    • Historical Market Size Value (USD Million) Trend Analysis By Market Taxonomy, 2020 to 2024
    • Market Size Value (USD Million) Forecast By Market Taxonomy, 2025 to 2035
      • By Country
        • China
        • Japan
        • South Korea
      • By Types
      • By Applications
      • By End-Use Industry
    • Market Attractiveness Analysis
      • By Country
      • By Types
      • By Applications
      • By End-Use Industry
    • Key Takeaways
  15. South Asia and Pacific Market Analysis 2020 to 2024 and Forecast 2025 to 2035, By Country
    • Historical Market Size Value (USD Million) Trend Analysis By Market Taxonomy, 2020 to 2024
    • Market Size Value (USD Million) Forecast By Market Taxonomy, 2025 to 2035
      • By Country
        • India
        • ASEAN
        • Australia & New Zealand
        • Rest of South Asia and Pacific
      • By Types
      • By Applications
      • By End-Use Industry
    • Market Attractiveness Analysis
      • By Country
      • By Types
      • By Applications
      • By End-Use Industry
    • Key Takeaways
  16. Middle East & Africa Market Analysis 2020 to 2024 and Forecast 2025 to 2035, By Country
    • Historical Market Size Value (USD Million) Trend Analysis By Market Taxonomy, 2020 to 2024
    • Market Size Value (USD Million) Forecast By Market Taxonomy, 2025 to 2035
      • By Country
        • Kingdom of Saudi Arabia
        • Other GCC Countries
        • Turkiye
        • South Africa
        • Other African Union
        • Rest of Middle East & Africa
      • By Types
      • By Applications
      • By End-Use Industry
    • Market Attractiveness Analysis
      • By Country
      • By Types
      • By Applications
      • By End-Use Industry
    • Key Takeaways
  17. Key Countries Market Analysis
    • USA
      • Pricing Analysis
      • Market Share Analysis, 2024
        • By Types
        • By Applications
        • By End-Use Industry
    • Canada
      • Pricing Analysis
      • Market Share Analysis, 2024
        • By Types
        • By Applications
        • By End-Use Industry
    • Mexico
      • Pricing Analysis
      • Market Share Analysis, 2024
        • By Types
        • By Applications
        • By End-Use Industry
    • Brazil
      • Pricing Analysis
      • Market Share Analysis, 2024
        • By Types
        • By Applications
        • By End-Use Industry
    • Chile
      • Pricing Analysis
      • Market Share Analysis, 2024
        • By Types
        • By Applications
        • By End-Use Industry
    • Germany
      • Pricing Analysis
      • Market Share Analysis, 2024
        • By Types
        • By Applications
        • By End-Use Industry
    • UK
      • Pricing Analysis
      • Market Share Analysis, 2024
        • By Types
        • By Applications
        • By End-Use Industry
    • Italy
      • Pricing Analysis
      • Market Share Analysis, 2024
        • By Types
        • By Applications
        • By End-Use Industry
    • Spain
      • Pricing Analysis
      • Market Share Analysis, 2024
        • By Types
        • By Applications
        • By End-Use Industry
    • France
      • Pricing Analysis
      • Market Share Analysis, 2024
        • By Types
        • By Applications
        • By End-Use Industry
    • India
      • Pricing Analysis
      • Market Share Analysis, 2024
        • By Types
        • By Applications
        • By End-Use Industry
    • ASEAN
      • Pricing Analysis
      • Market Share Analysis, 2024
        • By Types
        • By Applications
        • By End-Use Industry
    • Australia & New Zealand
      • Pricing Analysis
      • Market Share Analysis, 2024
        • By Types
        • By Applications
        • By End-Use Industry
    • China
      • Pricing Analysis
      • Market Share Analysis, 2024
        • By Types
        • By Applications
        • By End-Use Industry
    • Japan
      • Pricing Analysis
      • Market Share Analysis, 2024
        • By Types
        • By Applications
        • By End-Use Industry
    • South Korea
      • Pricing Analysis
      • Market Share Analysis, 2024
        • By Types
        • By Applications
        • By End-Use Industry
    • Russia
      • Pricing Analysis
      • Market Share Analysis, 2024
        • By Types
        • By Applications
        • By End-Use Industry
    • Poland
      • Pricing Analysis
      • Market Share Analysis, 2024
        • By Types
        • By Applications
        • By End-Use Industry
    • Hungary
      • Pricing Analysis
      • Market Share Analysis, 2024
        • By Types
        • By Applications
        • By End-Use Industry
    • Kingdom of Saudi Arabia
      • Pricing Analysis
      • Market Share Analysis, 2024
        • By Types
        • By Applications
        • By End-Use Industry
    • Turkiye
      • Pricing Analysis
      • Market Share Analysis, 2024
        • By Types
        • By Applications
        • By End-Use Industry
    • South Africa
      • Pricing Analysis
      • Market Share Analysis, 2024
        • By Types
        • By Applications
        • By End-Use Industry
  18. Market Structure Analysis
    • Competition Dashboard
    • Competition Benchmarking
    • Market Share Analysis of Top Players
      • By Regional
      • By Types
      • By Applications
      • By End-Use Industry
  19. Competition Analysis
    • Competition Deep Dive
      • Siemens AG
        • Overview
        • Product Portfolio
        • Profitability by Market Segments (Product/Age /Sales Channel/Region)
        • Sales Footprint
        • Strategy Overview
          • Marketing Strategy
          • Product Strategy
          • Channel Strategy
      • Splunk Corp
      • MapR Technologies, Inc
      • IFS
      • APRISO
      • Vitria Technology Inc
      • Starview Inc.
      • Flexeye Ltd
      • ARC Advisory Group
      • AB&R® (American Barcode and RFID)
  20. Assumptions & Acronyms Used
  21. Research Methodology

List of Tables

  • Table 1: Global Market Value (USD Million) Forecast by Region, 2020 to 2035
  • Table 2: Global Market Value (USD Million) Forecast by Types , 2020 to 2035
  • Table 3: Global Market Value (USD Million) Forecast by Applications, 2020 to 2035
  • Table 4: Global Market Value (USD Million) Forecast by End-Use Industry, 2020 to 2035
  • Table 5: North America Market Value (USD Million) Forecast by Country, 2020 to 2035
  • Table 6: North America Market Value (USD Million) Forecast by Types , 2020 to 2035
  • Table 7: North America Market Value (USD Million) Forecast by Applications, 2020 to 2035
  • Table 8: North America Market Value (USD Million) Forecast by End-Use Industry, 2020 to 2035
  • Table 9: Latin America Market Value (USD Million) Forecast by Country, 2020 to 2035
  • Table 10: Latin America Market Value (USD Million) Forecast by Types , 2020 to 2035
  • Table 11: Latin America Market Value (USD Million) Forecast by Applications, 2020 to 2035
  • Table 12: Latin America Market Value (USD Million) Forecast by End-Use Industry, 2020 to 2035
  • Table 13: Western Europe Market Value (USD Million) Forecast by Country, 2020 to 2035
  • Table 14: Western Europe Market Value (USD Million) Forecast by Types , 2020 to 2035
  • Table 15: Western Europe Market Value (USD Million) Forecast by Applications, 2020 to 2035
  • Table 16: Western Europe Market Value (USD Million) Forecast by End-Use Industry, 2020 to 2035
  • Table 17: Eastern Europe Market Value (USD Million) Forecast by Country, 2020 to 2035
  • Table 18: Eastern Europe Market Value (USD Million) Forecast by Types , 2020 to 2035
  • Table 19: Eastern Europe Market Value (USD Million) Forecast by Applications, 2020 to 2035
  • Table 20: Eastern Europe Market Value (USD Million) Forecast by End-Use Industry, 2020 to 2035
  • Table 21: East Asia Market Value (USD Million) Forecast by Country, 2020 to 2035
  • Table 22: East Asia Market Value (USD Million) Forecast by Types , 2020 to 2035
  • Table 23: East Asia Market Value (USD Million) Forecast by Applications, 2020 to 2035
  • Table 24: East Asia Market Value (USD Million) Forecast by End-Use Industry, 2020 to 2035
  • Table 25: South Asia and Pacific Market Value (USD Million) Forecast by Country, 2020 to 2035
  • Table 26: South Asia and Pacific Market Value (USD Million) Forecast by Types , 2020 to 2035
  • Table 27: South Asia and Pacific Market Value (USD Million) Forecast by Applications, 2020 to 2035
  • Table 28: South Asia and Pacific Market Value (USD Million) Forecast by End-Use Industry, 2020 to 2035
  • Table 29: Middle East & Africa Market Value (USD Million) Forecast by Country, 2020 to 2035
  • Table 30: Middle East & Africa Market Value (USD Million) Forecast by Types , 2020 to 2035
  • Table 31: Middle East & Africa Market Value (USD Million) Forecast by Applications, 2020 to 2035
  • Table 32: Middle East & Africa Market Value (USD Million) Forecast by End-Use Industry, 2020 to 2035

List of Figures

  • Figure 1: Global Market Pricing Analysis
  • Figure 2: Global Market Value (USD Million) Forecast 2020-2035
  • Figure 3: Global Market Value Share and BPS Analysis by Types , 2025 and 2035
  • Figure 4: Global Market Y-o-Y Growth Comparison by Types , 2025-2035
  • Figure 5: Global Market Attractiveness Analysis by Types
  • Figure 6: Global Market Value Share and BPS Analysis by Applications, 2025 and 2035
  • Figure 7: Global Market Y-o-Y Growth Comparison by Applications, 2025-2035
  • Figure 8: Global Market Attractiveness Analysis by Applications
  • Figure 9: Global Market Value Share and BPS Analysis by End-Use Industry, 2025 and 2035
  • Figure 10: Global Market Y-o-Y Growth Comparison by End-Use Industry, 2025-2035
  • Figure 11: Global Market Attractiveness Analysis by End-Use Industry
  • Figure 12: Global Market Value (USD Million) Share and BPS Analysis by Region, 2025 and 2035
  • Figure 13: Global Market Y-o-Y Growth Comparison by Region, 2025-2035
  • Figure 14: Global Market Attractiveness Analysis by Region
  • Figure 15: North America Market Incremental Dollar Opportunity, 2025-2035
  • Figure 16: Latin America Market Incremental Dollar Opportunity, 2025-2035
  • Figure 17: Western Europe Market Incremental Dollar Opportunity, 2025-2035
  • Figure 18: Eastern Europe Market Incremental Dollar Opportunity, 2025-2035
  • Figure 19: East Asia Market Incremental Dollar Opportunity, 2025-2035
  • Figure 20: South Asia and Pacific Market Incremental Dollar Opportunity, 2025-2035
  • Figure 21: Middle East & Africa Market Incremental Dollar Opportunity, 2025-2035
  • Figure 22: North America Market Value Share and BPS Analysis by Country, 2025 and 2035
  • Figure 23: North America Market Value Share and BPS Analysis by Types , 2025 and 2035
  • Figure 24: North America Market Y-o-Y Growth Comparison by Types , 2025-2035
  • Figure 25: North America Market Attractiveness Analysis by Types
  • Figure 26: North America Market Value Share and BPS Analysis by Applications, 2025 and 2035
  • Figure 27: North America Market Y-o-Y Growth Comparison by Applications, 2025-2035
  • Figure 28: North America Market Attractiveness Analysis by Applications
  • Figure 29: North America Market Value Share and BPS Analysis by End-Use Industry, 2025 and 2035
  • Figure 30: North America Market Y-o-Y Growth Comparison by End-Use Industry, 2025-2035
  • Figure 31: North America Market Attractiveness Analysis by End-Use Industry
  • Figure 32: Latin America Market Value Share and BPS Analysis by Country, 2025 and 2035
  • Figure 33: Latin America Market Value Share and BPS Analysis by Types , 2025 and 2035
  • Figure 34: Latin America Market Y-o-Y Growth Comparison by Types , 2025-2035
  • Figure 35: Latin America Market Attractiveness Analysis by Types
  • Figure 36: Latin America Market Value Share and BPS Analysis by Applications, 2025 and 2035
  • Figure 37: Latin America Market Y-o-Y Growth Comparison by Applications, 2025-2035
  • Figure 38: Latin America Market Attractiveness Analysis by Applications
  • Figure 39: Latin America Market Value Share and BPS Analysis by End-Use Industry, 2025 and 2035
  • Figure 40: Latin America Market Y-o-Y Growth Comparison by End-Use Industry, 2025-2035
  • Figure 41: Latin America Market Attractiveness Analysis by End-Use Industry
  • Figure 42: Western Europe Market Value Share and BPS Analysis by Country, 2025 and 2035
  • Figure 43: Western Europe Market Value Share and BPS Analysis by Types , 2025 and 2035
  • Figure 44: Western Europe Market Y-o-Y Growth Comparison by Types , 2025-2035
  • Figure 45: Western Europe Market Attractiveness Analysis by Types
  • Figure 46: Western Europe Market Value Share and BPS Analysis by Applications, 2025 and 2035
  • Figure 47: Western Europe Market Y-o-Y Growth Comparison by Applications, 2025-2035
  • Figure 48: Western Europe Market Attractiveness Analysis by Applications
  • Figure 49: Western Europe Market Value Share and BPS Analysis by End-Use Industry, 2025 and 2035
  • Figure 50: Western Europe Market Y-o-Y Growth Comparison by End-Use Industry, 2025-2035
  • Figure 51: Western Europe Market Attractiveness Analysis by End-Use Industry
  • Figure 52: Eastern Europe Market Value Share and BPS Analysis by Country, 2025 and 2035
  • Figure 53: Eastern Europe Market Value Share and BPS Analysis by Types , 2025 and 2035
  • Figure 54: Eastern Europe Market Y-o-Y Growth Comparison by Types , 2025-2035
  • Figure 55: Eastern Europe Market Attractiveness Analysis by Types
  • Figure 56: Eastern Europe Market Value Share and BPS Analysis by Applications, 2025 and 2035
  • Figure 57: Eastern Europe Market Y-o-Y Growth Comparison by Applications, 2025-2035
  • Figure 58: Eastern Europe Market Attractiveness Analysis by Applications
  • Figure 59: Eastern Europe Market Value Share and BPS Analysis by End-Use Industry, 2025 and 2035
  • Figure 60: Eastern Europe Market Y-o-Y Growth Comparison by End-Use Industry, 2025-2035
  • Figure 61: Eastern Europe Market Attractiveness Analysis by End-Use Industry
  • Figure 62: East Asia Market Value Share and BPS Analysis by Country, 2025 and 2035
  • Figure 63: East Asia Market Value Share and BPS Analysis by Types , 2025 and 2035
  • Figure 64: East Asia Market Y-o-Y Growth Comparison by Types , 2025-2035
  • Figure 65: East Asia Market Attractiveness Analysis by Types
  • Figure 66: East Asia Market Value Share and BPS Analysis by Applications, 2025 and 2035
  • Figure 67: East Asia Market Y-o-Y Growth Comparison by Applications, 2025-2035
  • Figure 68: East Asia Market Attractiveness Analysis by Applications
  • Figure 69: East Asia Market Value Share and BPS Analysis by End-Use Industry, 2025 and 2035
  • Figure 70: East Asia Market Y-o-Y Growth Comparison by End-Use Industry, 2025-2035
  • Figure 71: East Asia Market Attractiveness Analysis by End-Use Industry
  • Figure 72: South Asia and Pacific Market Value Share and BPS Analysis by Country, 2025 and 2035
  • Figure 73: South Asia and Pacific Market Value Share and BPS Analysis by Types , 2025 and 2035
  • Figure 74: South Asia and Pacific Market Y-o-Y Growth Comparison by Types , 2025-2035
  • Figure 75: South Asia and Pacific Market Attractiveness Analysis by Types
  • Figure 76: South Asia and Pacific Market Value Share and BPS Analysis by Applications, 2025 and 2035
  • Figure 77: South Asia and Pacific Market Y-o-Y Growth Comparison by Applications, 2025-2035
  • Figure 78: South Asia and Pacific Market Attractiveness Analysis by Applications
  • Figure 79: South Asia and Pacific Market Value Share and BPS Analysis by End-Use Industry, 2025 and 2035
  • Figure 80: South Asia and Pacific Market Y-o-Y Growth Comparison by End-Use Industry, 2025-2035
  • Figure 81: South Asia and Pacific Market Attractiveness Analysis by End-Use Industry
  • Figure 82: Middle East & Africa Market Value Share and BPS Analysis by Country, 2025 and 2035
  • Figure 83: Middle East & Africa Market Value Share and BPS Analysis by Types , 2025 and 2035
  • Figure 84: Middle East & Africa Market Y-o-Y Growth Comparison by Types , 2025-2035
  • Figure 85: Middle East & Africa Market Attractiveness Analysis by Types
  • Figure 86: Middle East & Africa Market Value Share and BPS Analysis by Applications, 2025 and 2035
  • Figure 87: Middle East & Africa Market Y-o-Y Growth Comparison by Applications, 2025-2035
  • Figure 88: Middle East & Africa Market Attractiveness Analysis by Applications
  • Figure 89: Middle East & Africa Market Value Share and BPS Analysis by End-Use Industry, 2025 and 2035
  • Figure 90: Middle East & Africa Market Y-o-Y Growth Comparison by End-Use Industry, 2025-2035
  • Figure 91: Middle East & Africa Market Attractiveness Analysis by End-Use Industry
  • Figure 92: Global Market - Tier Structure Analysis
  • Figure 93: Global Market - Company Share Analysis

Frequently Asked Questions

How big is the industrial operational intelligence solutions market in 2025?

The global industrial operational intelligence solutions market is estimated to be valued at USD 25.0 billion in 2025.

What will be the size of industrial operational intelligence solutions market in 2035?

The market size for the industrial operational intelligence solutions market is projected to reach USD 106.5 billion by 2035.

How much will be the industrial operational intelligence solutions market growth between 2025 and 2035?

The industrial operational intelligence solutions market is expected to grow at a 15.6% CAGR between 2025 and 2035.

What are the key product types in the industrial operational intelligence solutions market?

The key product types in industrial operational intelligence solutions market are enterprise manufacturing operational intelligence, enterprise operational intelligence software, it service intelligence and enterprise security.

Which applications segment to contribute significant share in the industrial operational intelligence solutions market in 2025?

In terms of applications, supply chain and logistics segment to command 30.2% share in the industrial operational intelligence solutions market in 2025.

Explore Similar Insights

Future Market Insights

Industrial Operational Intelligence Solutions Market

Chat With

MaRIA

Hi There, I am MaRIA, Your Market Research Intelligence Assistant. How may I help you?