Ingestible Sensors Market Forecast and Outlook 2025 to 2035

The ingestible sensors market is projected to grow from USD 983.6 million in 2025 to approximately USD 1,696.1 million by 2035, recording an absolute increase of USD 712.5 million over the forecast period. This translates into a total growth of 72.4%, with the market forecast to expand at a compound annual growth rate (CAGR) of 5.6% between 2025 and 2035. The overall market size is expected to grow by nearly 1.7X during the same period, supported by increasing adoption of digital health monitoring solutions, rising demand for non-invasive diagnostic tools, and growing focus on medication adherence monitoring.
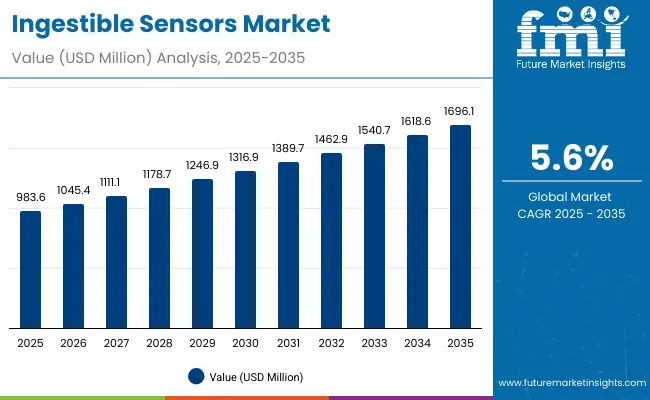
Quick Stats for Ingestible Sensors Market

  • Ingestible Sensors Market Value (2025): USD 983.6 million
  • Ingestible Sensors Market Forecast Value (2035): USD 1,696.1 million
  • Ingestible Sensors Market Forecast CAGR: 5.6%
  • Leading Sensor Type in Ingestible Sensors Market: Temperature (41.5%)
  • Key Growth Regions in Ingestible Sensors Market: North America, Europe, and Asia Pacific
  • Key Players in Ingestible Sensors Market: Medtronic PLC, CapsoVision Inc., IntroMedic Co. Ltd., Olympus Corporation, Jinshan Science & Technology, Boston Scientific

Ingestible Sensors Market

Ingestible Sensors Market Key Takeaways

Metric Value
Estimated Value in (2025E) USD 983.6 million
Forecast Value in (2035F) USD 1,696.1 million
Forecast CAGR (2025 to 2035) 5.6%

Between 2025 and 2030, the ingestible sensors market is projected to expand from USD 983.6 million to USD 1,291.6 million, resulting in a value increase of USD 308.0 million, which represents 43.2% of the total forecast growth for the decade. This phase of growth will be shaped by rising awareness about remote patient monitoring solutions, increasing demand for personalized healthcare approaches, and growing penetration of digital therapeutics in emerging markets. Healthcare providers are expanding their ingestible sensor adoption to address the growing demand for effective patient monitoring solutions for chronic disease management.

From 2030 to 2035, the market is forecast to grow from USD 1,291.6 million to USD 1,696.1 million, adding another USD 404.5 million, which constitutes 56.8% of the overall ten-year expansion. This period is expected to be characterized by expansion of specialized healthcare monitoring channels, integration of artificial intelligence with sensor technology, and development of personalized diagnostic protocols. The growing adoption of evidence-based medicine and healthcare provider recommendations will drive demand for clinically proven ingestible sensors with enhanced accuracy and safety profiles.

Between 2020 and 2025, the ingestible sensors market experienced steady expansion, driven by increasing recognition of medication adherence challenges and growing acceptance of digital health monitoring approaches. The market developed as healthcare providers recognized the need for comprehensive monitoring solutions to address chronic disease management. Clinical research and regulatory approvals began emphasizing the importance of ingestible sensors in achieving better patient outcomes for medication compliance and physiological monitoring.

Why is the Ingestible Sensors Market Growing?

Market expansion is being supported by the increasing prevalence of chronic diseases and the corresponding demand for continuous patient monitoring approaches. Modern healthcare providers are increasingly focused on sensor technologies that can provide real-time physiological data, improve medication adherence, and reduce the burden of frequent clinical visits. The proven efficacy of ingestible sensors in monitoring conditions like gastrointestinal disorders, medication compliance, and vital signs makes them essential components of comprehensive healthcare monitoring plans.

The growing emphasis on personalized medicine and precision healthcare is driving demand for tailored sensor technologies that address individual patient needs and health profiles. Healthcare provider preference for non-invasive monitoring solutions that combine multiple sensing capabilities in single devices is creating opportunities for innovative sensor development. The rising influence of clinical guidelines and evidence-based treatment protocols is also contributing to increased adoption of proven ingestible sensor technologies across different patient populations and therapeutic areas.

Segmental Analysis

The market is segmented by sensor type, function, end use, and region. By sensor type, the market is divided into temperature, pressure, pH, and image/imaging sensors. Based on function, the market is categorized into monitoring/adherence, imaging/diagnostics, and drug delivery trigger applications. In terms of end use, the market is segmented into healthcare, sports/fitness, military, and other applications. Regionally, the market is divided into North America, Europe, East Asia, South Asia & Pacific, Latin America, and Middle East & Africa.
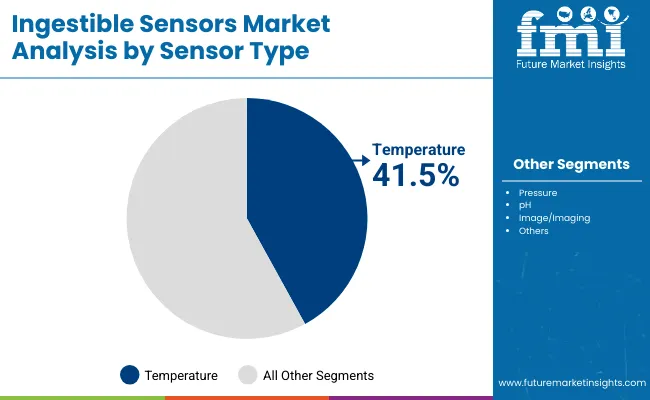
By Sensor Type, Temperature Segment Accounts for 41.5% Market Share

Ingestible Sensors Market By Sensor

The temperature sensor segment is projected to account for 41.5% of the ingestible sensors market in 2025, reaffirming its position as the category's dominant sensor type. Healthcare providers increasingly recognize the critical importance of continuous temperature monitoring for detecting infections, inflammatory conditions, and metabolic disorders through minimally invasive sensor technology. This sensor type addresses core physiological monitoring needs and provides essential diagnostic information for various medical conditions.

This sensor type forms the foundation of most monitoring protocols for chronic health conditions, as it represents the most clinically validated and widely accepted sensing approach in digital health. Regulatory approvals and extensive clinical research continue to strengthen confidence in these sensor formulations. With increasing recognition of the importance of continuous physiological monitoring requiring multi-parameter approaches, temperature sensors align with both acute monitoring and long-term health management goals. Their broad therapeutic utility across multiple indications ensures sustained market dominance, making them the central growth driver of ingestible sensor demand.
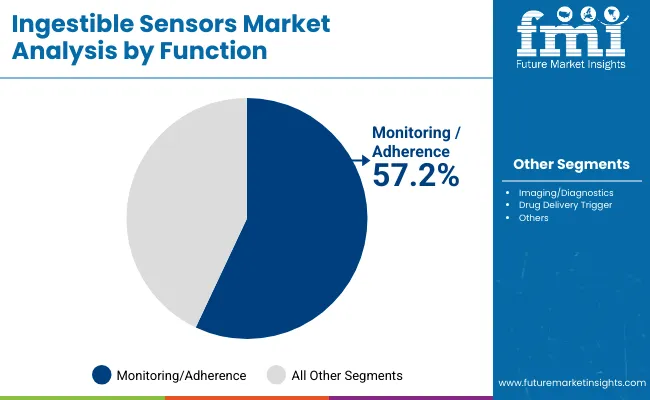
By Function, Monitoring/Adherence Segment Accounts for 57.2% Market Share

Ingestible Sensors Market By Function

Monitoring/adherence function is projected to represent 57.2% of ingestible sensors demand in 2025, underscoring their role as the primary function driving sensor adoption. Healthcare providers recognize that medication adherence and continuous physiological monitoring require sophisticated sensing technologies that traditional monitoring methods cannot adequately address. Sensor technologies offer enhanced capabilities in tracking medication intake, physiological parameters, and treatment compliance.

The segment is supported by the chronic nature of many health conditions requiring long-term monitoring and the growing recognition that sensor approaches can improve patient outcomes and quality of life. Additionally, healthcare systems are increasingly adopting evidence-based monitoring guidelines that recommend specific sensor technologies for optimal patient management. As clinical understanding of chronic disease management advances, monitoring and adherence applications will continue to play a crucial role in comprehensive healthcare strategies, reinforcing their essential position within the ingestible sensors market.
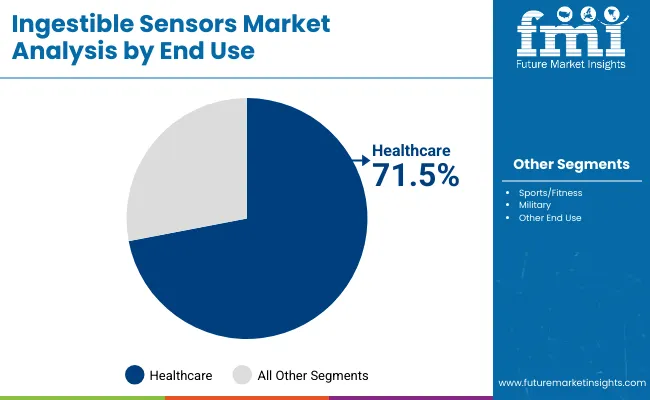
By End Use, Healthcare Segment Accounts for 71.5% Market Share

Ingestible Sensors Market By End Use

The healthcare channel is forecasted to contribute 71.5% of the ingestible sensors market in 2025, reflecting the primary role of medical institutions in sensor-based patient monitoring and care. Patients with chronic health conditions rely on healthcare providers for sophisticated monitoring solutions, making healthcare facilities the cornerstone of ingestible sensor utilization. This channel provides essential services including sensor deployment, data interpretation, and coordination with treatment protocols.

The segment benefits from established relationships between patients and healthcare providers, who provide continuity of care and monitoring support. Healthcare facilities also offer advantages in terms of clinical expertise, data analysis capabilities, and integration with electronic health records. With growing emphasis on precision medicine and patient-centered healthcare services, medical institutions serve as critical deployment points for ingestible sensors, making them fundamental drivers of market accessibility and growth.

What are the Drivers, Restraints, and Key Trends of the Ingestible Sensors Market?

The ingestible sensors market is advancing steadily due to increasing recognition of medication adherence challenges and growing demand for non-invasive monitoring approaches. However, the market faces challenges including complex regulatory pathways, potential for patient safety concerns, and issues with data privacy and security. Innovation in sensor miniaturization and wireless communication technologies continue to influence product development and market expansion patterns.

Expansion of Digital Health Platforms and Remote Monitoring Systems

The growing adoption of telemedicine and remote patient monitoring is enabling more sophisticated sensor-based healthcare delivery and patient management. Digital health platforms offer comprehensive data collection services, including real-time physiological monitoring and medication adherence tracking, that are particularly important for managing chronic conditions remotely. Remote monitoring systems provide access to continuous patient data that can optimize treatment protocols and medication management.

Integration of Artificial Intelligence and Machine Learning Technologies

Modern healthcare companies are incorporating artificial intelligence technologies such as predictive analytics, pattern recognition systems, and automated alert generation to enhance sensor-based monitoring capabilities. These technologies improve diagnostic accuracy, enable real-time health status assessment, and provide better coordination between healthcare providers and patients. Advanced AI platforms also enable personalized health recommendations and early identification of potential health complications or medication issues.
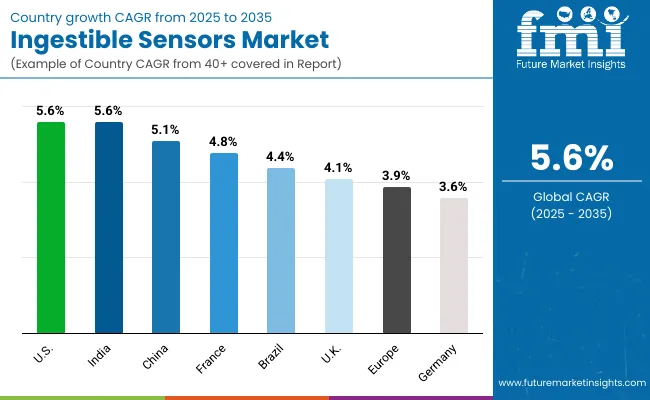
Analysis of Ingestible Sensors Market by Key Country

Ingestible Sensors Market By Country

Country CAGR (2025 to 2035)
USA 5.6%
India 5.6%
China 5.1%
UK 4.1%
Brazil 4.4%
France 4.8%
Germany 3.6%

The ingestible sensors market is experiencing varied growth globally, with the USA and India both leading at a 5.6% CAGR through 2035, driven by expanding digital health infrastructure, increasing chronic disease prevalence, and growing access to advanced medical technologies. China follows at 5.1%, supported by healthcare system modernization, increasing recognition of preventive medicine importance, and expanding sensor technology adoption. Brazil shows growth at 4.4%, emphasizing improved access to digital health solutions and sensor technology adoption. Europe records 3.9% growth, focusing on evidence-based monitoring protocols and comprehensive healthcare systems. Germany shows 3.6% growth, representing a mature market with established monitoring patterns and regulatory frameworks.

The report covers an in-depth analysis of 40+ countries; seven top-performing countries are highlighted below.

China Demonstrates Growing Market Potential with Digital Health Development

Revenue from ingestible sensors in China is projected to exhibit steady growth with a CAGR of 5.1% through 2035, driven by ongoing healthcare system modernization and increasing recognition of digital health as a priority healthcare solution. The country's expanding healthcare infrastructure and growing availability of specialized monitoring services are creating significant opportunities for sensor technology adoption. Major international and domestic technology companies are establishing comprehensive distribution networks to serve the growing population of patients requiring continuous health monitoring across urban and developing regions.

  • Government initiatives supporting digital health development and insurance coverage expansion are driving demand for evidence-based monitoring technologies throughout major metropolitan and provincial areas.
  • Healthcare provider education and clinical guideline development are supporting appropriate utilization of sensor technologies among medical specialists and primary care providers nationwide.

India Demonstrates Exceptional Market Potential with Healthcare Infrastructure Development

Revenue from ingestible sensors in India is expanding at a CAGR of 5.6%, supported by increasing healthcare accessibility, growing chronic disease awareness, and expanding digital health market presence. The country's large patient population and increasing recognition of preventive medicine are driving demand for effective sensor monitoring solutions. International technology companies and domestic manufacturers are establishing distribution channels to serve the growing demand for quality healthcare monitoring technologies.

  • Rising awareness about chronic disease management options and reducing healthcare access barriers are creating opportunities for specialized monitoring technologies across urban and rural healthcare settings.
  • Growing healthcare infrastructure development and insurance coverage expansion are supporting increased access to sensor technologies among patients requiring comprehensive health monitoring.

United States Maintains Market Leadership with Established Digital Health Protocols

Demand for ingestible sensors in the USA is projected to grow at a CAGR of 5.6%, supported by well-established digital health systems and evidence-based monitoring guidelines. American healthcare providers consistently utilize sensor technologies for chronic disease management and preventive care applications. The market is characterized by mature monitoring protocols, comprehensive insurance coverage, and established relationships between healthcare providers and technology companies.

  • Evidence-based monitoring guidelines and clinical research are supporting continued utilization of proven sensor technologies throughout healthcare systems.
  • Digital health networks and managed care organizations are facilitating access to sensor technologies while ensuring appropriate utilization and cost management.

Brazil Shows Promising Growth with Healthcare System Expansion

Revenue from ingestible sensors in Brazil is projected to grow at a CAGR of 4.4% through 2035, driven by healthcare system development, increasing access to digital health solutions, and growing recognition of chronic disease management importance. Brazilian healthcare providers are increasingly adopting sensor technology approaches for complex medical conditions, supported by expanding technology market presence and improved monitoring accessibility.

  • Public healthcare system development and technology access programs are supporting increased availability of sensor technologies across diverse patient populations.
  • Growing collaboration between international technology companies and local healthcare providers is enhancing monitoring options and clinical expertise in sensor technology management.

United Kingdom Demonstrates Stable Growth with NHS Framework Support

Revenue from ingestible sensors in the UK is projected to grow at a CAGR of 4.1% through 2035, supported by the National Health Service framework and comprehensive evidence-based monitoring guidelines that facilitate appropriate use of sensor technologies for chronic disease management. British healthcare providers consistently utilize established protocols for sensor technology management, emphasizing patient outcomes and monitoring optimization within integrated care systems.

  • NHS monitoring pathways and clinical guidelines are supporting systematic adoption of proven sensor technologies across primary care and specialist medical services.
  • Healthcare provider education programs and clinical research initiatives are maintaining high standards for sensor technology utilization and patient safety monitoring.

Germany Anchors Growth with Established Healthcare Infrastructure

Revenue from ingestible sensors in Germany is projected to grow at a CAGR of 3.6% through 2035, supported by the country's well-established healthcare infrastructure, comprehensive healthcare coverage, and systematic approach to digital health monitoring. German healthcare providers emphasize evidence-based sensor technology utilization within structured healthcare frameworks that prioritize clinical effectiveness and patient safety.

  • Comprehensive healthcare system coordination and regulatory oversight are supporting stable utilization of sensor technologies across diverse healthcare settings and patient populations.
  • Academic medical centers and research institutions are maintaining leadership in sensor technology clinical research and monitoring protocol development for optimal patient outcomes.

France Maintains Steady Market Development with Integrated Healthcare Approach

Revenue from ingestible sensors in France is projected to grow at a CAGR of 4.8% through 2035, supported by the country's comprehensive healthcare system, established medical care infrastructure, and systematic approach to digital health monitoring. French healthcare providers emphasize evidence-based sensor technology utilization within integrated care frameworks that prioritize patient outcomes and monitoring continuity.
  • Centralized healthcare system coordination and comprehensive technology coverage are supporting stable access to sensor technologies across diverse patient populations and healthcare settings.
  • Academic medical centers and clinical research institutions are maintaining leadership in sensor technology research and clinical practice guideline development.

Europe Market Split by Country

Ingestible Sensors Market Europe

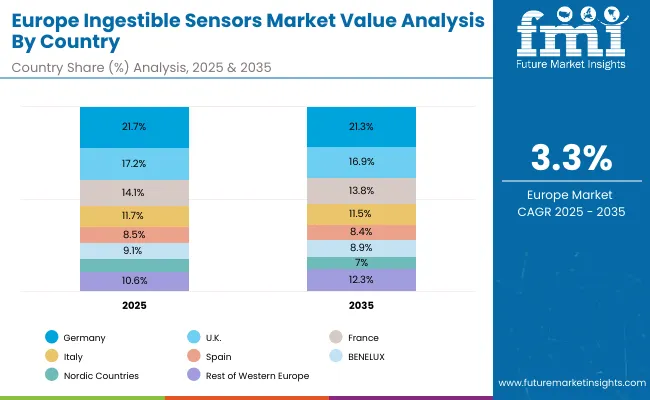
The ingestible sensors market in Europe is projected to expand steadily through 2035, supported by increasing adoption of digital health technologies, rising prevalence of chronic diseases, and ongoing clinical innovation in sensor-based monitoring solutions. Germany will continue to lead the regional market, accounting for 21.7% in 2025 and declining slightly to 21.3% by 2035, supported by a strong clinical research base, reimbursement pathways, and robust healthcare infrastructure. The United Kingdom follows with 17.2% in 2025, decreasing to 16.9% by 2035, driven by NHS adoption of advanced monitoring guidelines, digital health integration, and broadening specialist networks.

France holds 14.1% in 2025, declining to 13.8% by 2035 as other markets expand sensor technology adoption and demand grows for personalized monitoring solutions. Italy contributes 11.7% in 2025, decreasing to 11.5% by 2035, supported by regional healthcare programs and growing clinical research participation. Spain represents 8.5% in 2025, declining to 8.4% by 2035, underpinned by strengthening access to digital health services and patient monitoring programs.

BENELUX markets together account for 9.1% in 2025, moving to 8.9% by 2035, supported by innovation-friendly regulatory frameworks and academic-industry collaboration. The Nordic countries represent 7.1% in 2025, declining to 7.0% by 2035, with demand fueled by progressive healthcare systems and early adoption of evidence-based digital health solutions. The Rest of Western Europe increases from 10.6% in 2025 to 12.3% by 2035, as emerging markets capture greater share of investment, clinical trials, and adoption of sensor technology protocols.
Japan Segmental Share by Country

Ingestible Sensors Market Japan

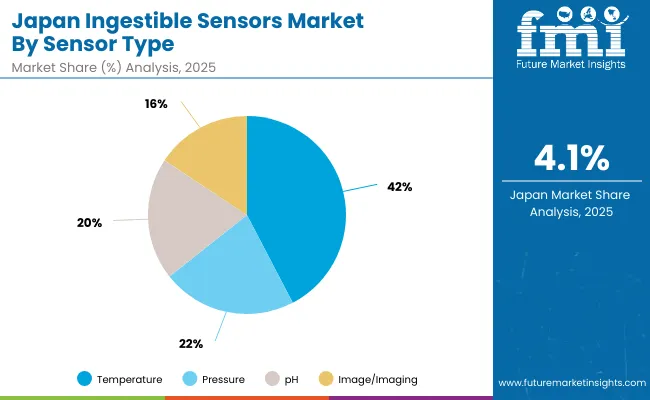
The ingestible sensors market in Japan is set to remain diversified across several sensor technologies in 2025, reflecting clinical preferences in digital health practice and evolving monitoring patterns. Temperature sensors dominate with a 42.4% share in 2025, supported by their central role in managing chronic conditions, infection monitoring, and physiological assessment within healthcare facilities.

Pressure sensors represent 22.0% in 2025, gaining traction from clinical applications targeting cardiovascular monitoring and gastrointestinal diagnostics. pH sensors hold 20.0%, sustained by their widespread use for gastrointestinal health assessment and metabolic monitoring applications.

Meanwhile, Image/Imaging sensors account for 15.7%, driven by advanced diagnostic applications and comprehensive internal imaging capabilities for complex medical assessments. This distribution reflects the growing role of multi-parameter monitoring and comprehensive diagnostic approaches entering clinical practice in Japanese healthcare systems.
South Korea Segmental Share by Country

Ingestible Sensors Market South Korea

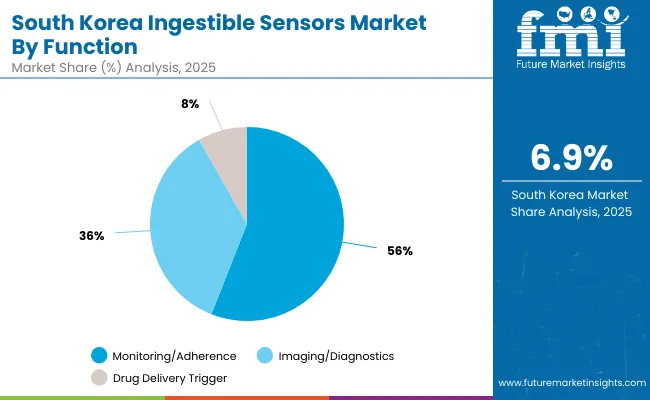
The ingestible sensors market in South Korea in 2025 is shaped by strong demand across core monitoring functions, reflecting both clinical prevalence and healthcare guidelines. Monitoring/Adherence applications account for the largest share at 56.0%, supported by high rates of chronic disease management, medication compliance initiatives, and increasing integration of digital health technologies to address treatment adherence challenges.

Imaging/Diagnostics follows with 35.8%, driven by the rising demand for non-invasive diagnostic solutions, heightened medical imaging awareness, and wider adoption of advanced sensor-based diagnostic protocols. Drug Delivery Trigger applications contribute 8.2%, supported by the established use of controlled release systems in medication management and growing integration of sensor technologies with therapeutic delivery systems.

This distribution reflects the growing emphasis on comprehensive patient monitoring and the expanding role of sensor technologies in both diagnostic and therapeutic applications within South Korea's healthcare system.
Competitive Landscape of Ingestible Sensors Market

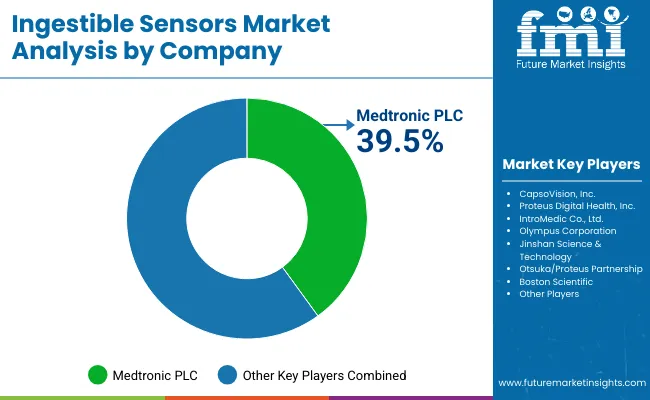
Ingestible Sensors Market By Company

The ingestible sensors market is characterized by competition among established medical technology companies, specialty sensor manufacturers, and digital health focused firms. Companies are investing in sensor miniaturization, wireless communication technologies, regulatory compliance, and healthcare provider partnerships to deliver effective, safe, and accessible sensor solutions. Product development, clinical validation, and market access strategies are central to strengthening product portfolios and market presence.

Medtronic PLC leads the market with 39.5% global value share, offering clinically-proven ingestible sensor technologies with a focus on reliability and patient safety. Other players collectively account for 60.5% market share, including CapsoVision Inc., which provides comprehensive capsule endoscopy and imaging sensor products with emphasis on diagnostic accuracy. 

Olympus Corporation operates with focus on bringing innovative sensor technologies to established endoscopy and diagnostic markets. Jinshan Science & Technology provides comprehensive sensor portfolios including monitoring products across multiple therapeutic areas. Boston Scientific provides sensor technologies and specialized devices to enhance market accessibility and patient access to essential monitoring capabilities.

Global Ingestible Sensors Market - Stakeholder Contribution Framework

Ingestible sensors are emerging as a transformative digital health technology with strong applications in medication adherence monitoring, chronic disease management, gastrointestinal diagnostics, and remote patient care. The market's advantages - non-invasive monitoring capabilities, real-time physiological data collection, and integration with digital health platforms - make ingestible sensors attractive to healthcare providers, pharmaceutical companies, and patients seeking alternatives to traditional monitoring methods. Scaling ingestible sensor commercialization requires coordinated action across regulatory agencies, clinical standards organizations, technology innovators, healthcare systems, and capital providers.

How Governments Could Accelerate Adoption and Market Access?

  • Regulatory Streamlining: Establish clear, expedited approval pathways for ingestible sensors as medical devices, including harmonized safety standards, biocompatibility requirements, and data privacy protections. Create fast-track designations for sensors addressing critical unmet medical needs like medication adherence in chronic diseases.
  • Healthcare Integration Support: Fund pilot programs integrating ingestible sensors into public health systems, Medicare/Medicaid coverage pathways, and chronic disease management protocols. Invest in healthcare provider training on sensor deployment, data interpretation, and patient counseling for optimal outcomes.
  • Digital Health Infrastructure: Develop secure, interoperable health data networks that support real-time sensor data transmission, storage, and analysis while ensuring patient privacy compliance under HIPAA and similar regulations.
  • Research & Clinical Validation: Support large-scale clinical trials demonstrating sensor efficacy in improving medication adherence, reducing hospital readmissions, and enhancing chronic disease outcomes. Fund academic research into sensor miniaturization, power management, and biocompatible materials.
  • Reimbursement Frameworks: Create evidence-based reimbursement models that compensate healthcare providers for sensor-based monitoring services, recognizing demonstrated improvements in patient outcomes and healthcare cost reductions.

How Industry Bodies Could Support Market Development?

  • Clinical Standards & Guidelines: Develop standardized protocols for sensor deployment, data collection intervals, alert thresholds, and clinical response procedures. Establish best practices for integrating sensor data with electronic health records and clinical decision support systems.
  • Safety & Quality Assurance: Define comprehensive safety monitoring frameworks addressing device malfunction, patient adverse events, and long-term biocompatibility. Create quality metrics for sensor accuracy, reliability, and patient acceptance rates.
  • Professional Education: Implement continuing medical education programs training physicians, nurses, and pharmacists on appropriate sensor selection, patient counseling, and clinical data interpretation for optimal therapeutic outcomes.
  • Evidence Development: Coordinate multi-site clinical studies demonstrating sensor effectiveness across diverse patient populations, disease conditions, and healthcare settings. Publish clinical guidelines supporting evidence-based sensor utilization.
  • Interoperability Standards: Establish technical standards ensuring sensor data compatibility across different healthcare IT systems, telemedicine platforms, and patient monitoring networks.

How OEMs and Technology Players Could Strengthen the Ecosystem?

  • Sensor Miniaturization & Integration: Develop next-generation sensors combining multiple monitoring parameters (temperature, pH, pressure, imaging) in single ingestible devices while maintaining patient comfort and safety profiles.
  • Wireless Communication Enhancement: Advance low-power wireless technologies enabling reliable data transmission from internal body environments to external monitoring systems, including improved signal strength and battery life optimization.
  • AI-Powered Analytics: Integrate machine learning algorithms that analyze sensor data patterns, predict health complications, generate automated alerts, and provide personalized treatment recommendations for healthcare providers.
  • Manufacturing Scale-Up: Establish automated production lines capable of producing sensors at scale while maintaining strict quality control, sterility requirements, and cost-effectiveness for broad market adoption.
  • Platform Integration: Develop comprehensive software platforms connecting sensors with telemedicine systems, mobile health apps, and hospital information systems for seamless clinical workflow integration.

How Healthcare Systems and Suppliers Could Navigate Implementation?

  • Clinical Workflow Integration: Design sensor programs that integrate smoothly with existing clinical protocols, electronic health records, and care team communications without disrupting established healthcare delivery patterns.
  • Patient Education & Support: Develop comprehensive patient education materials, support hotlines, and digital resources helping patients understand sensor benefits, usage protocols, and data interpretation for improved adherence and outcomes.
  • Outcome Tracking & Analytics: Implement robust data collection systems measuring clinical outcomes, patient satisfaction, cost savings, and quality metrics to demonstrate sensor program value to administrators and payers.
  • Care Team Training: Provide extensive training for physicians, nurses, and support staff on sensor technology, patient counseling, troubleshooting, and clinical response protocols for optimal program success.
  • Risk Management: Establish comprehensive patient screening protocols, adverse event reporting systems, and emergency response procedures addressing potential sensor complications or device malfunctions.

How Investors and Financial Enablers Could Unlock Value?

  • Technology Innovation Funding: Support startups developing breakthrough sensor technologies, including novel biocompatible materials, advanced miniaturization techniques, and AI-powered health analytics platforms addressing unmet clinical needs.
  • Clinical Trial Investment: Finance large-scale, multi-year clinical studies required for regulatory approval and market acceptance, particularly for sensors targeting high-value therapeutic areas like cardiovascular disease and diabetes management.
  • Healthcare System Partnerships: Fund partnerships between technology companies and health systems implementing sensor programs, sharing financial risks and returns based on demonstrated improvements in patient outcomes and cost savings.
  • Manufacturing Infrastructure: Invest in specialized manufacturing facilities meeting medical device quality standards, regulatory compliance requirements, and production scalability needed for global market penetration.
  • Market Access & Distribution: Support companies building comprehensive distribution networks, healthcare provider relationships, and patient access programs ensuring sensor technologies reach target populations effectively and affordably.

Key Players in the Ingestible Sensors Market

  • Medtronic PLC
  • CapsoVision, Inc.
  • IntroMedic Co., Ltd.
  • Olympus Corporation
  • Jinshan Science & Technology
  • Boston Scientific

Scope of the Report

Items Values
Quantitative Units (2025) USD 983.6 Million
Sensor Type Temperature, Pressure, pH, Image/Imaging
Function Monitoring/Adherence, Imaging/Diagnostics, Drug Delivery Trigger
End Use Healthcare, Sports/Fitness, Military, Other End Use
Regions Covered North America, Europe, East Asia, South Asia & Pacific, Latin America, Middle East & Africa
Countries Covered United States, Canada, United Kingdom, Germany, France, China, Japan, South Korea, India, Brazil, Australia and 40+ countries
Key Companies Profiled Medtronic PLC, CapsoVision Inc., IntroMedic Co. Ltd., Olympus Corporation, Jinshan Science & Technology, Boston Scientific
Additional Attributes Dollar sales by sensor type and monitoring function, regional demand trends, competitive landscape, healthcare provider preferences for specific sensor technologies, integration with digital health platforms, innovations in wireless communication capabilities, patient compliance monitoring, and clinical outcome optimization

Ingestible Sensors Market by Segments

By Sensor Type:

  • Temperature
  • Pressure
  • pH
  • Image/Imaging

By Function:

  • Monitoring/Adherence
  • Imaging/Diagnostics
  • Drug Delivery Trigger

By End Use:

  • Healthcare
  • Sports/Fitness
  • Military
  • Other End Use

By Region:

  • North America
  • United States
  • Canada
  • Mexico
  • Europe
  • Germany
  • United Kingdom
  • France
  • Italy
  • Spain
  • Nordic
  • BENELUX
  • Rest of Europe
  • East Asia
  • China
  • Japan
  • South Korea
  • South Asia & Pacific
  • India
  • ASEAN
  • Australia & New Zealand
  • Rest of South Asia & Pacific
  • Latin America
  • Brazil
  • Chile
  • Rest of Latin America
  • Middle East & Africa
  • Kingdom of Saudi Arabia
  • Other GCC Countries
  • Turkiye
  • South Africa
  • Other African Union
  • Rest of Middle East & Africa

Table of Content

  1. Executive Summary
    • Global Market Outlook
    • Demand-side Trends
    • Supply-side Trends
    • Technology Roadmap Analysis
    • Analysis and Recommendations
  2. Market Overview
    • Market Coverage / Taxonomy
    • Market Definition / Scope / Limitations
  3. Market Background
    • Market Dynamics
      • Drivers
      • Restraints
      • Opportunity
      • Trends
    • Scenario Forecast
      • Demand in Optimistic Scenario
      • Demand in Likely Scenario
      • Demand in Conservative Scenario
    • Opportunity Map Analysis
    • Product Life Cycle Analysis
    • Supply Chain Analysis
      • Supply Side Participants and their Roles
        • Producers
        • Mid-Level Participants (Traders/ Agents/ Brokers)
        • Wholesalers and Distributors
      • Value Added and Value Created at Node in the Supply Chain
      • List of Raw Material Suppliers
      • List of Existing and Potential Buyer's
    • Investment Feasibility Matrix
    • Value Chain Analysis
      • Profit Margin Analysis
      • Wholesalers and Distributors
      • Retailers
    • PESTLE and Porter's Analysis
    • Regulatory Landscape
      • By Key Regions
      • By Key Countries
    • Regional Parent Market Outlook
    • Production and Consumption Statistics
    • Import and Export Statistics
  4. Global Market Analysis 2020 to 2024 and Forecast, 2025 to 2035
    • Historical Market Size Value (USD Million) & Volume (Units) Analysis, 2020 to 2024
    • Current and Future Market Size Value (USD Million) & Volume (Units) Projections, 2025 to 2035
      • Y-o-Y Growth Trend Analysis
      • Absolute $ Opportunity Analysis
  5. Global Market Pricing Analysis 2020 to 2024 and Forecast 2025 to 2035
  6. Global Market Analysis 2020 to 2024 and Forecast 2025 to 2035, By Sensor Type
    • Introduction / Key Findings
    • Historical Market Size Value (USD Million) & Volume (Units) Analysis By Sensor Type, 2020 to 2024
    • Current and Future Market Size Value (USD Million) & Volume (Units) Analysis and Forecast By Sensor Type, 2025 to 2035
      • Temperature
      • Pressure
      • pH
      • Image/Imaging
    • Y-o-Y Growth Trend Analysis By Sensor Type, 2020 to 2024
    • Absolute $ Opportunity Analysis By Sensor Type, 2025 to 2035
  7. Global Market Analysis 2020 to 2024 and Forecast 2025 to 2035, By Function
    • Introduction / Key Findings
    • Historical Market Size Value (USD Million) & Volume (Units) Analysis By Function, 2020 to 2024
    • Current and Future Market Size Value (USD Million) & Volume (Units) Analysis and Forecast By Function, 2025 to 2035
      • Monitoring/Adherence
      • Imaging/Diagnostics
      • Drug Delivery Trigger
    • Y-o-Y Growth Trend Analysis By Function, 2020 to 2024
    • Absolute $ Opportunity Analysis By Function, 2025 to 2035
  8. Global Market Analysis 2020 to 2024 and Forecast 2025 to 2035, By End Use
    • Introduction / Key Findings
    • Historical Market Size Value (USD Million) & Volume (Units) Analysis By End Use, 2020 to 2024
    • Current and Future Market Size Value (USD Million) & Volume (Units) Analysis and Forecast By End Use, 2025 to 2035
      • Healthcare
      • Sports/Fitness
      • Military
      • Other End Use
    • Y-o-Y Growth Trend Analysis By End Use, 2020 to 2024
    • Absolute $ Opportunity Analysis By End Use, 2025 to 2035
  9. Global Market Analysis 2020 to 2024 and Forecast 2025 to 2035, By Region
    • Introduction
    • Historical Market Size Value (USD Million) & Volume (Units) Analysis By Region, 2020 to 2024
    • Current Market Size Value (USD Million) & Volume (Units) Analysis and Forecast By Region, 2025 to 2035
      • North America
      • Latin America
      • East Asia
      • South Asia & Pacific
      • Western Europe
      • Eastern Europe
      • Middle East & Africa
    • Market Attractiveness Analysis By Region
  10. North America Market Analysis 2020 to 2024 and Forecast 2025 to 2035, By Country
    • Historical Market Size Value (USD Million) & Volume (Units) Trend Analysis By Market Taxonomy, 2020 to 2024
    • Market Size Value (USD Million) & Volume (Units) Forecast By Market Taxonomy, 2025 to 2035
      • By Country
        • USA
        • Canada
        • Mexico
      • By Sensor Type
      • By Function
      • By End Use
    • Market Attractiveness Analysis
      • By Country
      • By Sensor Type
      • By Function
      • By End Use
    • Key Takeaways
  11. Latin America Market Analysis 2020 to 2024 and Forecast 2025 to 2035, By Country
    • Historical Market Size Value (USD Million) & Volume (Units) Trend Analysis By Market Taxonomy, 2020 to 2024
    • Market Size Value (USD Million) & Volume (Units) Forecast By Market Taxonomy, 2025 to 2035
      • By Country
        • Brazil
        • Argentina
        • Rest of Latin America
      • By Sensor Type
      • By Function
      • By End Use
    • Market Attractiveness Analysis
      • By Country
      • By Sensor Type
      • By Function
      • By End Use
    • Key Takeaways
  12. East Asia Market Analysis 2020 to 2024 and Forecast 2025 to 2035, By Country
    • Historical Market Size Value (USD Million) & Volume (Units) Trend Analysis By Market Taxonomy, 2020 to 2024
    • Market Size Value (USD Million) & Volume (Units) Forecast By Market Taxonomy, 2025 to 2035
      • By Country
        • China
        • Japan
        • South Korea
      • By Sensor Type
      • By Function
      • By End Use
    • Market Attractiveness Analysis
      • By Country
      • By Sensor Type
      • By Function
      • By End Use
    • Key Takeaways
  13. South Asia & Pacific Market Analysis 2020 to 2024 and Forecast 2025 to 2035, By Country
    • Historical Market Size Value (USD Million) & Volume (Units) Trend Analysis By Market Taxonomy, 2020 to 2024
    • Market Size Value (USD Million) & Volume (Units) Forecast By Market Taxonomy, 2025 to 2035
      • By Country
        • India
        • ASEAN Countries
        • Australia & New Zealand
        • Rest of South Asia
      • By Sensor Type
      • By Function
      • By End Use
    • Market Attractiveness Analysis
      • By Country
      • By Sensor Type
      • By Function
      • By End Use
    • Key Takeaways
  14. Western Europe Market Analysis 2020 to 2024 and Forecast 2025 to 2035, By Country
    • Historical Market Size Value (USD Million) & Volume (Units) Trend Analysis By Market Taxonomy, 2020 to 2024
    • Market Size Value (USD Million) & Volume (Units) Forecast By Market Taxonomy, 2025 to 2035
      • By Country
        • Germany
        • UK
        • France
        • Italy
        • Spain
        • BENELUX
        • Nordic Countries
        • Rest of Western Europe
      • By Sensor Type
      • By Function
      • By End Use
    • Market Attractiveness Analysis
      • By Country
      • By Sensor Type
      • By Function
      • By End Use
    • Key Takeaways
  15. Eastern Europe Market Analysis 2020 to 2024 and Forecast 2025 to 2035, By Country
    • Historical Market Size Value (USD Million) & Volume (Units) Trend Analysis By Market Taxonomy, 2020 to 2024
    • Market Size Value (USD Million) & Volume (Units) Forecast By Market Taxonomy, 2025 to 2035
      • By Country
        • Russia
        • Hungary
        • Poland
        • Rest of Eastern Europe
      • By Sensor Type
      • By Function
      • By End Use
    • Market Attractiveness Analysis
      • By Country
      • By Sensor Type
      • By Function
      • By End Use
    • Key Takeaways
  16. Middle East & Africa Market Analysis 2020 to 2024 and Forecast 2025 to 2035, By Country
    • Historical Market Size Value (USD Million) & Volume (Units) Trend Analysis By Market Taxonomy, 2020 to 2024
    • Market Size Value (USD Million) & Volume (Units) Forecast By Market Taxonomy, 2025 to 2035
      • By Country
        • Saudi Arabia
        • Türkiye
        • South Africa
        • Other African Union
        • Rest of Middle East & Africa
      • By Sensor Type
      • By Function
      • By End Use
    • Market Attractiveness Analysis
      • By Country
      • By Sensor Type
      • By Function
      • By End Use
    • Key Takeaways
  17. Key Countries Market Analysis
    • USA
      • Pricing Analysis
      • Market Share Analysis, 2024
        • By Sensor Type
        • By Function
        • By End Use
    • Brazil
      • Pricing Analysis
      • Market Share Analysis, 2024
        • By Sensor Type
        • By Function
        • By End Use
    • China
      • Pricing Analysis
      • Market Share Analysis, 2024
        • By Sensor Type
        • By Function
        • By End Use
    • India
      • Pricing Analysis
      • Market Share Analysis, 2024
        • By Sensor Type
        • By Function
        • By End Use
    • Japan
      • Pricing Analysis
      • Market Share Analysis, 2024
        • By Sensor Type
        • By Function
        • By End Use
    • Germany
      • Pricing Analysis
      • Market Share Analysis, 2024
        • By Sensor Type
        • By Function
        • By End Use
    • France
      • Pricing Analysis
      • Market Share Analysis, 2024
        • By Sensor Type
        • By Function
        • By End Use
    • UK
      • Pricing Analysis
      • Market Share Analysis, 2024
        • By Sensor Type
        • By Function
        • By End Use
  18. Market Structure Analysis
    • Competition Dashboard
    • Competition Benchmarking
    • Market Share Analysis of Top Players
      • By Regional
      • By Sensor Type
      • By Function
      • By End Use
  19. Competition Analysis
    • Competition Deep Dive
      • Medtronic PLC
        • Overview
        • Product Portfolio
        • Profitability by Market Segments (Product/Age/Sales Channel/Region)
        • Sales Footprint
        • Strategy Overview
          • Marketing Strategy
          • Product Strategy
          • Channel Strategy
      • CapsoVision, Inc.
        • Overview
        • Product Portfolio
        • Profitability by Market Segments (Product/Age/Sales Channel/Region)
        • Sales Footprint
        • Strategy Overview
          • Marketing Strategy
          • Product Strategy
          • Channel Strategy
      • IntroMedic Co., Ltd.
        • Overview
        • Product Portfolio
        • Profitability by Market Segments (Product/Age/Sales Channel/Region)
        • Sales Footprint
        • Strategy Overview
          • Marketing Strategy
          • Product Strategy
          • Channel Strategy
      • Olympus Corporation
        • Overview
        • Product Portfolio
        • Profitability by Market Segments (Product/Age/Sales Channel/Region)
        • Sales Footprint
        • Strategy Overview
          • Marketing Strategy
          • Product Strategy
          • Channel Strategy
      • Jinshan Science & Technology
        • Overview
        • Product Portfolio
        • Profitability by Market Segments (Product/Age/Sales Channel/Region)
        • Sales Footprint
        • Strategy Overview
          • Marketing Strategy
          • Product Strategy
          • Channel Strategy
      •  
      • Boston Scientific
        • Overview
        • Product Portfolio
        • Profitability by Market Segments (Product/Age/Sales Channel/Region)
        • Sales Footprint
        • Strategy Overview
          • Marketing Strategy
          • Product Strategy
          • Channel Strategy
  20. Assumptions & Acronyms Used
  21. Research Methodology

List of Tables

  • Table 1: Global Market Value (USD Million) Forecast by Region, 2020-2035
  • Table 2: Global Market Volume (Units) Forecast by Region, 2020-2035
  • Table 3: Global Market Value (USD Million) Forecast by Sensor Type, 2020-2035
  • Table 4: Global Market Volume (Units) Forecast by Sensor Type, 2020-2035
  • Table 5: Global Market Value (USD Million) Forecast by Function, 2020-2035
  • Table 6: Global Market Volume (Units) Forecast by Function, 2020-2035
  • Table 7: Global Market Value (USD Million) Forecast by End Use, 2020-2035
  • Table 8: Global Market Volume (Units) Forecast by End Use, 2020-2035
  • Table 9: North America Market Value (USD Million) Forecast by Country, 2020-2035
  • Table 10: North America Market Volume (Units) Forecast by Country, 2020-2035
  • Table 11: North America Market Value (USD Million) Forecast by Sensor Type, 2020-2035
  • Table 12: North America Market Volume (Units) Forecast by Sensor Type, 2020-2035
  • Table 13: North America Market Value (USD Million) Forecast by Function, 2020-2035
  • Table 14: North America Market Volume (Units) Forecast by Function, 2020-2035
  • Table 15: North America Market Value (USD Million) Forecast by End Use, 2020-2035
  • Table 16: North America Market Volume (Units) Forecast by End Use, 2020-2035
  • Table 17: Latin America Market Value (USD Million) Forecast by Country, 2020-2035
  • Table 18: Latin America Market Volume (Units) Forecast by Country, 2020-2035
  • Table 19: Latin America Market Value (USD Million) Forecast by Sensor Type, 2020-2035
  • Table 20: Latin America Market Volume (Units) Forecast by Sensor Type, 2020-2035
  • Table 21: Latin America Market Value (USD Million) Forecast by Function, 2020-2035
  • Table 22: Latin America Market Volume (Units) Forecast by Function, 2020-2035
  • Table 23: Latin America Market Value (USD Million) Forecast by End Use, 2020-2035
  • Table 24: Latin America Market Volume (Units) Forecast by End Use, 2020-2035
  • Table 25: East Asia Market Value (USD Million) Forecast by Country, 2020-2035
  • Table 26: East Asia Market Volume (Units) Forecast by Country, 2020-2035
  • Table 27: East Asia Market Value (USD Million) Forecast by Sensor Type, 2020-2035
  • Table 28: East Asia Market Volume (Units) Forecast by Sensor Type, 2020-2035
  • Table 29: East Asia Market Value (USD Million) Forecast by Function, 2020-2035
  • Table 30: East Asia Market Volume (Units) Forecast by Function, 2020-2035
  • Table 31: East Asia Market Value (USD Million) Forecast by End Use, 2020-2035
  • Table 32: East Asia Market Volume (Units) Forecast by End Use, 2020-2035
  • Table 33: South Asia & Pacific Market Value (USD Million) Forecast by Country, 2020-2035
  • Table 34: South Asia & Pacific Market Volume (Units) Forecast by Country, 2020-2035
  • Table 35: South Asia & Pacific Market Value (USD Million) Forecast by Sensor Type, 2020-2035
  • Table 36: South Asia & Pacific Market Volume (Units) Forecast by Sensor Type, 2020-2035
  • Table 37: South Asia & Pacific Market Value (USD Million) Forecast by Function, 2020-2035
  • Table 38: South Asia & Pacific Market Volume (Units) Forecast by Function, 2020-2035
  • Table 39: South Asia & Pacific Market Value (USD Million) Forecast by End Use, 2020-2035
  • Table 40: South Asia & Pacific Market Volume (Units) Forecast by End Use, 2020-2035
  • Table 41: Western Europe Market Value (USD Million) Forecast by Country, 2020-2035
  • Table 42: Western Europe Market Volume (Units) Forecast by Country, 2020-2035
  • Table 43: Western Europe Market Value (USD Million) Forecast by Sensor Type, 2020-2035
  • Table 44: Western Europe Market Volume (Units) Forecast by Sensor Type, 2020-2035
  • Table 45: Western Europe Market Value (USD Million) Forecast by Function, 2020-2035
  • Table 46: Western Europe Market Volume (Units) Forecast by Function, 2020-2035
  • Table 47: Western Europe Market Value (USD Million) Forecast by End Use, 2020-2035
  • Table 48: Western Europe Market Volume (Units) Forecast by End Use, 2020-2035
  • Table 49: Eastern Europe Market Value (USD Million) Forecast by Country, 2020-2035
  • Table 50: Eastern Europe Market Volume (Units) Forecast by Country, 2020-2035
  • Table 51: Eastern Europe Market Value (USD Million) Forecast by Sensor Type, 2020-2035
  • Table 52: Eastern Europe Market Volume (Units) Forecast by Sensor Type, 2020-2035
  • Table 53: Eastern Europe Market Value (USD Million) Forecast by Function, 2020-2035
  • Table 54: Eastern Europe Market Volume (Units) Forecast by Function, 2020-2035
  • Table 55: Eastern Europe Market Value (USD Million) Forecast by End Use, 2020-2035
  • Table 56: Eastern Europe Market Volume (Units) Forecast by End Use, 2020-2035
  • Table 57: Middle East & Africa Market Value (USD Million) Forecast by Country, 2020-2035
  • Table 58: Middle East & Africa Market Volume (Units) Forecast by Country, 2020-2035
  • Table 59: Middle East & Africa Market Value (USD Million) Forecast by Sensor Type, 2020-2035
  • Table 60: Middle East & Africa Market Volume (Units) Forecast by Sensor Type, 2020-2035
  • Table 61: Middle East & Africa Market Value (USD Million) Forecast by Function, 2020-2035
  • Table 62: Middle East & Africa Market Volume (Units) Forecast by Function, 2020-2035
  • Table 63: Middle East & Africa Market Value (USD Million) Forecast by End Use, 2020-2035
  • Table 64: Middle East & Africa Market Volume (Units) Forecast by End Use, 2020-2035
  • Table 65: U.S. Market Value (USD Million) Forecast by Sensor Type, 2020-2035
  • Table 66: U.S. Market Volume (Units) Forecast by Sensor Type, 2020-2035
  • Table 67: U.S. Market Value (USD Million) Forecast by Function, 2020-2035
  • Table 68: U.S. Market Volume (Units) Forecast by Function, 2020-2035
  • Table 69: U.S. Market Value (USD Million) Forecast by End Use, 2020-2035
  • Table 70: U.S. Market Volume (Units) Forecast by End Use, 2020-2035
  • Table 71: Canada Market Value (USD Million) Forecast by Sensor Type, 2020-2035
  • Table 72: Canada Market Volume (Units) Forecast by Sensor Type, 2020-2035
  • Table 73: Canada Market Value (USD Million) Forecast by Function, 2020-2035
  • Table 74: Canada Market Volume (Units) Forecast by Function, 2020-2035
  • Table 75: Canada Market Value (USD Million) Forecast by End Use, 2020-2035
  • Table 76: Canada Market Volume (Units) Forecast by End Use, 2020-2035
  • Table 77: Mexico Market Value (USD Million) Forecast by Sensor Type, 2020-2035
  • Table 78: Mexico Market Volume (Units) Forecast by Sensor Type, 2020-2035
  • Table 79: Mexico Market Value (USD Million) Forecast by Function, 2020-2035
  • Table 80: Mexico Market Volume (Units) Forecast by Function, 2020-2035
  • Table 81: Mexico Market Value (USD Million) Forecast by End Use, 2020-2035
  • Table 82: Mexico Market Volume (Units) Forecast by End Use, 2020-2035
  • Table 83: Brazil Market Value (USD Million) Forecast by Sensor Type, 2020-2035
  • Table 84: Brazil Market Volume (Units) Forecast by Sensor Type, 2020-2035
  • Table 85: Brazil Market Value (USD Million) Forecast by Function, 2020-2035
  • Table 86: Brazil Market Volume (Units) Forecast by Function, 2020-2035
  • Table 87: Brazil Market Value (USD Million) Forecast by End Use, 2020-2035
  • Table 88: Brazil Market Volume (Units) Forecast by End Use, 2020-2035
  • Table 89: Argentina Market Value (USD Million) Forecast by Sensor Type, 2020-2035
  • Table 90: Argentina Market Volume (Units) Forecast by Sensor Type, 2020-2035
  • Table 91: Argentina Market Value (USD Million) Forecast by Function, 2020-2035
  • Table 92: Argentina Market Volume (Units) Forecast by Function, 2020-2035
  • Table 93: Argentina Market Value (USD Million) Forecast by End Use, 2020-2035
  • Table 94: Argentina Market Volume (Units) Forecast by End Use, 2020-2035
  • Table 95: China Market Value (USD Million) Forecast by Sensor Type, 2020-2035
  • Table 96: China Market Volume (Units) Forecast by Sensor Type, 2020-2035
  • Table 97: China Market Value (USD Million) Forecast by Function, 2020-2035
  • Table 98: China Market Volume (Units) Forecast by Function, 2020-2035
  • Table 99: China Market Value (USD Million) Forecast by End Use, 2020-2035
  • Table 100: China Market Volume (Units) Forecast by End Use, 2020-2035
  • Table 101: Japan Market Value (USD Million) Forecast by Sensor Type, 2020-2035
  • Table 102: Japan Market Volume (Units) Forecast by Sensor Type, 2020-2035
  • Table 103: Japan Market Value (USD Million) Forecast by Function, 2020-2035
  • Table 104: Japan Market Volume (Units) Forecast by Function, 2020-2035
  • Table 105: Japan Market Value (USD Million) Forecast by End Use, 2020-2035
  • Table 106: Japan Market Volume (Units) Forecast by End Use, 2020-2035
  • Table 107: South Korea Market Value (USD Million) Forecast by Sensor Type, 2020-2035
  • Table 108: South Korea Market Volume (Units) Forecast by Sensor Type, 2020-2035
  • Table 109: South Korea Market Value (USD Million) Forecast by Function, 2020-2035
  • Table 110: South Korea Market Volume (Units) Forecast by Function, 2020-2035
  • Table 111: South Korea Market Value (USD Million) Forecast by End Use, 2020-2035
  • Table 112: South Korea Market Volume (Units) Forecast by End Use, 2020-2035
  • Table 113: India Market Value (USD Million) Forecast by Sensor Type, 2020-2035
  • Table 114: India Market Volume (Units) Forecast by Sensor Type, 2020-2035
  • Table 115: India Market Value (USD Million) Forecast by Function, 2020-2035
  • Table 116: India Market Volume (Units) Forecast by Function, 2020-2035
  • Table 117: India Market Value (USD Million) Forecast by End Use, 2020-2035
  • Table 118: India Market Volume (Units) Forecast by End Use, 2020-2035
  • Table 119: ASEAN Countries Market Value (USD Million) Forecast by Sensor Type, 2020-2035
  • Table 120: ASEAN Countries Market Volume (Units) Forecast by Sensor Type, 2020-2035
  • Table 121: ASEAN Countries Market Value (USD Million) Forecast by Function, 2020-2035
  • Table 122: ASEAN Countries Market Volume (Units) Forecast by Function, 2020-2035
  • Table 123: ASEAN Countries Market Value (USD Million) Forecast by End Use, 2020-2035
  • Table 124: ASEAN Countries Market Volume (Units) Forecast by End Use, 2020-2035
  • Table 125: Australia & New Zealand Market Value (USD Million) Forecast by Sensor Type, 2020-2035
  • Table 126: Australia & New Zealand Market Volume (Units) Forecast by Sensor Type, 2020-2035
  • Table 127: Australia & New Zealand Market Value (USD Million) Forecast by Function, 2020-2035
  • Table 128: Australia & New Zealand Market Volume (Units) Forecast by Function, 2020-2035
  • Table 129: Australia & New Zealand Market Value (USD Million) Forecast by End Use, 2020-2035
  • Table 130: Australia & New Zealand Market Volume (Units) Forecast by End Use, 2020-2035
  • Table 131: Germany Market Value (USD Million) Forecast by Sensor Type, 2020-2035
  • Table 132: Germany Market Volume (Units) Forecast by Sensor Type, 2020-2035
  • Table 133: Germany Market Value (USD Million) Forecast by Function, 2020-2035
  • Table 134: Germany Market Volume (Units) Forecast by Function, 2020-2035
  • Table 135: Germany Market Value (USD Million) Forecast by End Use, 2020-2035
  • Table 136: Germany Market Volume (Units) Forecast by End Use, 2020-2035
  • Table 137: U.K. Market Value (USD Million) Forecast by Sensor Type, 2020-2035
  • Table 138: U.K. Market Volume (Units) Forecast by Sensor Type, 2020-2035
  • Table 139: U.K. Market Value (USD Million) Forecast by Function, 2020-2035
  • Table 140: U.K. Market Volume (Units) Forecast by Function, 2020-2035
  • Table 141: U.K. Market Value (USD Million) Forecast by End Use, 2020-2035
  • Table 142: U.K. Market Volume (Units) Forecast by End Use, 2020-2035
  • Table 143: France Market Value (USD Million) Forecast by Sensor Type, 2020-2035
  • Table 144: France Market Volume (Units) Forecast by Sensor Type, 2020-2035
  • Table 145: France Market Value (USD Million) Forecast by Function, 2020-2035
  • Table 146: France Market Volume (Units) Forecast by Function, 2020-2035
  • Table 147: France Market Value (USD Million) Forecast by End Use, 2020-2035
  • Table 148: France Market Volume (Units) Forecast by End Use, 2020-2035
  • Table 149: Italy Market Value (USD Million) Forecast by Sensor Type, 2020-2035
  • Table 150: Italy Market Volume (Units) Forecast by Sensor Type, 2020-2035
  • Table 151: Italy Market Value (USD Million) Forecast by Function, 2020-2035
  • Table 152: Italy Market Volume (Units) Forecast by Function, 2020-2035
  • Table 153: Italy Market Value (USD Million) Forecast by End Use, 2020-2035
  • Table 154: Italy Market Volume (Units) Forecast by End Use, 2020-2035

List of Figures

  • Figure 1: Global Market Value (USD Million) by Sensor Type, 2025-2035
  • Figure 2: Global Market Value (USD Million) by Function, 2025-2035
  • Figure 3: Global Market Value (USD Million) by End Use, 2025-2035
  • Figure 4: Global Market Value (USD Million) by Region, 2025-2035
  • Figure 5: Global Market Value (USD Million) Analysis by Region, 2020-2035
  • Figure 6: Global Market Volume (Units) Analysis by Region, 2020-2035
  • Figure 7: Global Market Value Share (%) and BPS Analysis by Region, 2025-2035
  • Figure 8: Global Market Y-o-Y Growth (%) Projections by Region, 2025-2035
  • Figure 9: Global Market Value (USD Million) Analysis by Sensor Type, 2020-2035
  • Figure 10: Global Market Volume (Units) Analysis by Sensor Type, 2020-2035
  • Figure 11: Global Market Value Share (%) and BPS Analysis by Sensor Type, 2025-2035
  • Figure 12: Global Market Y-o-Y Growth (%) Projections by Sensor Type, 2025-2035
  • Figure 13: Global Market Value (USD Million) Analysis by Function, 2020-2035
  • Figure 14: Global Market Volume (Units) Analysis by Function, 2020-2035
  • Figure 15: Global Market Value Share (%) and BPS Analysis by Function, 2025-2035
  • Figure 16: Global Market Y-o-Y Growth (%) Projections by Function, 2025-2035
  • Figure 17: Global Market Value (USD Million) Analysis by End Use, 2020-2035
  • Figure 18: Global Market Volume (Units) Analysis by End Use, 2020-2035
  • Figure 19: Global Market Value Share (%) and BPS Analysis by End Use, 2025-2035
  • Figure 20: Global Market Y-o-Y Growth (%) Projections by End Use, 2025-2035
  • Figure 21: Global Market Attractiveness by Sensor Type, 2025-2035
  • Figure 22: Global Market Attractiveness by Function, 2025-2035
  • Figure 23: Global Market Attractiveness by End Use, 2025-2035
  • Figure 24: Global Market Attractiveness by Region, 2025-2035
  • Figure 25: North America Market Value (USD Million) by Sensor Type, 2025-2035
  • Figure 26: North America Market Value (USD Million) by Function, 2025-2035
  • Figure 27: North America Market Value (USD Million) by End Use, 2025-2035
  • Figure 28: North America Market Value (USD Million) by Country, 2025-2035
  • Figure 29: North America Market Value (USD Million) Analysis by Country, 2020-2035
  • Figure 30: North America Market Volume (Units) Analysis by Country, 2020-2035
  • Figure 31: North America Market Value Share (%) and BPS Analysis by Country, 2025-2035
  • Figure 32: North America Market Y-o-Y Growth (%) Projections by Country, 2025-2035
  • Figure 33: North America Market Value (USD Million) Analysis by Sensor Type, 2020-2035
  • Figure 34: North America Market Volume (Units) Analysis by Sensor Type, 2020-2035
  • Figure 35: North America Market Value Share (%) and BPS Analysis by Sensor Type, 2025-2035
  • Figure 36: North America Market Y-o-Y Growth (%) Projections by Sensor Type, 2025-2035
  • Figure 37: North America Market Value (USD Million) Analysis by Function, 2020-2035
  • Figure 38: North America Market Volume (Units) Analysis by Function, 2020-2035
  • Figure 39: North America Market Value Share (%) and BPS Analysis by Function, 2025-2035
  • Figure 40: North America Market Y-o-Y Growth (%) Projections by Function, 2025-2035
  • Figure 41: North America Market Value (USD Million) Analysis by End Use, 2020-2035
  • Figure 42: North America Market Volume (Units) Analysis by End Use, 2020-2035
  • Figure 43: North America Market Value Share (%) and BPS Analysis by End Use, 2025-2035
  • Figure 44: North America Market Y-o-Y Growth (%) Projections by End Use, 2025-2035
  • Figure 45: North America Market Attractiveness by Sensor Type, 2025-2035
  • Figure 46: North America Market Attractiveness by Function, 2025-2035
  • Figure 47: North America Market Attractiveness by End Use, 2025-2035
  • Figure 48: North America Market Attractiveness by Country, 2025-2035
  • Figure 49: Latin America Market Value (USD Million) by Sensor Type, 2025-2035
  • Figure 50: Latin America Market Value (USD Million) by Function, 2025-2035
  • Figure 51: Latin America Market Value (USD Million) by End Use, 2025-2035
  • Figure 52: Latin America Market Value (USD Million) by Country, 2025-2035
  • Figure 53: Latin America Market Value (USD Million) Analysis by Country, 2020-2035
  • Figure 54: Latin America Market Volume (Units) Analysis by Country, 2020-2035
  • Figure 55: Latin America Market Value Share (%) and BPS Analysis by Country, 2025-2035
  • Figure 56: Latin America Market Y-o-Y Growth (%) Projections by Country, 2025-2035
  • Figure 57: Latin America Market Value (USD Million) Analysis by Sensor Type, 2020-2035
  • Figure 58: Latin America Market Volume (Units) Analysis by Sensor Type, 2020-2035
  • Figure 59: Latin America Market Value Share (%) and BPS Analysis by Sensor Type, 2025-2035
  • Figure 60: Latin America Market Y-o-Y Growth (%) Projections by Sensor Type, 2025-2035
  • Figure 61: Latin America Market Value (USD Million) Analysis by Function, 2020-2035
  • Figure 62: Latin America Market Volume (Units) Analysis by Function, 2020-2035
  • Figure 63: Latin America Market Value Share (%) and BPS Analysis by Function, 2025-2035
  • Figure 64: Latin America Market Y-o-Y Growth (%) Projections by Function, 2025-2035
  • Figure 65: Latin America Market Value (USD Million) Analysis by End Use, 2020-2035
  • Figure 66: Latin America Market Volume (Units) Analysis by End Use, 2020-2035
  • Figure 67: Latin America Market Value Share (%) and BPS Analysis by End Use, 2025-2035
  • Figure 68: Latin America Market Y-o-Y Growth (%) Projections by End Use, 2025-2035
  • Figure 69: Latin America Market Attractiveness by Sensor Type, 2025-2035
  • Figure 70: Latin America Market Attractiveness by Function, 2025-2035
  • Figure 71: Latin America Market Attractiveness by End Use, 2025-2035
  • Figure 72: Latin America Market Attractiveness by Country, 2025-2035
  • Figure 73: East Asia Market Value (USD Million) by Sensor Type, 2025-2035
  • Figure 74: East Asia Market Value (USD Million) by Function, 2025-2035
  • Figure 75: East Asia Market Value (USD Million) by End Use, 2025-2035
  • Figure 76: East Asia Market Value (USD Million) by Country, 2025-2035
  • Figure 77: East Asia Market Value (USD Million) Analysis by Country, 2020-2035
  • Figure 78: East Asia Market Volume (Units) Analysis by Country, 2020-2035
  • Figure 79: East Asia Market Value Share (%) and BPS Analysis by Country, 2025-2035
  • Figure 80: East Asia Market Y-o-Y Growth (%) Projections by Country, 2025-2035
  • Figure 81: East Asia Market Value (USD Million) Analysis by Sensor Type, 2020-2035
  • Figure 82: East Asia Market Volume (Units) Analysis by Sensor Type, 2020-2035
  • Figure 83: East Asia Market Value Share (%) and BPS Analysis by Sensor Type, 2025-2035
  • Figure 84: East Asia Market Y-o-Y Growth (%) Projections by Sensor Type, 2025-2035
  • Figure 85: East Asia Market Value (USD Million) Analysis by Function, 2020-2035
  • Figure 86: East Asia Market Volume (Units) Analysis by Function, 2020-2035
  • Figure 87: East Asia Market Value Share (%) and BPS Analysis by Function, 2025-2035
  • Figure 88: East Asia Market Y-o-Y Growth (%) Projections by Function, 2025-2035
  • Figure 89: East Asia Market Value (USD Million) Analysis by End Use, 2020-2035
  • Figure 90: East Asia Market Volume (Units) Analysis by End Use, 2020-2035
  • Figure 91: East Asia Market Value Share (%) and BPS Analysis by End Use, 2025-2035
  • Figure 92: East Asia Market Y-o-Y Growth (%) Projections by End Use, 2025-2035
  • Figure 93: East Asia Market Attractiveness by Sensor Type, 2025-2035
  • Figure 94: East Asia Market Attractiveness by Function, 2025-2035
  • Figure 95: East Asia Market Attractiveness by End Use, 2025-2035
  • Figure 96: East Asia Market Attractiveness by Country, 2025-2035
  • Figure 97: South Asia & Pacific Market Value (USD Million) by Sensor Type, 2025-2035
  • Figure 98: South Asia & Pacific Market Value (USD Million) by Function, 2025-2035
  • Figure 99: South Asia & Pacific Market Value (USD Million) by End Use, 2025-2035
  • Figure 100: South Asia & Pacific Market Value (USD Million) by Country, 2025-2035
  • Figure 101: South Asia & Pacific Market Value (USD Million) Analysis by Country, 2020-2035
  • Figure 102: South Asia & Pacific Market Volume (Units) Analysis by Country, 2020-2035
  • Figure 103: South Asia & Pacific Market Value Share (%) and BPS Analysis by Country, 2025-2035
  • Figure 104: South Asia & Pacific Market Y-o-Y Growth (%) Projections by Country, 2025-2035
  • Figure 105: South Asia & Pacific Market Value (USD Million) Analysis by Sensor Type, 2020-2035
  • Figure 106: South Asia & Pacific Market Volume (Units) Analysis by Sensor Type, 2020-2035
  • Figure 107: South Asia & Pacific Market Value Share (%) and BPS Analysis by Sensor Type, 2025-2035
  • Figure 108: South Asia & Pacific Market Y-o-Y Growth (%) Projections by Sensor Type, 2025-2035
  • Figure 109: South Asia & Pacific Market Value (USD Million) Analysis by Function, 2020-2035
  • Figure 110: South Asia & Pacific Market Volume (Units) Analysis by Function, 2020-2035
  • Figure 111: South Asia & Pacific Market Value Share (%) and BPS Analysis by Function, 2025-2035
  • Figure 112: South Asia & Pacific Market Y-o-Y Growth (%) Projections by Function, 2025-2035
  • Figure 113: South Asia & Pacific Market Value (USD Million) Analysis by End Use, 2020-2035
  • Figure 114: South Asia & Pacific Market Volume (Units) Analysis by End Use, 2020-2035
  • Figure 115: South Asia & Pacific Market Value Share (%) and BPS Analysis by End Use, 2025-2035
  • Figure 116: South Asia & Pacific Market Y-o-Y Growth (%) Projections by End Use, 2025-2035
  • Figure 117: South Asia & Pacific Market Attractiveness by Sensor Type, 2025-2035
  • Figure 118: South Asia & Pacific Market Attractiveness by Function, 2025-2035
  • Figure 119: South Asia & Pacific Market Attractiveness by End Use, 2025-2035
  • Figure 120: South Asia & Pacific Market Attractiveness by Country, 2025-2035
  • Figure 121: Western Europe Market Value (USD Million) by Sensor Type, 2025-2035
  • Figure 122: Western Europe Market Value (USD Million) by Function, 2025-2035
  • Figure 123: Western Europe Market Value (USD Million) by End Use, 2025-2035
  • Figure 124: Western Europe Market Value (USD Million) by Country, 2025-2035
  • Figure 125: Western Europe Market Value (USD Million) Analysis by Country, 2020-2035
  • Figure 126: Western Europe Market Volume (Units) Analysis by Country, 2020-2035
  • Figure 127: Western Europe Market Value Share (%) and BPS Analysis by Country, 2025-2035
  • Figure 128: Western Europe Market Y-o-Y Growth (%) Projections by Country, 2025-2035
  • Figure 129: Western Europe Market Value (USD Million) Analysis by Sensor Type, 2020-2035
  • Figure 130: Western Europe Market Volume (Units) Analysis by Sensor Type, 2020-2035
  • Figure 131: Western Europe Market Value Share (%) and BPS Analysis by Sensor Type, 2025-2035
  • Figure 132: Western Europe Market Y-o-Y Growth (%) Projections by Sensor Type, 2025-2035
  • Figure 133: Western Europe Market Value (USD Million) Analysis by Function, 2020-2035
  • Figure 134: Western Europe Market Volume (Units) Analysis by Function, 2020-2035
  • Figure 135: Western Europe Market Value Share (%) and BPS Analysis by Function, 2025-2035
  • Figure 136: Western Europe Market Y-o-Y Growth (%) Projections by Function, 2025-2035
  • Figure 137: Western Europe Market Value (USD Million) Analysis by End Use, 2020-2035
  • Figure 138: Western Europe Market Volume (Units) Analysis by End Use, 2020-2035
  • Figure 139: Western Europe Market Value Share (%) and BPS Analysis by End Use, 2025-2035
  • Figure 140: Western Europe Market Y-o-Y Growth (%) Projections by End Use, 2025-2035
  • Figure 141: Western Europe Market Attractiveness by Sensor Type, 2025-2035
  • Figure 142: Western Europe Market Attractiveness by Function, 2025-2035
  • Figure 143: Western Europe Market Attractiveness by End Use, 2025-2035
  • Figure 144: Western Europe Market Attractiveness by Country, 2025-2035
  • Figure 145: Eastern Europe Market Value (USD Million) by Sensor Type, 2025-2035
  • Figure 146: Eastern Europe Market Value (USD Million) by Function, 2025-2035
  • Figure 147: Eastern Europe Market Value (USD Million) by End Use, 2025-2035
  • Figure 148: Eastern Europe Market Value (USD Million) by Country, 2025-2035
  • Figure 149: Eastern Europe Market Value (USD Million) Analysis by Country, 2020-2035
  • Figure 150: Eastern Europe Market Volume (Units) Analysis by Country, 2020-2035
  • Figure 151: Eastern Europe Market Value Share (%) and BPS Analysis by Country, 2025-2035
  • Figure 152: Eastern Europe Market Y-o-Y Growth (%) Projections by Country, 2025-2035
  • Figure 153: Eastern Europe Market Value (USD Million) Analysis by Sensor Type, 2020-2035
  • Figure 154: Eastern Europe Market Volume (Units) Analysis by Sensor Type, 2020-2035
  • Figure 155: Eastern Europe Market Value Share (%) and BPS Analysis by Sensor Type, 2025-2035
  • Figure 156: Eastern Europe Market Y-o-Y Growth (%) Projections by Sensor Type, 2025-2035
  • Figure 157: Eastern Europe Market Value (USD Million) Analysis by Function, 2020-2035
  • Figure 158: Eastern Europe Market Volume (Units) Analysis by Function, 2020-2035
  • Figure 159: Eastern Europe Market Value Share (%) and BPS Analysis by Function, 2025-2035
  • Figure 160: Eastern Europe Market Y-o-Y Growth (%) Projections by Function, 2025-2035
  • Figure 161: Eastern Europe Market Value (USD Million) Analysis by End Use, 2020-2035
  • Figure 162: Eastern Europe Market Volume (Units) Analysis by End Use, 2020-2035
  • Figure 163: Eastern Europe Market Value Share (%) and BPS Analysis by End Use, 2025-2035
  • Figure 164: Eastern Europe Market Y-o-Y Growth (%) Projections by End Use, 2025-2035
  • Figure 165: Eastern Europe Market Attractiveness by Sensor Type, 2025-2035
  • Figure 166: Eastern Europe Market Attractiveness by Function, 2025-2035
  • Figure 167: Eastern Europe Market Attractiveness by End Use, 2025-2035
  • Figure 168: Eastern Europe Market Attractiveness by Country, 2025-2035
  • Figure 169: Middle East & Africa Market Value (USD Million) by Sensor Type, 2025-2035
  • Figure 170: Middle East & Africa Market Value (USD Million) by Function, 2025-2035
  • Figure 171: Middle East & Africa Market Value (USD Million) by End Use, 2025-2035
  • Figure 172: Middle East & Africa Market Value (USD Million) by Country, 2025-2035
  • Figure 173: Middle East & Africa Market Value (USD Million) Analysis by Country, 2020-2035
  • Figure 174: Middle East & Africa Market Volume (Units) Analysis by Country, 2020-2035
  • Figure 175: Middle East & Africa Market Value Share (%) and BPS Analysis by Country, 2025-2035
  • Figure 176: Middle East & Africa Market Y-o-Y Growth (%) Projections by Country, 2025-2035
  • Figure 177: Middle East & Africa Market Value (USD Million) Analysis by Sensor Type, 2020-2035
  • Figure 178: Middle East & Africa Market Volume (Units) Analysis by Sensor Type, 2020-2035
  • Figure 179: Middle East & Africa Market Value Share (%) and BPS Analysis by Sensor Type, 2025-2035
  • Figure 180: Middle East & Africa Market Y-o-Y Growth (%) Projections by Sensor Type, 2025-2035
  • Figure 181: Middle East & Africa Market Value (USD Million) Analysis by Function, 2020-2035
  • Figure 182: Middle East & Africa Market Volume (Units) Analysis by Function, 2020-2035
  • Figure 183: Middle East & Africa Market Value Share (%) and BPS Analysis by Function, 2025-2035
  • Figure 184: Middle East & Africa Market Y-o-Y Growth (%) Projections by Function, 2025-2035
  • Figure 185: Middle East & Africa Market Value (USD Million) Analysis by End Use, 2020-2035
  • Figure 186: Middle East & Africa Market Volume (Units) Analysis by End Use, 2020-2035
  • Figure 187: Middle East & Africa Market Value Share (%) and BPS Analysis by End Use, 2025-2035
  • Figure 188: Middle East & Africa Market Y-o-Y Growth (%) Projections by End Use, 2025-2035
  • Figure 189: Middle East & Africa Market Attractiveness by Sensor Type, 2025-2035
  • Figure 190: Middle East & Africa Market Attractiveness by Function, 2025-2035
  • Figure 191: Middle East & Africa Market Attractiveness by End Use, 2025-2035
  • Figure 192: Middle East & Africa Market Attractiveness by Country, 2025-2035

Frequently Asked Questions

How big is the Ingestible Sensors market in 2025?

The global Ingestible Sensors market is valued at USD 983.6 million in 2025.

What will be the size of the Ingestible Sensors market in 2035?

The size of the Ingestible Sensors market is projected to reach USD 1,696.1 million by 2035.

How much will the Ingestible Sensors market grow between 2025 and 2035?

The Ingestible Sensors market is expected to grow at a 5.6% CAGR between 2025 and 2035.

What are the key sensor type segments in the Ingestible Sensors market?

The key sensor type segments in the Ingestible Sensors market are Temperature, Pressure, pH, and Image/Imaging.

Which sensor type segment is expected to contribute a significant share to the Ingestible Sensors market in 2025?

In terms of sensor type, the Temperature segment is set to command the dominant share in the Ingestible Sensors market in 2025.

Explore Similar Insights

Future Market Insights

Ingestible Sensors Market

Chat With

MaRIA

Hi There, I am MaRIA, Your Market Research Intelligence Assistant. How may I help you?