The global PM2.5 sensors for home appliances market is projected to expand from USD 188.3 million in 2025 to USD 346.9 million by 2035, reflecting a steady CAGR of 6.3%. This growth trend demonstrates consistent demand driven by increasing awareness of indoor air quality, rising health concerns related to air pollution, and greater adoption of smart home technologies. The market trajectory indicates stable expansion without sharp fluctuations, suggesting a reliable upward growth pattern. The steady CAGR reflects the gradual adoption of PM2.5 sensors in appliances such as air purifiers, HVAC systems, and smart air quality monitors.
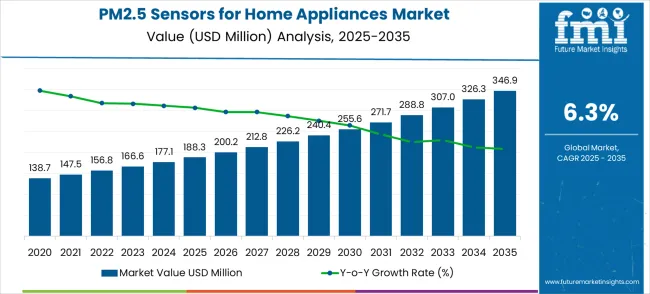
Analyzing the long-term growth trend reveals that the market has been on a consistent upward trajectory over the decade. From USD 188.3 million in 2025, the market is projected to grow to USD 200.2 million in 2026 and USD 226.2 million by 2028, marking a steady progression without signs of stagnation. This trend reflects increasing integration of PM2.5 sensors as regulatory bodies and consumers demand better air quality monitoring. By 2030, the market is expected to reach USD 271.7 million, driven by technological advancements that enhance sensor accuracy and affordability, encouraging wider deployment in residential environments.
The CAGR of 6.3% quantifies a stable growth rate across the forecast period. Annual growth rates range from 6.3% to 6.5%, indicating low volatility and dependable expansion.
Between 2025 and 2028, year-on-year growth averages around USD 12–14 million, fueled by rising awareness of the health impacts of PM2.5 particles and increasing urban pollution. From 2029 onward, growth is projected to accelerate moderately, with the market reaching USD 326.3 million in 2034 before attaining USD 346.9 million in 2035. This reflects steady adoption patterns and technology improvements that make PM2.5 sensors an essential component in modern home appliances.
Trendline analysis of the market shows that a linear growth model best represents the trajectory, reflecting steady and predictable expansion without extreme surges or declines. The decade-long forecast suggests a stable market environment, where growth is sustained primarily by technological innovation, regulatory drivers, and rising consumer awareness of air quality. While exponential growth is unlikely given the mature pace, consistent demand positions the market for steady expansion. The market is characterized by stable growth, driven by ongoing integration in smart appliances and heightened air quality concerns.
| Metric | Value |
|---|---|
| Market Value (2025) | USD 188.3 million |
| Market Forecast Value (2035) | USD 346.9 million |
| Market Forecast CAGR | 6.3% |
Market expansion is being supported by the rapid increase in air pollution awareness worldwide and the corresponding need for advanced monitoring technologies that provide accurate particulate matter detection and automated appliance control. Modern consumers rely on consistent air quality information and intelligent appliance operation to ensure optimal indoor environments including residential spaces, office environments, and commercial facilities. Even minor air quality variations can require comprehensive appliance adjustments to maintain optimal health standards and operational performance.
The growing complexity of indoor air quality management requirements and increasing demand for smart home integration solutions are driving demand for PM2.5 sensors from certified manufacturers with appropriate accuracy specifications and technical expertise. Home appliance companies are increasingly requiring documented sensor performance and reliability data to maintain product quality and consumer satisfaction. Industry specifications and performance standards are establishing standardized air quality monitoring procedures that require specialized sensor technologies and integrated control systems.
The market is segmented by light source type, application, and region. By light source type, the market is divided into laser light source, LED light source, infrared light source, and others. Based on application, the market is categorized into air purifier, air conditioner, robot vacuum cleaner, and others. Regionally, the market is divided into North America, Europe, East Asia, South Asia & Pacific, Latin America, and Middle East & Africa.
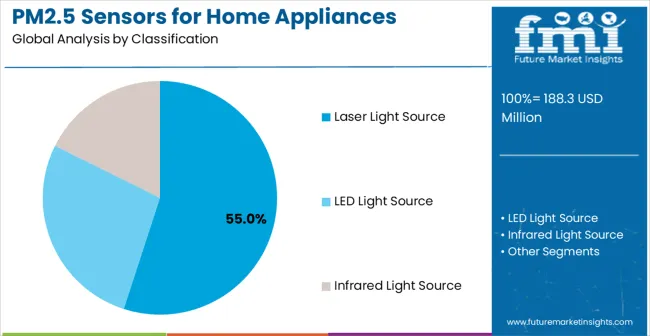
In 2025, the laser light source PM2.5 sensor segment is projected to capture around 55% of the total market share, making it the leading technology category. This dominance is largely driven by the widespread adoption of laser-based detection systems that provide superior accuracy and reliability, catering to a wide variety of home appliance applications. The laser light source technology is particularly favored for its ability to deliver precise particle counting and sizing capabilities in both high and low concentration environments, ensuring measurement reliability.
Air purifier manufacturers, HVAC companies, smart home device producers, and appliance integrators increasingly prefer this technology, as it meets demanding accuracy requirements without imposing excessive power consumption or calibration complexities. The availability of well-established laser diode components, along with comprehensive technical support and performance validation from leading sensor manufacturers, further reinforces the segment's market position.
Additionally, this technology category benefits from consistent demand across regions, as it is considered the gold standard for precise PM2.5 measurement in consumer applications. The combination of accuracy, reliability, and technological maturity makes laser light source PM2.5 sensors a reliable choice, ensuring their continued popularity in the home appliance sensor market.
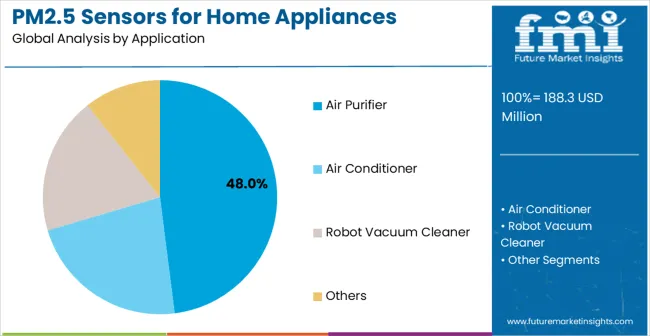
The air purifier segment is expected to represent 48% of PM2.5 sensors demand in 2025, highlighting its position as the most significant application sector. This dominance stems from the unique operational requirements of air purification devices, where continuous and accurate particulate matter monitoring is critical to device performance and energy efficiency.
Air purifiers often feature automatic operation modes that depend entirely on real-time PM2.5 readings throughout extended operating cycles, requiring reliable and responsive sensor technologies. PM2.5 sensors are particularly well-suited to these environments due to their ability to provide instantaneous air quality feedback and enable automated fan speed adjustments efficiently, even during varying pollution conditions.
As air purifier markets expand globally and emphasize improved performance standards, the demand for PM2.5 sensors continues to rise. The segment also benefits from heightened competition within the home appliance industry, where manufacturers are increasingly prioritizing smart features and energy efficiency as differentiators to attract environmentally conscious consumers.
With air purifier companies investing in intelligent control systems and user experience enhancement, PM2.5 sensors provide essential feedback mechanisms to maintain high-performance operation. The growth of smart home ecosystems, coupled with increased focus on health and wellness applications, ensures that air purifier applications will remain the largest and most stable demand driver for PM2.5 sensors in the forecast period.
The market is advancing steadily due to increasing air pollution concerns and growing recognition of indoor air quality monitoring advantages over traditional appliance operation methods. Rising health consciousness among consumers, expanding smart home adoption, and government initiatives promoting air quality awareness are driving substantial market growth. Integration requirements with existing appliance control systems and consumer demand for real-time air quality information further accelerate sensor adoption. The market faces challenges including higher costs compared to basic appliance designs, need for regular calibration and maintenance, and varying accuracy requirements across different appliance applications. Additional restraints include sensor drift issues over time, potential interference from household chemicals and cooking activities, and complexity of integrating sensors with diverse appliance control architectures without compromising existing functionality.
The growing development of advanced PM2.5 detection systems is enabling superior measurement accuracy with improved response times and enhanced environmental stability characteristics. Enhanced sensor technologies including miniaturized laser modules, optimized photodetector arrays, advanced signal processing algorithms, and temperature compensation systems provide superior measurement performance while maintaining cost-effectiveness requirements. These technologies are particularly valuable for home appliance manufacturers who require reliable sensor performance that can support diverse operating environments with consistent results. Modern innovations encompass self-cleaning mechanisms, automatic calibration protocols, wireless connectivity integration, and machine learning algorithms that adapt to local environmental conditions, ensuring accurate measurements throughout the sensor's operational lifetime and reducing maintenance requirements for end users.
Modern PM2.5 sensor manufacturers are incorporating advanced connectivity protocols and comprehensive data analytics capabilities that enhance appliance intelligence and user experience effectiveness. Integration of WiFi and Bluetooth connectivity, mobile app interfaces, cloud data storage systems, and predictive analytics enables superior user engagement and comprehensive air quality management capabilities. These features include real-time data visualization, historical trend analysis, automated alert systems, and integration with smart home platforms like Amazon Alexa and Google Home. Advanced connectivity features support operation within diverse smart home ecosystems while meeting various user preferences and automation requirements. Sensor providers now offer comprehensive software development kits, API access for third-party integrations, over-the-air firmware updates, and machine learning capabilities that enable appliances to learn user preferences and optimize performance based on usage patterns and environmental conditions.
The PM2.5 sensors for home appliances market is entering a new phase of growth, driven by demand for smart air quality monitoring, health consciousness expansion, and evolving connectivity and automation standards. By 2035, these pathways together can unlock USD 80-100 million in incremental revenue opportunities beyond baseline growth.
Pathway A - Air Purifier Integration Leadership The air purifier segment already holds the largest share due to direct air quality management needs. Expanding sensor accuracy, smart features, and energy optimization can consolidate leadership. Opportunity pool: USD 25-32 million.
Pathway B - HVAC System Integration Air conditioning and heating systems present growing opportunities for integrated air quality monitoring and automated climate control optimization. Opportunity pool: USD 20-26 million.
Pathway C - Smart Home Ecosystem Expansion Integration with comprehensive smart home platforms and IoT ecosystems offers premium positioning for connected living applications. Opportunity pool: USD 15-22 million.
Pathway D - Robot Vacuum Intelligence Advanced robotic cleaning devices with integrated air quality mapping and cleaning optimization present specialized growth opportunities. Opportunity pool: USD 10-15 million.
Pathway E - Emerging Market Penetration Asia-Pacific and developing regions present growing demand due to rising air pollution awareness and appliance modernization trends. Opportunity pool: USD 8-12 million.
Pathway F - Industrial and Commercial Applications Office buildings, schools, and commercial spaces requiring integrated air quality management in HVAC systems offer expansion opportunities. Opportunity pool: USD 6-10 million.
Pathway G - Health and Wellness Integration Specialized applications for healthcare facilities, elderly care, and allergy management create premium market segments. Opportunity pool: USD 4-7 million.
Pathway H - Advanced Analytics and Services Data analytics services, predictive maintenance, and air quality consulting create recurring revenue streams beyond hardware sales. Opportunity pool: USD 3-5 million.
| Country | CAGR (2025-2035) |
|---|---|
| China | 8.5% |
| India | 7.9% |
| Germany | 7.2% |
| Brazil | 6.6% |
| United States | 6.0% |
| United Kingdom | 5.4% |
| Japan | 4.7% |
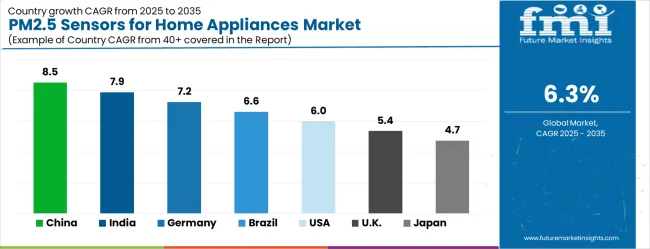
The market is growing rapidly, with China leading at an 8.5% CAGR through 2035, driven by severe air pollution challenges and increasing adoption of smart air quality management solutions. India follows at 7.9%, supported by rising environmental awareness and growing home appliance modernization trends.
Germany grows steadily at 7.2%, integrating advanced sensor technologies into its established home appliance and smart home infrastructure. Brazil records 6.6%, focusing health consciousness and appliance technology advancement initiatives. The United States shows solid growth at 6.0%, focusing on smart home integration and energy efficiency optimization. The United Kingdom demonstrates steady progress at 5.4%, maintaining established air quality awareness and smart appliance applications. Japan records 4.7% growth, concentrating on technology refinement and precision manufacturing enhancement.
The report covers an in-depth analysis of 40+ countries; top-performing countries are highlighted below.
China is projected to exhibit the highest growth rate with a CAGR of 8.5% through 2035, driven by severe air pollution conditions and increasing demand for advanced air quality monitoring solutions. The country's persistent smog challenges in major cities like Beijing, Shanghai, and Shenzhen have created unprecedented consumer awareness about indoor air quality, making PM2.5 sensors essential components in home appliances.
Growing environmental consciousness among China's expanding middle class, coupled with rising disposable incomes, is fueling demand for intelligent air purification systems and smart HVAC solutions. Major appliance manufacturers including Xiaomi, Midea, and Gree are establishing comprehensive sensor integration programs to support health-conscious consumers and regulatory compliance across urban markets. The rapid adoption of IoT-enabled smart home ecosystems and mobile app integration is further accelerating sensor demand, as consumers seek real-time air quality monitoring and automated appliance control capabilities.
Government environmental protection initiatives, including the National Air Quality Standards and Green Building Action Plan, are supporting establishment of indoor air quality monitoring requirements and appliance efficiency programs, driving demand for advanced sensor technologies throughout major metropolitan areas. The "Healthy China 2030" strategy emphasizes indoor environment quality, creating regulatory support for sensor-integrated appliances. Smart home modernization programs under the "Internet Plus" initiative are facilitating adoption of sensor-integrated appliances that enhance air quality management and energy efficiency standards across residential networks. Local government subsidies for energy-efficient appliances and smart home technologies are further boosting market adoption rates.
India is expanding at a CAGR of 7.9%, supported by increasing environmental awareness and growing recognition of indoor air quality management benefits. India's major metropolitan areas, including Delhi, Mumbai, Kolkata, and Bangalore, consistently rank among the world's most polluted cities, creating urgent consumer demand for effective air quality solutions. The country's expanding middle class, estimated at over 300 million people, is increasingly prioritizing health and wellness, driving adoption of smart air purifiers, intelligent HVAC systems, and sensor-enabled appliances.
Rising urbanization rates, with over 35% of the population now living in cities, coupled with increasing awareness of respiratory health impacts, are creating substantial market opportunities for PM2.5 sensor integration. Local manufacturers like Voltas, Blue Star, and Godrej are partnering with international sensor suppliers to develop cost-effective solutions tailored to Indian market requirements and price sensitivity.
Environmental awareness growth and appliance infrastructure development are creating opportunities for sensor suppliers that can support diverse integration requirements and cost specifications. The Indian government's smart cities mission and digital India initiatives are promoting IoT adoption and smart home technologies, creating favorable conditions for sensor-integrated appliances.
Professional training and technical programs through institutions like IITs and engineering colleges are building sensor expertise among appliance engineers, enabling effective utilization of PM2.5 technologies that meets home appliance standards and performance requirements. The Make in India program is encouraging local manufacturing of sensors and components, reducing costs and improving market accessibility.
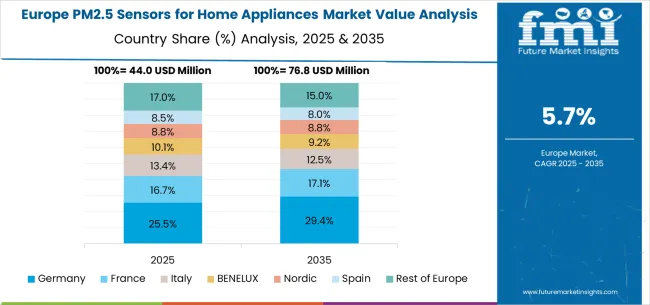
Germany is projected to grow at a CAGR of 7.2%, supported by the country's focus on smart home quality standards and advanced sensor technology adoption. Germany's strong environmental consciousness, coupled with stringent indoor air quality regulations and energy efficiency requirements, creates a favorable market environment for premium sensor-integrated appliances.
The country's leading home appliance manufacturers, including Bosch, Siemens, and Miele, are investing heavily in IoT integration and smart home connectivity, viewing PM2.5 sensors as essential components for next-generation appliances. German consumers demonstrate high willingness to pay premium prices for quality, reliability, and environmental benefits, making the market particularly attractive for advanced sensor technologies. The country's Industry 4.0 initiative and strong automation heritage provide technical expertise and manufacturing capabilities that support sophisticated sensor integration and data analytics applications.
Smart home industry investments are prioritizing advanced sensor technologies that demonstrate superior performance and reliability while meeting German quality and environmental standards. The government's Digital Strategy 2025 and Energy Efficiency Strategy 2050 programs promote smart building technologies and connected appliances, creating regulatory support for sensor adoption.
Professional certification programs through organizations like VDE and ZVEI are ensuring comprehensive technical expertise among appliance engineers, enabling specialized sensor integration capabilities that support diverse home appliance applications and smart home requirements. Germany's robust research and development infrastructure, including Fraunhofer Institutes and technical universities, supports innovation in sensor accuracy, longevity, and integration methodologies.
Brazil is growing at a CAGR of 6.6%, driven by increasing health consciousness and growing recognition of air quality monitoring advantages. Brazil's major urban centers, including São Paulo, Rio de Janeiro, and Belo Horizonte, face significant air quality challenges from industrial emissions, vehicle pollution, and seasonal burning activities, creating growing consumer awareness about indoor air protection.
The country's expanding middle class, benefiting from economic recovery and improved living standards, is increasingly investing in home comfort and health-oriented appliances. Local appliance manufacturers such as Electrolux Brazil, Consul, and Brastemp are beginning to integrate air quality monitoring features to differentiate their products in the competitive Brazilian market. The growing prevalence of respiratory conditions and allergies, particularly in urban areas, is driving consumer demand for intelligent air purification and climate control solutions.
Health awareness modernization is facilitating adoption of advanced sensor technologies that support comprehensive air quality management capabilities across appliance and residential regions. The Brazilian government's national policy on climate change and urban air quality improvement programs are creating regulatory frameworks that support cleaner indoor environments.
Appliance companies and smart home providers are investing in PM2.5 sensor technology to address evolving consumer health requirements and product differentiation. Professional development programs through technical institutions and industry associations are enhancing technical capabilities among appliance personnel, enabling effective PM2.5 sensor utilization that meets evolving health standards and operational requirements. The growth of e-commerce platforms and digital retail channels is improving access to sensor-enabled appliances across Brazil's diverse geographic regions.
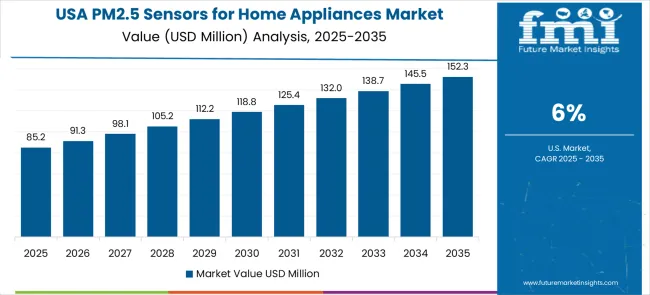
The USA is expanding at a CAGR of 6.0%, driven by established smart home industries and growing focus on health and energy efficiency enhancement. The United States benefits from mature smart home adoption rates, with over 30% of households owning connected devices, creating a receptive market for sensor-integrated appliances. Major appliance manufacturers including Whirlpool, GE Appliances, and Frigidaire are incorporating PM2.5 monitoring capabilities into their premium product lines to meet consumer demands for health-conscious home environments.
The country's diverse climate conditions, from wildfire-prone California to high-pollen regions in the Southeast, create varied but consistent demand for air quality monitoring across different geographic markets. Rising awareness of indoor air quality's impact on respiratory health, particularly following COVID-19, has accelerated consumer interest in air purification and monitoring technologies.
Smart home industry leadership is enabling standardized sensor utilization across multiple appliance types, providing consistent air quality monitoring and comprehensive operational coverage throughout regional markets. The USA Environmental Protection Agency's indoor air quality guidelines and Energy Star efficiency programs provide regulatory frameworks that support sensor adoption in energy-efficient appliances.
Large appliance manufacturers and smart home technology companies are implementing comprehensive PM2.5 sensor capabilities to serve diverse consumer requirements. The market benefits from established sensor distribution networks and professional training programs that support various home appliance applications. Professional development and certification programs through organizations like ASHRAE and industry associations are building specialized technical expertise among appliance engineers, enabling effective PM2.5 sensor utilization that supports evolving smart home requirements and energy efficiency standards.
The UK is projected to grow at a CAGR of 5.4%, supported by established health consciousness and growing focus on smart appliance capabilities. The United Kingdom's long-standing environmental awareness, strengthened by government initiatives such as the Clean Air Strategy and Net Zero commitments, creates a supportive regulatory environment for air quality monitoring technologies.
British consumers demonstrate high sensitivity to air quality issues, particularly following well-publicized health studies linking air pollution to respiratory and cardiovascular diseases. Major appliance retailers including Currys PC World and John Lewis are expanding their smart appliance offerings, with air quality features becoming increasingly important selling points. The country's housing stock, which includes many older buildings with potential air quality challenges, drives consumer interest in monitoring and improvement solutions.
Health facility investments are prioritizing advanced sensor technologies that support diverse air quality applications while maintaining established quality and health standards. British appliance manufacturers and health technology companies are implementing PM2.5 sensors that meet industry quality standards and health requirements, supported by NHS health guidelines and building regulations.
The market benefits from established environmental awareness and comprehensive training programs for appliance professionals. Professional development programs through institutions like the Institute of Refrigeration and CIBSE are building technical expertise among appliance personnel, enabling specialized PM2.5 sensor integration capabilities that meet evolving facility requirements and health standards. The UK's strong research base, including universities and health research institutions, supports innovation in sensor applications and health outcome studies that drive market awareness and adoption.
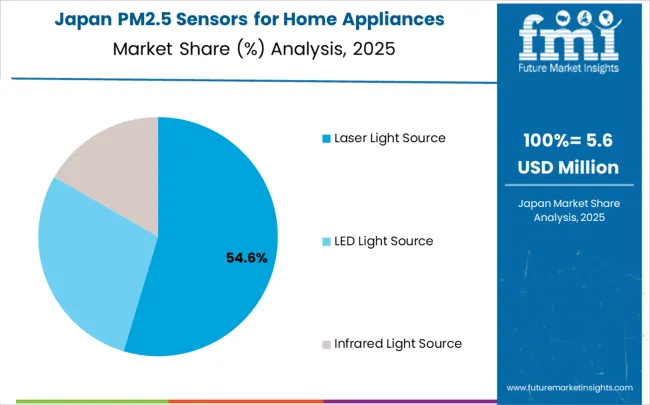
Japan is growing at a CAGR of 4.7%, driven by the country's focus on sensor technology innovation and precision enhancement applications. Japan's advanced manufacturing capabilities and technological leadership in electronics and sensors create a unique market environment where precision, reliability, and miniaturization are paramount.
Leading Japanese companies including Sharp, Panasonic, and Daikin are leveraging their sensor expertise to develop highly accurate, compact PM2.5 monitoring solutions integrated into air purifiers, HVAC systems, and smart home appliances. The country's aging population and high health consciousness drive demand for indoor air quality solutions that can help manage respiratory conditions and allergies. Japan's compact living spaces and energy efficiency priorities create demand for intelligent, automated appliances that optimize performance based on real-time air quality data.
Technology industry investments are prioritizing innovative sensor solutions that combine advanced measurement technology with precision manufacturing while maintaining Japanese quality and reliability standards. Japanese appliance and sensor companies are implementing advanced PM2.5 sensor systems that demonstrate superior measurement reliability and integration efficiency, characterized by focus on technological excellence, quality assurance, and seamless integration with established appliance manufacturing workflows.
Professional development programs through organizations like JEMA and industry research institutes are ensuring comprehensive technical expertise among appliance engineers, enabling specialized air quality monitoring capabilities that support diverse home appliance applications and smart home requirements. Japan's leadership in IoT platforms and mobile technology integration supports advanced connectivity features and user interface development for sensor-enabled appliances.
The market is defined by competition among specialized sensor manufacturers, home appliance companies, and smart home technology solution providers. Companies are investing in advanced sensor technology development, integration optimization, accuracy enhancement improvements, and comprehensive software capabilities to deliver reliable, accurate, and cost-effective air quality monitoring solutions. Strategic partnerships, technological innovation, and market expansion are central to strengthening product portfolios and market presence.
Sensirion AG offers comprehensive PM2.5 sensor solutions with established sensor expertise and precision measurement capabilities. Sharp provides integrated appliance solutions with focus on air quality monitoring and smart home integration. Panasonic delivers advanced home appliance technologies with focus on sensor integration and user experience optimization. Honeywell specializes in environmental monitoring solutions with advanced sensor technology integration.
Prodrive Technologies offers professional-grade sensor integration services with comprehensive technical support capabilities. DFRobot provides accessible sensor solutions with focus on maker and integration markets. Cubic Sensor and Instrument Co. Ltd., Nanchang Panteng Technology Co. Ltd., Zhengzhou Winsen Electronics Technology Co. Ltd., and Guangzhou Luftmy Intelligence Technology Co. Ltd. deliver specialized manufacturing expertise, sensor reliability, and comprehensive product development across global and regional market segments.
| Item | Value |
|---|---|
| Quantitative Units | USD 188.3 million |
| Light Source Type | Laser Light Source, LED Light Source, Infrared Light Source, Others |
| Application | Air Purifier, Air Conditioner, Robot Vacuum Cleaner, Others |
| Regions Covered | North America, Europe, East Asia, South Asia & Pacific, Latin America, Middle East & Africa |
| Country Covered | China, India, Germany, Brazil, United States, United Kingdom, Japan, and 40+ countries |
| Key Companies Profiled | Sensirion AG, Sharp, Panasonic, Honeywell, Prodrive Technologies, DFRobot, Cubic Sensor and Instrument Co. Ltd., Nanchang Panteng Technology Co. Ltd., Zhengzhou Winsen Electronics Technology Co. Ltd., Guangzhou Luftmy Intelligence Technology Co. Ltd. |
| Additional Attributes | Dollar sales by light source type and application segment, regional demand trends across major markets, competitive landscape with established sensor manufacturers and emerging technology providers, customer preferences for different sensor technologies and integration options, integration with smart home systems and mobile applications, innovations in measurement accuracy and power efficiency technologies, and adoption of advanced connectivity features with enhanced user experience capabilities for improved air quality management workflows. |
The global PM2.5 sensors for home appliances market is estimated to be valued at USD 188.3 million in 2025.
The market size for the PM2.5 sensors for home appliances market is projected to reach USD 346.9 million by 2035.
The PM2.5 sensors for home appliances market is expected to grow at a 6.3% CAGR between 2025 and 2035.
The key product types in PM2.5 sensors for home appliances market are laser light source, led light source and infrared light source.
In terms of application, air purifier segment to command 48.0% share in the PM2.5 sensors for home appliances market in 2025.


Our Research Products

The "Full Research Suite" delivers actionable market intel, deep dives on markets or technologies, so clients act faster, cut risk, and unlock growth.

The Leaderboard benchmarks and ranks top vendors, classifying them as Established Leaders, Leading Challengers, or Disruptors & Challengers.

Locates where complements amplify value and substitutes erode it, forecasting net impact by horizon

We deliver granular, decision-grade intel: market sizing, 5-year forecasts, pricing, adoption, usage, revenue, and operational KPIs—plus competitor tracking, regulation, and value chains—across 60 countries broadly.

Spot the shifts before they hit your P&L. We track inflection points, adoption curves, pricing moves, and ecosystem plays to show where demand is heading, why it is changing, and what to do next across high-growth markets and disruptive tech

Real-time reads of user behavior. We track shifting priorities, perceptions of today’s and next-gen services, and provider experience, then pace how fast tech moves from trial to adoption, blending buyer, consumer, and channel inputs with social signals (#WhySwitch, #UX).

Partner with our analyst team to build a custom report designed around your business priorities. From analysing market trends to assessing competitors or crafting bespoke datasets, we tailor insights to your needs.
Supplier Intelligence
Discovery & Profiling
Capacity & Footprint
Performance & Risk
Compliance & Governance
Commercial Readiness
Who Supplies Whom
Scorecards & Shortlists
Playbooks & Docs
Category Intelligence
Definition & Scope
Demand & Use Cases
Cost Drivers
Market Structure
Supply Chain Map
Trade & Policy
Operating Norms
Deliverables
Buyer Intelligence
Account Basics
Spend & Scope
Procurement Model
Vendor Requirements
Terms & Policies
Entry Strategy
Pain Points & Triggers
Outputs
Pricing Analysis
Benchmarks
Trends
Should-Cost
Indexation
Landed Cost
Commercial Terms
Deliverables
Brand Analysis
Positioning & Value Prop
Share & Presence
Customer Evidence
Go-to-Market
Digital & Reputation
Compliance & Trust
KPIs & Gaps
Outputs
Full Research Suite comprises of:
Market outlook & trends analysis
Interviews & case studies
Strategic recommendations
Vendor profiles & capabilities analysis
5-year forecasts
8 regions and 60+ country-level data splits
Market segment data splits
12 months of continuous data updates
DELIVERED AS:
PDF EXCEL ONLINE
Sensors Market Analysis by Type, Technology, End User & Region - Forecast from 2025 to 2035
Biosensors Market Trends – Growth & Future Outlook 2025 to 2035
UV Sensors Market Analysis by Type, End User, and Region from 2025 to 2035
Nanosensors Market Size and Share Forecast Outlook 2025 to 2035
VOC Sensors and Monitors Market Analysis - Size, Growth, and Forecast 2025 to 2035
Rain Sensors Market Size and Share Forecast Outlook 2025 to 2035
Skin Sensors Market Size, Growth, and Forecast for 2025 to 2035
Weft Sensors Market - Size, Share, and Forecast Outlook 2025 to 2035
ADAS Sensors Market Growth - Trends & Forecast 2025 to 2035
Image Sensors Market Growth – Trends & Forecast through 2034
Chest Sensors Market
PPG Biosensors Market – Size, Share & Growth Forecast 2025 to 2035
Motion Sensors Market
EMG Biosensors Market
Airbag Sensors Market
Shutter Sensors Market Size and Share Forecast Outlook 2025 to 2035
Printed Sensors Market Size and Share Forecast Outlook 2025 to 2035
Quantum Sensors Market Size and Share Forecast Outlook 2025 to 2035
Seismic Sensors Market Size and Share Forecast Outlook 2025 to 2035
Tactile Sensors Market Size and Share Forecast Outlook 2025 to 2035

Thank you!
You will receive an email from our Business Development Manager. Please be sure to check your SPAM/JUNK folder too.
Chat With
MaRIA