Jelly Mist Market Size and Share Forecast Outlook 2025 to 2035

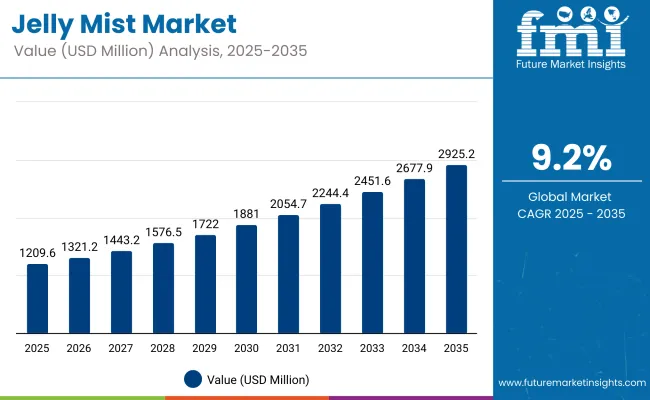
The jelly mist market is expected to record a valuation of USD 1,209.6 million in 2025 and USD 2,925.2 million in 2035, with an increase of USD 1,715.6 million, which equals a growth of 142% over the decade. The overall expansion represents a CAGR of 9.2% and a 2.4X increase in market size.
Quick Stats for Global Jelly Mist Market

  • Global Jelly MistMarket Value (2025): USD 1,209.6 million
  • Global Jelly MistMarket Forecast Value (2035): USD 2,925.2 million
  • Market Forecast CAGR (2025 to 2035): 9.2%
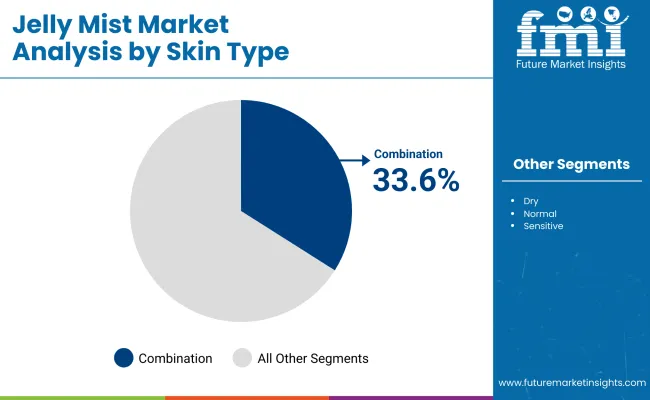
  • Leading Segment in 2025: Combination Skin Type (33.6%)
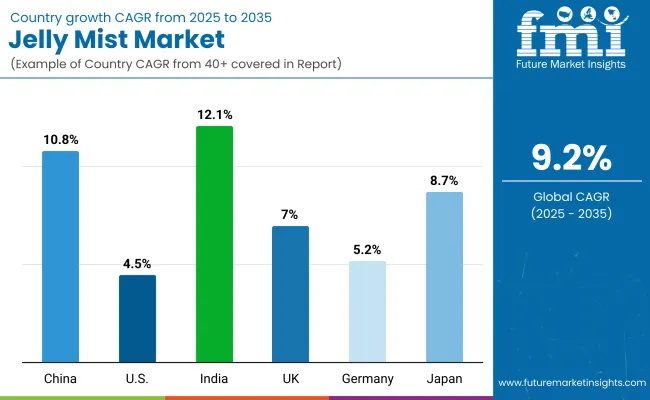
  • Key Growth Regions: China (CAGR 10.8%), India (CAGR 12.1%), Japan (CAGR 8.7%)
  • Top Key Players: Nature Republic, HolikaHolika, VT Cosmetics, Some By Mi, Innisfree, Etude, The Face Shop, TonyMoly, Peripera, 3CE (Stylenanda)

Jelly Mist Market

Global Jelly Mists Market Key Takeaways

Metric Value
Global Jelly Mists Market Estimated Value in (2025E) USD 1,209.6 million
Global Jelly Mists Market Forecast Value in (2035F) USD 2,925.2 million
Forecast CAGR (2025 to 2035) 9.2%

During the first five-year period from 2025 to 2030, the market increases from USD 1,209.6 million to USD 1,881.0 million, adding USD 671.4 million, which accounts for 39% of the total decade growth. This phase records steady adoption across skincare routines driven by hydration, sensitivity relief, and pore care, with combination skin type formulations catering to over one-third of consumers. Hyaluronic acid-based jelly mists dominate this period as they capture over 28% of the active ingredient market, favored for intense moisturization and skin-plumping effects.

The second half from 2030 to 2035 contributes USD 1,044.2 million, equal to 61% of total growth, as the market jumps from USD 1,881.0 million to USD 2,925.2 million. This acceleration is powered by premium positioning, refillable and sustainable packaging adoption, and expansion in Asia-Pacific markets such as China and India, which record CAGRs of 10.8% and 12.1% respectively. Offline retail remains dominant with more than 54% share in 2025, but online platforms gain ground through K-beauty brand collaborations, influencer-driven marketing, and global shipping capabilities.

From 2020 to 2024, the jelly mist market grew steadily in Asia-Pacific and gained traction globally through K-beauty influence. During this period, the competitive landscape was dominated by South Korean skincare brands controlling the majority of revenue, with leaders such as Nature Republic, Innisfree, and The Face Shop focusing on hydrating, soothing, and brightening formulas in aerosol-free fine mist packaging. Competitive differentiation relied on skin feel, finish, and ingredient purity, while refillable formats had minimal traction, contributing less than 5% of the total market value.

Demand for jelly mists will expand to USD 1,209.6 million in 2025, and the revenue mix will shift as eco-friendly packaging, refill systems, and multi-functional claims grow to a significant share by 2035. Traditional category leaders face rising competition from indie and digital-first beauty brands offering vegan, fragrance-free, and skin-barrier-focused jelly mists.

Major brands are pivoting to hybrid models that merge hydration with treatment actives such as niacinamide and vitamin C to capture premium consumers. The competitive advantage is moving away from product novelty alone toward brand ecosystem strength, sustainability credentials, and omni-channel presence.

Analyzing Jelly Mist Market by Top Investment Segments

The market is segmented by skin type, skin concern, ingredient actives, texture/finish, packaging/dispensing, distribution channel, and region. Skin type categories include oily, combination, dry, normal, and sensitive, with combination skin type leading adoption in 2025, accounting for 33.6% of market value. Skin concern segmentation covers hydration, sensitivity/soothing, brightening/dark spots, pore/blackhead care, and anti-aging/firming, highlighting diverse consumer needs from daily moisturization to targeted treatment.

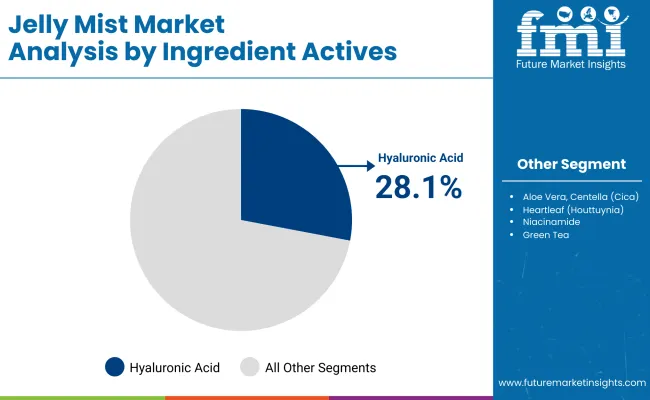
Based on ingredient actives, the segmentation includes hyaluronic acid, aloe vera, centella (cica), heartleaf (houttuynia), niacinamide, green tea, and vitamin C. Hyaluronic acid holds the largest share in 2025 at 28.1% due to its superior water-retention capacity and compatibility across all skin types. Texture/finish classifications feature jelly-to-mist (gelified, micro-mist), watery-jelly (bouncy, quick-set), and essence-jelly (rich, dewy), catering to varying preferences for absorption speed, sensorial feel, and finish.

In terms of packaging/dispensing, the market is divided into fine mist pump (aerosol-free), standard pump/trigger, and refillable pack, with fine mist pumps dominating in 2025, driven by their eco-friendly appeal and enhanced application precision. Distribution channels are segmented into offline retailers and online retailers, with offline retailers accounting for 54.4% of global sales in 2025, supported by in-store experiences and brand-led merchandising.

Regionally, the scope spans North America, Latin America, Europe, East Asia, South Asia & Pacific, and the Middle East & Africa. Among these, China (CAGR 10.8%) and India (CAGR 12.1%) lead growth through 2035, supported by expanding urban populations, strong K-beauty influence, and rapid adoption of premium skincare products, while Japan (CAGR 8.7%) remains a high-value, mature market.
Insights into the Skin Type Segment with Combination Skin Leading in Market Share

Jelly Mist Market By Skin Type

Skin Type Segment Market Value Share, 2025
Combination 33.6%
Others 66.4%

The combination skin segment is projected to contribute 33.6% of the global jelly mist market revenue in 2025, maintaining its lead as the dominant skin type category. This leadership is driven by the versatility of jelly mist formulations that cater to both oily and dry areas of the face, a key concern for combination skin users.

Brands are increasingly targeting this segment with balanced formulations containing humectants such as hyaluronic acid and soothing botanicals like centellaasiatica, ensuring hydration without excessive oiliness. The segment’s growth is also supported by rising consumer awareness of multi-benefit products that address multiple skin zones in a single application.

As personalized skincare trends expand, combination skin-targeted jelly mists are evolving with adaptive actives that adjust moisture delivery according to skin needs. The combination skin segment is expected to remain a cornerstone of product development in the jelly mist market.
Insights into the Ingredient Actives Segment with Hyaluronic Acid Leading

Jelly Mist Market By Ingredient Actives

Ingredient Actives Segment Market Value Share, 2025
H yaluronic acid 28.1%
Others 71.8%

The hyaluronic acid segment is forecasted to hold 28.1% of the market share in 2025, led by its proven efficacy in deep hydration and skin-plumping effects. This active ingredient is favored for its ability to retain moisture in the skin, making it a top choice in both premium and mass-market jelly mist products. Hyaluronic acid’s compatibility with other skincare actives, such as niacinamide and vitamin C, also boosts its popularity among product developers seeking multifunctional formulas.

Its wide applicability across all skin typesespecially in urban environments where dehydration is a common issuehas fueled strong adoption. The segment’s growth is further bolstered by advancements in multi-molecular weight hyaluronic acid technology, enabling deeper skin penetration and longer-lasting results. With hydration remaining the most sought-after benefit in facial mists, hyaluronic acid is expected to maintain its leadership position through the forecast period.

Insights into the Distribution Channel Segment with Offline Retail Leading

Distribution Channel Segment Market Value Share, 2025
offline retail 54.4%
Others 45.6%

The offline retail segment is projected to contribute 54.4% of the jelly mist market revenue in 2025, underscoring the enduring importance of physical retail spaces in beauty product sales. This dominance is supported by in-store sampling, beauty advisor consultations, and experiential merchandising that allow consumers to test textures, scents, and packaging before purchase.

Brick-and-mortar retailers, including beauty specialty stores, department stores, and K-beauty outlets, continue to benefit from brand-led promotions and limited-edition launches. The segment’s strength is also reinforced by the role of offline channels in emerging markets, where physical store presence enhances brand trust and visibility. While online platforms are growing rapidly, offline retail’s tactile engagement and immediate product availability are expected to secure its continued lead in the market.

What are the Drivers, Restraints, and Key Trends of the Global Jelly Mists Market?

Drivers

Shift Toward Hybrid Hydration-Treatment Formats in Everyday Skincare

The demand for jelly mists is being driven by a clear consumer shift toward hybrid products that merge hydration with treatment functions, allowing for multi-step benefits in a single application. Unlike conventional facial sprays, jelly mists deliver a bouncy, gel-infused texture that disperses as a fine mist, ensuring deeper adherence of actives to the skin surface.

In your dataset, the combination skin type segment already accounts for 33.6% share in 2025 (USD 406.43 million), highlighting the growing preference for balanced formulations that address both oily and dry facial zones. The market’s expansion is closely linked to the fact that actives like hyaluronic acid (28.1% share in 2025, USD 339.90 million) are being combined with other targeted agentssuch as niacinamide for brightening or centellaasiatica for soothingcreating a differentiated value proposition. This hybrid appeal is particularly resonating in urban Asian markets, where daily hydration is coupled with anti-pollution and skin barrier claims, fueling higher spend per unit.

Offline Retail Engagement Driving High-Value Purchases

While many beauty categories are shifting toward e-commerce, jelly mists benefit disproportionately from offline retail dominance, which in 2025 holds a 54.4% share (USD 658.02 million). This is not merely a distribution choice but a conversion driverbeauty advisors, live in-store demonstrations, and tactile testing help overcome the “new product” barrier in markets unfamiliar with the format.

In emerging Asian markets like India (CAGR 12.1%) and China (CAGR 10.8%), premium jelly mists are often introduced via flagship brand counters, ensuring first exposure is accompanied by expert education. Offline exposure also supports cross-selling within skincare regimes (e.g., pairing jelly mists with matching serums or toners), leading to higher basket sizes. This physical presence is reinforcing brand trust, which is essential for higher-priced SKUs with specialty actives, and will remain a key growth enabler despite rising online penetration.

Restraints

Price Sensitivity and Cannibalization from Conventional Mists

Jelly mists are priced higher on average than standard water-based facial sprays, due to their gel-infused textures and higher concentration of active ingredients. However, in price-sensitive markets such as parts of Southeast Asia and Latin America, this premium positioning risks cannibalization by established facial mists that retail at 30-50% lower price points.

The performance gap is not always clear to consumers unfamiliar with the format, meaning jelly mists must compete on visible benefit delivery within a short trial period to justify their price. This cost-per-use perception limits penetration in markets where disposable income for skincare is constrained, slowing expansion outside core K-beauty-influenced regions.

Limited Consumer Education Beyond Asia-Pacific

Outside K-beauty strongholds, awareness of jelly mists remains low, and many consumers are unsure how they differ from toners or setting sprays. In Western markets like the USA (CAGR 4.5%), the format has yet to secure mainstream shelf space in mass retailers, making discovery dependent on niche beauty chains or online exposure.

Without targeted influencer partnerships or region-specific positioning (e.g., summer cooling sprays in warm climates), uptake is slow. This lack of education also impacts ingredient-specific adoptionconsumers may recognize hyaluronic acid as a beneficial active but not see the relevance of its delivery through a jelly mist format, reducing impulse and repeat purchases.

Key Trends

Texture Differentiation as a Premiumization Strategy

Within the jelly mist category, brands are increasingly leveraging texture innovation as a way to differentiate and justify premium pricing. Segments like jelly-to-mist and essence-jelly offer distinct sensorial cues that align with high-end skincare expectations.

For instance, jelly-to-mist formats disperse in ultra-fine particles while retaining a cushioned feel on the skin, appealing to consumers seeking a “treatment feel” without cream heaviness. This textural positioning is influencing launch strategiespremium SKUs with complex textures are being placed in flagship offline stores and high-tier e-commerce beauty platforms, driving higher margins.

Ingredient-Led Storytelling Targeted to Regional Concerns

Jelly mists are moving beyond generic hydration claims toward region-specific active ingredient positioning. In urban China, products with heartleaf extract are marketed for anti-inflammatory benefits in pollution-heavy environments. In India, centella and aloe vera variants emphasize skin cooling and after-sun care.

Meanwhile, Western markets are seeing vitamin C and niacinamide mists positioned as brightening solutions to pair with daily SPF routines. This granular targeting not only boosts relevance but also encourages consumers to maintain multiple jelly mists for different needs, effectively increasing purchase frequency.
Analysis of Global Jelly Mists Market By Key Countries

Jelly Mist Market Country Wise Analysis

Country Estimated CAGR (2025 to 2035)
China 10.8%
USA 4.5%
India 12.1%
UK 7.0%
Germany 5.2%
Japan 8.7%

The global jelly mist market shows pronounced regional disparity in adoption speed, strongly influenced by K-beauty penetration, skincare premiumization, and retail channel maturity. Asia-Pacific emerges as the fastest-growing region, anchored by China at 10.8% CAGR and India at 12.1% CAGR. This acceleration is driven by strong K-beauty influence, high consumer receptivity to innovative skincare formats, and rising demand for multifunctional products.

China’s growth benefits from offline retail dominance (53.5% share in 2025) and premium product adoption in Tier-1 and Tier-2 cities, supported by local influencer marketing and cross-border e-commerce platforms. India’s trajectory reflects growing middle-class purchasing power and rapid adoption of actives like hyaluronic acid and centellaasiatica in jelly mist formulations, with offline specialty beauty stores driving first-time purchases in metropolitan and tier-2 markets. Europe maintains a strong growth profile, led by Germany at 5.2% CAGR, the UK at 7.0% CAGR, and mature markets like France and Italy adopting jelly mists through the premium skincare segment.

The UK’s consumer base is showing growing interest in brightening/dark spot-focused mists, while Germany’s market benefits from clean-label and sustainable packaging innovation. Premium pharmacy chains and department stores remain primary points of sale, reinforced by demand for eco-friendly fine mist pumps and refillable packs.

North America shows moderate expansion, with the USA at 4.5% CAGR, reflecting maturity in core beauty categories and slower adoption compared to Asia-Pacific. Growth in the USA is more e-commerce-driven, with influencer-led brand campaigns and hybrid positioning of jelly mists as both skincare and makeup-prep products. Brands are leveraging bundling strategiespairing mists with serums or sunscreento encourage repeat purchase.

Sales Outlook for Jelly Mists in the United States

Year USA Berberine Market (USD Million)
2025 258.82
2026 279.41
2027 301.63
2028 325.62
2029 351.52
2030 379.47
2031 409.65
2032 442.24
2033 477.41
2034 515.38
2035 556.37

The jelly mist market in the United States is projected to grow at a 4.5% CAGR from 2025 to 2035, reaching USD 556.37 million by the end of the period. Growth is fueled by increased adoption in hydration and makeup-setting applications, with K-beauty influence gradually permeating mainstream beauty retail. Premium imports from South Korean brands are gaining space in specialty beauty chains and select department store counters, often supported by in-store brand ambassador events to familiarize consumers with the unique gel-to-mist texture.

Mass-market brands are actively experimenting with hybrid mist formulas containing niacinamide and vitamin C, positioned to deliver dual benefitshydration plus brightening or makeup priming. E-commerce is playing a critical role in awareness-building, with subscription beauty boxes and influencer affiliate programs introducing first-time buyers to the format. Seasonal product bundles, particularly hydration and SPF pairings in summer and anti-aging mist kits in winter, are boosting repeat purchase rates.

  • Brightening and makeup-prep hybrid mists are gaining share in prestige retail as cross-category products appealing to both skincare and makeup buyers.
  • USA consumers show a clear preference for fine mist pumps with a weightless finish and non-fragranced or hypoallergenic formulas, aligning with clean beauty preferences.
  • Bundled skincare kits with coordinated serums and moisturizers are encouraging loyalty and increasing average order value.

Growth and Expansion Outlook for Jelly Mists in the United Kingdom

The jelly mist market in the United Kingdom is expected to grow at a 7.0% CAGR through 2035, driven by hydration, brightening, and anti-aging segments. British consumers, already accustomed to mist products for makeup setting and refreshing during the day, are now upgrading to jelly mist formats for their longer-lasting hydration and enhanced texture feel.

Brightening/dark spot correction mists have emerged as a top-performing sub-category, with active-led SKUs containing vitamin C, niacinamide, and botanical extracts gaining share in premium skincare portfolios. Department store beauty halls and specialty retailers remain crucial channels for product discovery, with K-beauty product demonstrations attracting younger demographics.

Indie beauty brands are carving out a niche by offering refillable, vegan-certified jelly mists packaged in glass bottles, targeting sustainability-conscious millennials and Gen Z buyers. Seasonal promotions, such as summer hydration kits paired with travel-size sunscreens, are also increasing category visibility in holiday retail windows.

  • Brightening and anti-aging mists dominate premium retail sales.
  • Indie brands are gaining credibility by coupling eco-conscious packaging with clean ingredient lists.
  • Seasonal marketing campaigns are boosting trial among first-time buyers and frequent travelers.

Growth and Expansion Outlook for Jelly Mists in India

India is the fastest-growing jelly mist market globally, with a projected 12.1% CAGR through 2035. Growth is underpinned by a rapidly expanding middle class, rising skincare spending, and strong exposure to K-beauty routines via social media platforms such as Instagram and YouTube.

Offline retail activations by K-beauty brandsparticularly in high-traffic malls and beauty specialty chainsare proving effective in educating first-time buyers about the texture and benefits of jelly mists. Hydration and soothing claims dominate consumer preference, with aloe vera and centella-based variants positioned as climate-appropriate solutions for India’s hot and humid regions. Tier-2 and Tier-3 city expansion is accelerating as mid-range product launches cater to aspirational consumers seeking premium sensorial skincare without prohibitive pricing.

  • Training of beauty advisors in multi-brand stores is enhancing recommendation rates, often leading customers to add jelly mists into multi-step routines alongside toners and sheet masks.
  • Mid-range pricing strategies are enabling expansion into smaller cities.
  • Hydration and calming variants are preferred for daily, all-season use. Beauty advisor-led education is crucial for first-time conversion in offline retail.

Sales Outlook for Jelly Mists in China

China’s jelly mist market is set to grow at a 10.8% CAGR, making it one of the fastest-expanding markets globally. This momentum is driven by urban consumer demand for hydration, anti-aging, and brightening products, supported by the country’s advanced offline retail infrastructure and dominance of livestream e-commerce. Tier-1 cities such as Beijing, Shanghai, and Guangzhou are leading in premium purchases, while Tier-2 and Tier-3 cities are driving volume growth through affordable yet high-quality domestic brands.

In 2025, offline channels command 53.5% share (USD 70.77 million), with beauty counters and specialty K-beauty retailers serving as key experiential spaces. Ingredient-led storytelling is a major growth leverheartleaf extract is promoted for anti-inflammatory benefits in pollution-heavy cities, while vitamin C-infused mists are positioned for brightening and skin tone correction. Affordable refillable packs from local manufacturers are democratizing access, allowing mass consumers to experiment with premium-style textures.

  • Offline retail remains dominant, driving both trial and premium upselling.
  • Heartleaf and vitamin C variants are gaining traction in Tier-1 markets.
  • Livestream e-commerce is a core launch and promotion channel, particularly for limited editions and seasonal campaigns.
Country 2025 Share (%)
USA 21.4%
China 10.9%
Japan 6.4%
Germany 14.1%
UK 7.4%
India 4.5%
Country 2035 Share (%)
USA 19.0%
China 11.8%
Japan 7.7%
Germany 12.3%
UK 6.7%
India 5.4%

Opportunity Analysis of the USA Jelly Mist Market

Skin Type Segment Market Value Share, 2025
Combination 34.5%
Others 65.5%

The USA jelly mist market is valued at USD 258.82 million in 2025, with combination skin type leading at 34.5% (USD 89.29 million), followed by other skin types collectively at 65.5%. The dominance of the combination skin segment is directly linked to American consumer preference for balanced formulations that address multiple skin zones simultaneously.

These products are designed to provide targeted hydration to dry areas while controlling oiliness in the T-zone, making them ideal for everyday use in varied climates and across diverse ethnic skin profiles. The growth potential lies in premium hybrid formulations combining hydration with secondary benefits like makeup setting, brightening, and barrier repair.

With a strong clean beauty movement in the USA, fragrance-free and hypoallergenic jelly mists formulated for combination skin are gaining traction, particularly in prestige retail and dermatologist-led recommendations. The integration of multifunctional actives such as niacinamide, vitamin C, and hyaluronic acid further positions this segment for premiumization.

Opportunity Analysis of the China Jelly Mist Market

Distribution Channel Segment Market Value Share, 2025
Offline Retail 53.5%
Others 46.5%

The China jelly mist market is valued at USD 132.28 million in 2025, with offline retail leading at 53.5% (USD 70.77 million), followed by other channelsprimarily onlineat 46.5%. Offline’s dominance is rooted in China’s highly developed beauty retail ecosystem, where department stores, mono-brand boutiques, and multi-brand K-beauty outlets serve as primary touchpoints for product trial and purchase.

Consumers often rely on in-store product demonstrations, live beauty consultations, and influencer-driven pop-up events to experience new textures like jelly-to-mist formats. The opportunity lies in offline-to-online integration, leveraging the physical store experience for initial product discovery while using livestream e-commerce and social media marketing to drive repeat purchases.

As domestic and international brands compete for premium shelf space, offline retailers are increasingly curating ingredient-led assortmentssuch as heartleaf for soothing and vitamin C for brighteningto target urban consumers in Tier-1 and Tier-2 cities.
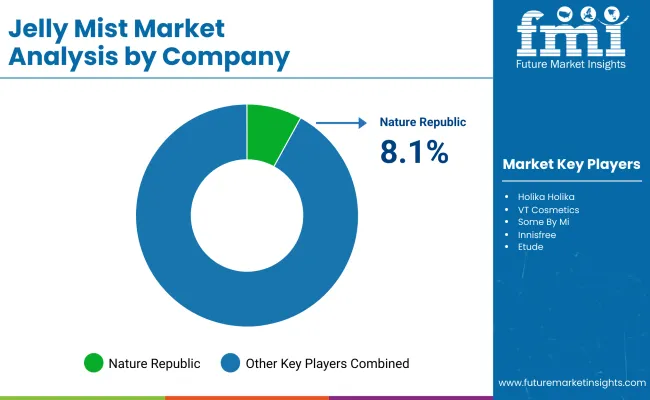
Competitive Landscape of the Global Jelly Mist Market

Jelly Mist Market Analysis By Company

The global jelly mist market is moderately fragmented, with established K-beauty leaders, mid-tier regional brands, and emerging indie players competing across diverse skincare concerns and retail formats. Leading brand Nature Republic holds 8.1% of the global market in 2025, leveraging its strong domestic base in South Korea and extensive distribution through both offline retail chains and online marketplaces.

Its product strategy focuses on hydration and soothing formulations, particularly those featuring aloe vera and hyaluronic acid, supported by eco-conscious packaging initiatives to align with sustainability trends. Established mid-tier players such as Innisfree, Etude, and The Face Shop compete by offering ingredient-led positioningfrom green tea and centellaasiatica to vitamin Ctargeting specific skin concerns like brightening, pore care, and anti-aging.

Their competitive edge comes from integrated brand ecosystems, where jelly mists are cross-promoted alongside complementary skincare lines, enhancing regimen-based adoption. These brands also benefit from robust duty-free and travel retail presence, extending their visibility beyond domestic markets.

Indie and niche-focused brands, including VT Cosmetics, Some ByMi, Peripera, and 3CE (Stylenanda), concentrate on trend-driven product development and youth-oriented branding. They actively engage in limited-edition collaborations, influencer partnerships, and high-frequency product drops to capture younger demographics seeking novelty.

Their flexibility allows them to rapidly adapt to emerging micro-trends such as refillable fine mist pumps and vegan-certified formulations. Competitive differentiation in the jelly mist category is shifting away from simple hydration claims toward multi-functional benefits, texture innovation (e.g., jelly-to-mist, essence-jelly), and sustainability credentials. Brands are increasingly investing in ingredient transparency, social commerce, and region-specific product storytelling to secure consumer loyalty in an expanding but highly competitive global market.

Key Developments in Global Jelly Mists Market

  • In late 2024, Some ByMi debuted a vitamin C-infused Jelly Essence Mist, targeting brightening and dark-spot concerns in mature consumer segments; the product quickly gained traction via influencer livestream promotions.
  • In January 2025, Etude unveiled a dual-chamber jelly-to-mist “Hydra Gloss Mist,” combining a lightweight mist with a layer of dewy jelly finish marketed as both a makeup primer and hydrating mist in a single hybrid format.

Scope of the Report

Item Value
Quantitative Units USD 1,209.6 Million
Skin Type Oily, Combination, Dry, Normal, Sensitive
Skin Concern Hydration, Sensitivity/Soothing, Brightening/Dark Spots, Pore/Blackhead Care, Anti-aging/Firming
Ingredient Actives Hyaluronic Acid, Aloe Vera, Centella ( Cica ), Heartleaf ( Houttuynia ), Niacinamide , Green Tea, Vitamin C
Texture / Finish Jelly-to-Mist ( gelified , micro-mist), Watery-Jelly (bouncy, quick-set), Essence-Jelly (rich, dewy)
Packaging / Dispensing Fine Mist Pump (aerosol-free), Standard Pump / Trigger, Refillable Pack
Distribution Channel Offline Retailers, Online Retailers
Regions Covered North America, Europe, Asia-Pacific, Latin America, Middle East & Africa
Country Covered United States, Canada, Germany, France, United Kingdom, China, Japan, India, Brazil, South Africa
Key Companies Profiled Nature Republic, Holika Holika , VT Cosmetics, Some By Mi , Innisfree, Etude, The Face Shop, TonyMoly , Peripera , 3CE ( Stylenanda )
Additional Attributes Dollar sales by skin type, ingredient actives, and distribution channel; adoption trends in hydration and brightening segments; rising demand for refillable and eco-friendly packaging; regional growth drivers led by Asia-Pacific; premiumization through multifunctional claims; increasing adoption in e-commerce beauty platforms; offline retail engagement trends; sustainable material innovation in packaging; and product diversification through seasonal limited editions and influencer collaborations.

Key Segments

By Skin Type:

  • Oily
  • Combination
  • Dry
  • Normal
  • Sensitive

By Skin Concern:

  • Hydration
  • Sensitivity/soothing
  • Brightening/dark spots
  • Pore/blackhead care
  • Anti-aging/firming

By Ingredient Actives:

  • Hyaluronic acid
  • Aloe vera
  • Centella (Cica)
  • Heartleaf (Houttuynia)
  • Niacinamide
  • Green tea
  • Vitamin C

By Texture / Finish:

  • Jelly-to-mist (gelified, micro-mist)
  • Watery-jelly (bouncy, quick-set)
  • Essence-jelly (rich, dewy)

By Packaging / Dispensing:

  • Fine mist pump (aerosol-free)
  • Standard pump / trigger
  • Refillable pack

By Distribution Channel:

  • Offline Retailers
  • Online Retailers

By Region:

  • North America
  • Latin America
  • Europe
  • East Asia
  • South Asia & Pacific
  • Middle East and Africa

Table of Content

  1. Executive Summary
    • Global Market Outlook
    • Demand-side Trends
    • Supply-side Trends
    • Technology Roadmap Analysis
    • Analysis and Recommendations
  2. Market Overview
    • Market Coverage / Taxonomy
    • Market Definition / Scope / Limitations
  3. Market Background
    • Market Dynamics
      • Drivers
      • Restraints
      • Opportunity
      • Trends
    • Scenario Forecast
      • Demand in Optimistic Scenario
      • Demand in Likely Scenario
      • Demand in Conservative Scenario
    • Opportunity Map Analysis
    • Product Life Cycle Analysis
    • Supply Chain Analysis
      • Supply Side Participants and their Roles
        • Producers
        • Mid-Level Participants (Traders/ Agents/ Brokers)
        • Wholesalers and Distributors
      • Value Added and Value Created at Node in the Supply Chain
      • List of Raw Material Suppliers
      • List of Existing and Potential Buyer’s
    • Investment Feasibility Matrix
    • Value Chain Analysis
      • Profit Margin Analysis
      • Wholesalers and Distributors
      • Retailers
    • PESTLE and Porter’s Analysis
    • Regulatory Landscape
      • By Key Regions
      • By Key Countries
    • Regional Parent Market Outlook
    • Production and Consumption Statistics
    • Import and Export Statistics
  4. Global Market Analysis 2020 to 2024 and Forecast, 2025 to 2035
    • Historical Market Size Value (USD Million) & Volume (Units) Analysis, 2020 to 2024
    • Current and Future Market Size Value (USD Million) & Volume (Units) Projections, 2025 to 2035
      • Y-o-Y Growth Trend Analysis
      • Absolute $ Opportunity Analysis
  5. Global Market Analysis 2020 to 2024 and Forecast 2025 to 2035, By Skin Type
    • Introduction / Key Findings
    • Historical Market Size Value (USD Million) & Volume (Units) Analysis By Skin Type, 2020 to 2024
    • Current and Future Market Size Value (USD Million) & Volume (Units) Analysis and Forecast By Skin Type, 2025 to 2035
      • Oily
      • Combination
      • Dry
      • Normal
      • Sensitive
    • Y-o-Y Growth Trend Analysis By Skin Type, 2020 to 2024
    • Absolute $ Opportunity Analysis By Skin Type, 2025 to 2035
  6. Global Market Analysis 2020 to 2024 and Forecast 2025 to 2035, By Skin Concern
    • Introduction / Key Findings
    • Historical Market Size Value (USD Million) & Volume (Units) Analysis By Skin Concern, 2020 to 2024
    • Current and Future Market Size Value (USD Million) & Volume (Units) Analysis and Forecast By Skin Concern, 2025 to 2035
      • Hydration
      • Sensitivity/soothing
      • Brightening/dark spots
      • Pore/blackhead care
      • Anti-aging/firming
    • Y-o-Y Growth Trend Analysis By Skin Concern, 2020 to 2024
    • Absolute $ Opportunity Analysis By Skin Concern, 2025 to 2035
  7. Global Market Analysis 2020 to 2024 and Forecast 2025 to 2035, By Ingredient Actives
    • Introduction / Key Findings
    • Historical Market Size Value (USD Million) & Volume (Units) Analysis By Ingredient Actives, 2020 to 2024
    • Current and Future Market Size Value (USD Million) & Volume (Units) Analysis and Forecast By Ingredient Actives, 2025 to 2035
      • Hyaluronic acid
      • Aloe vera
      • Centella (Cica)
      • Heartleaf (Houttuynia)
      • Niacinamide
      • Green tea
      • Vitamin C
    • Y-o-Y Growth Trend Analysis By Ingredient Actives, 2020 to 2024
    • Absolute $ Opportunity Analysis By Ingredient Actives, 2025 to 2035
  8. Global Market Analysis 2020 to 2024 and Forecast 2025 to 2035, By Texture / Finish
    • Introduction / Key Findings
    • Historical Market Size Value (USD Million) & Volume (Units) Analysis By Texture / Finish, 2020 to 2024
    • Current and Future Market Size Value (USD Million) & Volume (Units) Analysis and Forecast By Texture / Finish, 2025 to 2035
      • Jelly-to-mist (gelified, micro-mist)
      • Watery-jelly (bouncy, quick-set)
      • Essence-jelly (rich, dewy)
    • Y-o-Y Growth Trend Analysis By Texture / Finish, 2020 to 2024
    • Absolute $ Opportunity Analysis By Texture / Finish, 2025 to 2035
  9. Global Market Analysis 2020 to 2024 and Forecast 2025 to 2035, By Packaging / Dispensing
    • Introduction / Key Findings
    • Historical Market Size Value (USD Million) & Volume (Units) Analysis By Packaging / Dispensing, 2020 to 2024
    • Current and Future Market Size Value (USD Million) & Volume (Units) Analysis and Forecast By Packaging / Dispensing, 2025 to 2035
      • Fine mist pump (aerosol-free)
      • Standard pump / trigger
      • Refillable pack
    • Y-o-Y Growth Trend Analysis By Packaging / Dispensing, 2020 to 2024
    • Absolute $ Opportunity Analysis By Packaging / Dispensing, 2025 to 2035
  10. Global Market Analysis 2020 to 2024 and Forecast 2025 to 2035, By Distribution Channel
    • Introduction / Key Findings
    • Historical Market Size Value (USD Million) & Volume (Units) Analysis By Distribution Channel, 2020 to 2024
    • Current and Future Market Size Value (USD Million) & Volume (Units) Analysis and Forecast By Distribution Channel, 2025 to 2035
      • Offline Retailers
      • Online Retailers
    • Y-o-Y Growth Trend Analysis By Distribution Channel, 2020 to 2024
    • Absolute $ Opportunity Analysis By Distribution Channel, 2025 to 2035
  11. Global Market Analysis 2020 to 2024 and Forecast 2025 to 2035, By Region
    • Introduction
    • Historical Market Size Value (USD Million) & Volume (Units) Analysis By Region, 2020 to 2024
    • Current Market Size Value (USD Million) & Volume (Units) Analysis and Forecast By Region, 2025 to 2035
      • North America
      • Latin America
      • Europe
      • East Asia
      • South Asia & Pacific
      • Middle East and Africa
    • Market Attractiveness Analysis By Region
  12. North America Market Analysis 2020 to 2024 and Forecast 2025 to 2035, By Country
    • Historical Market Size Value (USD Million) & Volume (Units) Trend Analysis By Market Taxonomy, 2020 to 2024
    • Market Size Value (USD Million) & Volume (Units) Forecast By Market Taxonomy, 2025 to 2035
      • By Country
        • USA
        • Canada
      • By Skin Type
      • By Skin Concern
      • By Ingredient Actives
      • By Texture / Finish
      • By Packaging / Dispensing
      • By Distribution Channel
    • Market Attractiveness Analysis
      • By Country
      • By Skin Type
      • By Skin Concern
      • By Ingredient Actives
      • By Texture / Finish
      • By Packaging / Dispensing
      • By Distribution Channel
    • Key Takeaways
  13. Latin America Market Analysis 2020 to 2024 and Forecast 2025 to 2035, By Country
    • Historical Market Size Value (USD Million) & Volume (Units) Trend Analysis By Market Taxonomy, 2020 to 2024
    • Market Size Value (USD Million) & Volume (Units) Forecast By Market Taxonomy, 2025 to 2035
      • By Country
        • Brazil
        • Mexico
        • Colombia
        • Rest of Latin America
      • By Skin Type
      • By Skin Concern
      • By Ingredient Actives
      • By Texture / Finish
      • By Packaging / Dispensing
      • By Distribution Channel
    • Market Attractiveness Analysis
      • By Country
      • By Skin Type
      • By Skin Concern
      • By Ingredient Actives
      • By Texture / Finish
      • By Packaging / Dispensing
      • By Distribution Channel
    • Key Takeaways
  14. Europe Market Analysis 2020 to 2024 and Forecast 2025 to 2035, By Country
    • Historical Market Size Value (USD Million) & Volume (Units) Trend Analysis By Market Taxonomy, 2020 to 2024
    • Market Size Value (USD Million) & Volume (Units) Forecast By Market Taxonomy, 2025 to 2035
      • By Country
        • Germany
        • UK
        • France
        • Italy
        • Spain
        • Belgium
        • Netherlands
        • Nordic
        • Switzerland
        • Russia
        • Poland
        • Rest of Europe
      • By Skin Type
      • By Skin Concern
      • By Ingredient Actives
      • By Texture / Finish
      • By Packaging / Dispensing
      • By Distribution Channel
    • Market Attractiveness Analysis
      • By Country
      • By Skin Type
      • By Skin Concern
      • By Ingredient Actives
      • By Texture / Finish
      • By Packaging / Dispensing
      • By Distribution Channel
    • Key Takeaways
  15. East Asia Market Analysis 2020 to 2024 and Forecast 2025 to 2035, By Country
    • Historical Market Size Value (USD Million) & Volume (Units) Trend Analysis By Market Taxonomy, 2020 to 2024
    • Market Size Value (USD Million) & Volume (Units) Forecast By Market Taxonomy, 2025 to 2035
      • By Country
        • China
        • Japan
        • South Korea
      • By Skin Type
      • By Skin Concern
      • By Ingredient Actives
      • By Texture / Finish
      • By Packaging / Dispensing
      • By Distribution Channel
    • Market Attractiveness Analysis
      • By Country
      • By Skin Type
      • By Skin Concern
      • By Ingredient Actives
      • By Texture / Finish
      • By Packaging / Dispensing
      • By Distribution Channel
    • Key Takeaways
  16. South Asia & Pacific Market Analysis 2020 to 2024 and Forecast 2025 to 2035, By Country
    • Historical Market Size Value (USD Million) & Volume (Units) Trend Analysis By Market Taxonomy, 2020 to 2024
    • Market Size Value (USD Million) & Volume (Units) Forecast By Market Taxonomy, 2025 to 2035
      • By Country
        • India
        • Thailand
        • Malaysia
        • Indonesia
        • Singapore
        • Vietnam
        • Australia
        • New Zealand
        • Rest of South Asia
      • By Skin Type
      • By Skin Concern
      • By Ingredient Actives
      • By Texture / Finish
      • By Packaging / Dispensing
      • By Distribution Channel
    • Market Attractiveness Analysis
      • By Country
      • By Skin Type
      • By Skin Concern
      • By Ingredient Actives
      • By Texture / Finish
      • By Packaging / Dispensing
      • By Distribution Channel
    • Key Takeaways
  17. Middle East and Africa Market Analysis 2020 to 2024 and Forecast 2025 to 2035, By Country
    • Historical Market Size Value (USD Million) & Volume (Units) Trend Analysis By Market Taxonomy, 2020 to 2024
    • Market Size Value (USD Million) & Volume (Units) Forecast By Market Taxonomy, 2025 to 2035
      • By Country
        • Turkey
        • UAE
        • Saudi Arabia
        • Israel
        • Other GCC Countries
        • North Africa
        • South Africa
      • By Skin Type
      • By Skin Concern
      • By Ingredient Actives
      • By Texture / Finish
      • By Packaging / Dispensing
      • By Distribution Channel
    • Market Attractiveness Analysis
      • By Country
      • By Skin Type
      • By Skin Concern
      • By Ingredient Actives
      • By Texture / Finish
      • By Packaging / Dispensing
      • By Distribution Channel
    • Key Takeaways
  18. Key Countries Market Analysis
    • USA
      • Pricing Analysis
      • Market Share Analysis, 2024
        • By Skin Type
        • By Skin Concern
        • By Ingredient Actives
        • By Texture / Finish
        • By Packaging / Dispensing
        • By Distribution Channel
    • Canada
      • Pricing Analysis
      • Market Share Analysis, 2024
        • By Skin Type
        • By Skin Concern
        • By Ingredient Actives
        • By Texture / Finish
        • By Packaging / Dispensing
        • By Distribution Channel
    • Brazil
      • Pricing Analysis
      • Market Share Analysis, 2024
        • By Skin Type
        • By Skin Concern
        • By Ingredient Actives
        • By Texture / Finish
        • By Packaging / Dispensing
        • By Distribution Channel
    • Mexico
      • Pricing Analysis
      • Market Share Analysis, 2024
        • By Skin Type
        • By Skin Concern
        • By Ingredient Actives
        • By Texture / Finish
        • By Packaging / Dispensing
        • By Distribution Channel
    • Colombia
      • Pricing Analysis
      • Market Share Analysis, 2024
        • By Skin Type
        • By Skin Concern
        • By Ingredient Actives
        • By Texture / Finish
        • By Packaging / Dispensing
        • By Distribution Channel
    • Germany
      • Pricing Analysis
      • Market Share Analysis, 2024
        • By Skin Type
        • By Skin Concern
        • By Ingredient Actives
        • By Texture / Finish
        • By Packaging / Dispensing
        • By Distribution Channel
    • UK
      • Pricing Analysis
      • Market Share Analysis, 2024
        • By Skin Type
        • By Skin Concern
        • By Ingredient Actives
        • By Texture / Finish
        • By Packaging / Dispensing
        • By Distribution Channel
    • France
      • Pricing Analysis
      • Market Share Analysis, 2024
        • By Skin Type
        • By Skin Concern
        • By Ingredient Actives
        • By Texture / Finish
        • By Packaging / Dispensing
        • By Distribution Channel
    • Italy
      • Pricing Analysis
      • Market Share Analysis, 2024
        • By Skin Type
        • By Skin Concern
        • By Ingredient Actives
        • By Texture / Finish
        • By Packaging / Dispensing
        • By Distribution Channel
    • Spain
      • Pricing Analysis
      • Market Share Analysis, 2024
        • By Skin Type
        • By Skin Concern
        • By Ingredient Actives
        • By Texture / Finish
        • By Packaging / Dispensing
        • By Distribution Channel
    • Belgium
      • Pricing Analysis
      • Market Share Analysis, 2024
        • By Skin Type
        • By Skin Concern
        • By Ingredient Actives
        • By Texture / Finish
        • By Packaging / Dispensing
        • By Distribution Channel
    • Netherlands
      • Pricing Analysis
      • Market Share Analysis, 2024
        • By Skin Type
        • By Skin Concern
        • By Ingredient Actives
        • By Texture / Finish
        • By Packaging / Dispensing
        • By Distribution Channel
    • Nordic
      • Pricing Analysis
      • Market Share Analysis, 2024
        • By Skin Type
        • By Skin Concern
        • By Ingredient Actives
        • By Texture / Finish
        • By Packaging / Dispensing
        • By Distribution Channel
    • Switzerland
      • Pricing Analysis
      • Market Share Analysis, 2024
        • By Skin Type
        • By Skin Concern
        • By Ingredient Actives
        • By Texture / Finish
        • By Packaging / Dispensing
        • By Distribution Channel
    • Russia
      • Pricing Analysis
      • Market Share Analysis, 2024
        • By Skin Type
        • By Skin Concern
        • By Ingredient Actives
        • By Texture / Finish
        • By Packaging / Dispensing
        • By Distribution Channel
    • Poland
      • Pricing Analysis
      • Market Share Analysis, 2024
        • By Skin Type
        • By Skin Concern
        • By Ingredient Actives
        • By Texture / Finish
        • By Packaging / Dispensing
        • By Distribution Channel
    • China
      • Pricing Analysis
      • Market Share Analysis, 2024
        • By Skin Type
        • By Skin Concern
        • By Ingredient Actives
        • By Texture / Finish
        • By Packaging / Dispensing
        • By Distribution Channel
    • Japan
      • Pricing Analysis
      • Market Share Analysis, 2024
        • By Skin Type
        • By Skin Concern
        • By Ingredient Actives
        • By Texture / Finish
        • By Packaging / Dispensing
        • By Distribution Channel
    • South Korea
      • Pricing Analysis
      • Market Share Analysis, 2024
        • By Skin Type
        • By Skin Concern
        • By Ingredient Actives
        • By Texture / Finish
        • By Packaging / Dispensing
        • By Distribution Channel
    • India
      • Pricing Analysis
      • Market Share Analysis, 2024
        • By Skin Type
        • By Skin Concern
        • By Ingredient Actives
        • By Texture / Finish
        • By Packaging / Dispensing
        • By Distribution Channel
    • Thailand
      • Pricing Analysis
      • Market Share Analysis, 2024
        • By Skin Type
        • By Skin Concern
        • By Ingredient Actives
        • By Texture / Finish
        • By Packaging / Dispensing
        • By Distribution Channel
    • Indonesia
      • Pricing Analysis
      • Market Share Analysis, 2024
        • By Skin Type
        • By Skin Concern
        • By Ingredient Actives
        • By Texture / Finish
        • By Packaging / Dispensing
        • By Distribution Channel
    • Australia
      • Pricing Analysis
      • Market Share Analysis, 2024
        • By Skin Type
        • By Skin Concern
        • By Ingredient Actives
        • By Texture / Finish
        • By Packaging / Dispensing
        • By Distribution Channel
    • New Zealand
      • Pricing Analysis
      • Market Share Analysis, 2024
        • By Skin Type
        • By Skin Concern
        • By Ingredient Actives
        • By Texture / Finish
        • By Packaging / Dispensing
        • By Distribution Channel
    • Turkey
      • Pricing Analysis
      • Market Share Analysis, 2024
        • By Skin Type
        • By Skin Concern
        • By Ingredient Actives
        • By Texture / Finish
        • By Packaging / Dispensing
        • By Distribution Channel
    • UAE
      • Pricing Analysis
      • Market Share Analysis, 2024
        • By Skin Type
        • By Skin Concern
        • By Ingredient Actives
        • By Texture / Finish
        • By Packaging / Dispensing
        • By Distribution Channel
    • Saudi Arabia
      • Pricing Analysis
      • Market Share Analysis, 2024
        • By Skin Type
        • By Skin Concern
        • By Ingredient Actives
        • By Texture / Finish
        • By Packaging / Dispensing
        • By Distribution Channel
    • Israel
      • Pricing Analysis
      • Market Share Analysis, 2024
        • By Skin Type
        • By Skin Concern
        • By Ingredient Actives
        • By Texture / Finish
        • By Packaging / Dispensing
        • By Distribution Channel
    • North Africa
      • Pricing Analysis
      • Market Share Analysis, 2024
        • By Skin Type
        • By Skin Concern
        • By Ingredient Actives
        • By Texture / Finish
        • By Packaging / Dispensing
        • By Distribution Channel
    • South Africa
      • Pricing Analysis
      • Market Share Analysis, 2024
        • By Skin Type
        • By Skin Concern
        • By Ingredient Actives
        • By Texture / Finish
        • By Packaging / Dispensing
        • By Distribution Channel
  19. Market Structure Analysis
    • Competition Dashboard
    • Competition Benchmarking
    • Market Share Analysis of Top Players
      • By Regional
      • By Skin Type
      • By Skin Concern
      • By Ingredient Actives
      • By Texture / Finish
      • By Packaging / Dispensing
      • By Distribution Channel
  20. Competition Analysis
    • Competition Deep Dive
      • Nature Republic
        • Overview
        • Product Portfolio
        • Profitability by Market Segments (Product/Age /Sales Channel/Region)
        • Sales Footprint
        • Strategy Overview
          • Marketing Strategy
          • Product Strategy
          • Channel Strategy
      • Holika Holika
        • Overview
        • Product Portfolio
        • Profitability by Market Segments (Product/Age /Sales Channel/Region)
        • Sales Footprint
        • Strategy Overview
          • Marketing Strategy
          • Product Strategy
          • Channel Strategy
      • VT Cosmetics
        • Overview
        • Product Portfolio
        • Profitability by Market Segments (Product/Age /Sales Channel/Region)
        • Sales Footprint
        • Strategy Overview
          • Marketing Strategy
          • Product Strategy
          • Channel Strategy
      • Some By Mi
        • Overview
        • Product Portfolio
        • Profitability by Market Segments (Product/Age /Sales Channel/Region)
        • Sales Footprint
        • Strategy Overview
          • Marketing Strategy
          • Product Strategy
          • Channel Strategy
      • Innisfree
        • Overview
        • Product Portfolio
        • Profitability by Market Segments (Product/Age /Sales Channel/Region)
        • Sales Footprint
        • Strategy Overview
          • Marketing Strategy
          • Product Strategy
          • Channel Strategy
      • Etude
        • Overview
        • Product Portfolio
        • Profitability by Market Segments (Product/Age /Sales Channel/Region)
        • Sales Footprint
        • Strategy Overview
          • Marketing Strategy
          • Product Strategy
          • Channel Strategy
      • The Face Shop
        • Overview
        • Product Portfolio
        • Profitability by Market Segments (Product/Age /Sales Channel/Region)
        • Sales Footprint
        • Strategy Overview
          • Marketing Strategy
          • Product Strategy
          • Channel Strategy
      • TonyMoly
        • Overview
        • Product Portfolio
        • Profitability by Market Segments (Product/Age /Sales Channel/Region)
        • Sales Footprint
        • Strategy Overview
          • Marketing Strategy
          • Product Strategy
          • Channel Strategy
      • Peripera
        • Overview
        • Product Portfolio
        • Profitability by Market Segments (Product/Age /Sales Channel/Region)
        • Sales Footprint
        • Strategy Overview
          • Marketing Strategy
          • Product Strategy
          • Channel Strategy
      • 3CE (Stylenanda)
        • Overview
        • Product Portfolio
        • Profitability by Market Segments (Product/Age /Sales Channel/Region)
        • Sales Footprint
        • Strategy Overview
          • Marketing Strategy
          • Product Strategy
          • Channel Strategy
  21. Assumptions & Acronyms Used
  22. Research Methodology

List of Tables

  • Table 1: Global Market Value (USD Million) Forecast by Region, 2020-2035
  • Table 2: Global Market Volume (Units) Forecast by Region, 2020-2035
  • Table 3: Global Market Value (USD Million) Forecast by Skin Type, 2020-2035
  • Table 4: Global Market Volume (Units) Forecast by Skin Type, 2020-2035
  • Table 5: Global Market Value (USD Million) Forecast by Skin Concern, 2020-2035
  • Table 6: Global Market Volume (Units) Forecast by Skin Concern, 2020-2035
  • Table 7: Global Market Value (USD Million) Forecast by Ingredient Actives, 2020-2035
  • Table 8: Global Market Volume (Units) Forecast by Ingredient Actives, 2020-2035
  • Table 9: Global Market Value (USD Million) Forecast by Texture / Finish, 2020-2035
  • Table 10: Global Market Volume (Units) Forecast by Texture / Finish, 2020-2035
  • Table 11: Global Market Value (USD Million) Forecast by Packaging / Dispensing, 2020-2035
  • Table 12: Global Market Volume (Units) Forecast by Packaging / Dispensing, 2020-2035
  • Table 13: Global Market Value (USD Million) Forecast by Distribution Channel, 2020-2035
  • Table 14: Global Market Volume (Units) Forecast by Distribution Channel, 2020-2035
  • Table 15: North America Market Value (USD Million) Forecast by Country, 2020-2035
  • Table 16: North America Market Volume (Units) Forecast by Country, 2020-2035
  • Table 17: North America Market Value (USD Million) Forecast by Skin Type, 2020-2035
  • Table 18: North America Market Volume (Units) Forecast by Skin Type, 2020-2035
  • Table 19: North America Market Value (USD Million) Forecast by Skin Concern, 2020-2035
  • Table 20: North America Market Volume (Units) Forecast by Skin Concern, 2020-2035
  • Table 21: North America Market Value (USD Million) Forecast by Ingredient Actives, 2020-2035
  • Table 22: North America Market Volume (Units) Forecast by Ingredient Actives, 2020-2035
  • Table 23: North America Market Value (USD Million) Forecast by Texture / Finish, 2020-2035
  • Table 24: North America Market Volume (Units) Forecast by Texture / Finish, 2020-2035
  • Table 25: North America Market Value (USD Million) Forecast by Packaging / Dispensing, 2020-2035
  • Table 26: North America Market Volume (Units) Forecast by Packaging / Dispensing, 2020-2035
  • Table 27: North America Market Value (USD Million) Forecast by Distribution Channel, 2020-2035
  • Table 28: North America Market Volume (Units) Forecast by Distribution Channel, 2020-2035
  • Table 29: Latin America Market Value (USD Million) Forecast by Country, 2020-2035
  • Table 30: Latin America Market Volume (Units) Forecast by Country, 2020-2035
  • Table 31: Latin America Market Value (USD Million) Forecast by Skin Type, 2020-2035
  • Table 32: Latin America Market Volume (Units) Forecast by Skin Type, 2020-2035
  • Table 33: Latin America Market Value (USD Million) Forecast by Skin Concern, 2020-2035
  • Table 34: Latin America Market Volume (Units) Forecast by Skin Concern, 2020-2035
  • Table 35: Latin America Market Value (USD Million) Forecast by Ingredient Actives, 2020-2035
  • Table 36: Latin America Market Volume (Units) Forecast by Ingredient Actives, 2020-2035
  • Table 37: Latin America Market Value (USD Million) Forecast by Texture / Finish, 2020-2035
  • Table 38: Latin America Market Volume (Units) Forecast by Texture / Finish, 2020-2035
  • Table 39: Latin America Market Value (USD Million) Forecast by Packaging / Dispensing, 2020-2035
  • Table 40: Latin America Market Volume (Units) Forecast by Packaging / Dispensing, 2020-2035
  • Table 41: Latin America Market Value (USD Million) Forecast by Distribution Channel, 2020-2035
  • Table 42: Latin America Market Volume (Units) Forecast by Distribution Channel, 2020-2035
  • Table 43: Europe Market Value (USD Million) Forecast by Country, 2020-2035
  • Table 44: Europe Market Volume (Units) Forecast by Country, 2020-2035
  • Table 45: Europe Market Value (USD Million) Forecast by Skin Type, 2020-2035
  • Table 46: Europe Market Volume (Units) Forecast by Skin Type, 2020-2035
  • Table 47: Europe Market Value (USD Million) Forecast by Skin Concern, 2020-2035
  • Table 48: Europe Market Volume (Units) Forecast by Skin Concern, 2020-2035
  • Table 49: Europe Market Value (USD Million) Forecast by Ingredient Actives, 2020-2035
  • Table 50: Europe Market Volume (Units) Forecast by Ingredient Actives, 2020-2035
  • Table 51: Europe Market Value (USD Million) Forecast by Texture / Finish, 2020-2035
  • Table 52: Europe Market Volume (Units) Forecast by Texture / Finish, 2020-2035
  • Table 53: Europe Market Value (USD Million) Forecast by Packaging / Dispensing, 2020-2035
  • Table 54: Europe Market Volume (Units) Forecast by Packaging / Dispensing, 2020-2035
  • Table 55: Europe Market Value (USD Million) Forecast by Distribution Channel, 2020-2035
  • Table 56: Europe Market Volume (Units) Forecast by Distribution Channel, 2020-2035
  • Table 57: East Asia Market Value (USD Million) Forecast by Country, 2020-2035
  • Table 58: East Asia Market Volume (Units) Forecast by Country, 2020-2035
  • Table 59: East Asia Market Value (USD Million) Forecast by Skin Type, 2020-2035
  • Table 60: East Asia Market Volume (Units) Forecast by Skin Type, 2020-2035
  • Table 61: East Asia Market Value (USD Million) Forecast by Skin Concern, 2020-2035
  • Table 62: East Asia Market Volume (Units) Forecast by Skin Concern, 2020-2035
  • Table 63: East Asia Market Value (USD Million) Forecast by Ingredient Actives, 2020-2035
  • Table 64: East Asia Market Volume (Units) Forecast by Ingredient Actives, 2020-2035
  • Table 65: East Asia Market Value (USD Million) Forecast by Texture / Finish, 2020-2035
  • Table 66: East Asia Market Volume (Units) Forecast by Texture / Finish, 2020-2035
  • Table 67: East Asia Market Value (USD Million) Forecast by Packaging / Dispensing, 2020-2035
  • Table 68: East Asia Market Volume (Units) Forecast by Packaging / Dispensing, 2020-2035
  • Table 69: East Asia Market Value (USD Million) Forecast by Distribution Channel, 2020-2035
  • Table 70: East Asia Market Volume (Units) Forecast by Distribution Channel, 2020-2035
  • Table 71: South Asia & Pacific Market Value (USD Million) Forecast by Country, 2020-2035
  • Table 72: South Asia & Pacific Market Volume (Units) Forecast by Country, 2020-2035
  • Table 73: South Asia & Pacific Market Value (USD Million) Forecast by Skin Type, 2020-2035
  • Table 74: South Asia & Pacific Market Volume (Units) Forecast by Skin Type, 2020-2035
  • Table 75: South Asia & Pacific Market Value (USD Million) Forecast by Skin Concern, 2020-2035
  • Table 76: South Asia & Pacific Market Volume (Units) Forecast by Skin Concern, 2020-2035
  • Table 77: South Asia & Pacific Market Value (USD Million) Forecast by Ingredient Actives, 2020-2035
  • Table 78: South Asia & Pacific Market Volume (Units) Forecast by Ingredient Actives, 2020-2035
  • Table 79: South Asia & Pacific Market Value (USD Million) Forecast by Texture / Finish, 2020-2035
  • Table 80: South Asia & Pacific Market Volume (Units) Forecast by Texture / Finish, 2020-2035
  • Table 81: South Asia & Pacific Market Value (USD Million) Forecast by Packaging / Dispensing, 2020-2035
  • Table 82: South Asia & Pacific Market Volume (Units) Forecast by Packaging / Dispensing, 2020-2035
  • Table 83: South Asia & Pacific Market Value (USD Million) Forecast by Distribution Channel, 2020-2035
  • Table 84: South Asia & Pacific Market Volume (Units) Forecast by Distribution Channel, 2020-2035
  • Table 85: Middle East and Africa Market Value (USD Million) Forecast by Country, 2020-2035
  • Table 86: Middle East and Africa Market Volume (Units) Forecast by Country, 2020-2035
  • Table 87: Middle East and Africa Market Value (USD Million) Forecast by Skin Type, 2020-2035
  • Table 88: Middle East and Africa Market Volume (Units) Forecast by Skin Type, 2020-2035
  • Table 89: Middle East and Africa Market Value (USD Million) Forecast by Skin Concern, 2020-2035
  • Table 90: Middle East and Africa Market Volume (Units) Forecast by Skin Concern, 2020-2035
  • Table 91: Middle East and Africa Market Value (USD Million) Forecast by Ingredient Actives, 2020-2035
  • Table 92: Middle East and Africa Market Volume (Units) Forecast by Ingredient Actives, 2020-2035
  • Table 93: Middle East and Africa Market Value (USD Million) Forecast by Texture / Finish, 2020-2035
  • Table 94: Middle East and Africa Market Volume (Units) Forecast by Texture / Finish, 2020-2035
  • Table 95: Middle East and Africa Market Value (USD Million) Forecast by Packaging / Dispensing, 2020-2035
  • Table 96: Middle East and Africa Market Volume (Units) Forecast by Packaging / Dispensing, 2020-2035
  • Table 97: Middle East and Africa Market Value (USD Million) Forecast by Distribution Channel, 2020-2035
  • Table 98: Middle East and Africa Market Volume (Units) Forecast by Distribution Channel, 2020-2035

List of Figures

  • Figure 1: Global Market Value (USD Million) by Skin Type, 2025-2035
  • Figure 2: Global Market Value (USD Million) by Skin Concern, 2025-2035
  • Figure 3: Global Market Value (USD Million) by Ingredient Actives, 2025-2035
  • Figure 4: Global Market Value (USD Million) by Texture / Finish, 2025-2035
  • Figure 5: Global Market Value (USD Million) by Packaging / Dispensing, 2025-2035
  • Figure 6: Global Market Value (USD Million) by Distribution Channel, 2025-2035
  • Figure 7: Global Market Value (USD Million) by Region, 2025-2035
  • Figure 8: Global Market Value (USD Million) Analysis by Region, 2020-2035
  • Figure 9: Global Market Volume (Units) Analysis by Region, 2020-2035
  • Figure 10: Global Market Value Share (%) and BPS Analysis by Region, 2025-2035
  • Figure 11: Global Market Y-o-Y Growth (%) Projections by Region, 2025-2035
  • Figure 12: Global Market Value (USD Million) Analysis by Skin Type, 2020-2035
  • Figure 13: Global Market Volume (Units) Analysis by Skin Type, 2020-2035
  • Figure 14: Global Market Value Share (%) and BPS Analysis by Skin Type, 2025-2035
  • Figure 15: Global Market Y-o-Y Growth (%) Projections by Skin Type, 2025-2035
  • Figure 16: Global Market Value (USD Million) Analysis by Skin Concern, 2020-2035
  • Figure 17: Global Market Volume (Units) Analysis by Skin Concern, 2020-2035
  • Figure 18: Global Market Value Share (%) and BPS Analysis by Skin Concern, 2025-2035
  • Figure 19: Global Market Y-o-Y Growth (%) Projections by Skin Concern, 2025-2035
  • Figure 20: Global Market Value (USD Million) Analysis by Ingredient Actives, 2020-2035
  • Figure 21: Global Market Volume (Units) Analysis by Ingredient Actives, 2020-2035
  • Figure 22: Global Market Value Share (%) and BPS Analysis by Ingredient Actives, 2025-2035
  • Figure 23: Global Market Y-o-Y Growth (%) Projections by Ingredient Actives, 2025-2035
  • Figure 24: Global Market Value (USD Million) Analysis by Texture / Finish, 2020-2035
  • Figure 25: Global Market Volume (Units) Analysis by Texture / Finish, 2020-2035
  • Figure 26: Global Market Value Share (%) and BPS Analysis by Texture / Finish, 2025-2035
  • Figure 27: Global Market Y-o-Y Growth (%) Projections by Texture / Finish, 2025-2035
  • Figure 28: Global Market Value (USD Million) Analysis by Packaging / Dispensing, 2020-2035
  • Figure 29: Global Market Volume (Units) Analysis by Packaging / Dispensing, 2020-2035
  • Figure 30: Global Market Value Share (%) and BPS Analysis by Packaging / Dispensing, 2025-2035
  • Figure 31: Global Market Y-o-Y Growth (%) Projections by Packaging / Dispensing, 2025-2035
  • Figure 32: Global Market Value (USD Million) Analysis by Distribution Channel, 2020-2035
  • Figure 33: Global Market Volume (Units) Analysis by Distribution Channel, 2020-2035
  • Figure 34: Global Market Value Share (%) and BPS Analysis by Distribution Channel, 2025-2035
  • Figure 35: Global Market Y-o-Y Growth (%) Projections by Distribution Channel, 2025-2035
  • Figure 36: Global Market Attractiveness by Skin Type, 2025-2035
  • Figure 37: Global Market Attractiveness by Skin Concern, 2025-2035
  • Figure 38: Global Market Attractiveness by Ingredient Actives, 2025-2035
  • Figure 39: Global Market Attractiveness by Texture / Finish, 2025-2035
  • Figure 40: Global Market Attractiveness by Packaging / Dispensing, 2025-2035
  • Figure 41: Global Market Attractiveness by Distribution Channel, 2025-2035
  • Figure 42: Global Market Attractiveness by Region, 2025-2035
  • Figure 43: North America Market Value (USD Million) by Skin Type, 2025-2035
  • Figure 44: North America Market Value (USD Million) by Skin Concern, 2025-2035
  • Figure 45: North America Market Value (USD Million) by Ingredient Actives, 2025-2035
  • Figure 46: North America Market Value (USD Million) by Texture / Finish, 2025-2035
  • Figure 47: North America Market Value (USD Million) by Packaging / Dispensing, 2025-2035
  • Figure 48: North America Market Value (USD Million) by Distribution Channel, 2025-2035
  • Figure 49: North America Market Value (USD Million) by Country, 2025-2035
  • Figure 50: North America Market Value (USD Million) Analysis by Country, 2020-2035
  • Figure 51: North America Market Volume (Units) Analysis by Country, 2020-2035
  • Figure 52: North America Market Value Share (%) and BPS Analysis by Country, 2025-2035
  • Figure 53: North America Market Y-o-Y Growth (%) Projections by Country, 2025-2035
  • Figure 54: North America Market Value (USD Million) Analysis by Skin Type, 2020-2035
  • Figure 55: North America Market Volume (Units) Analysis by Skin Type, 2020-2035
  • Figure 56: North America Market Value Share (%) and BPS Analysis by Skin Type, 2025-2035
  • Figure 57: North America Market Y-o-Y Growth (%) Projections by Skin Type, 2025-2035
  • Figure 58: North America Market Value (USD Million) Analysis by Skin Concern, 2020-2035
  • Figure 59: North America Market Volume (Units) Analysis by Skin Concern, 2020-2035
  • Figure 60: North America Market Value Share (%) and BPS Analysis by Skin Concern, 2025-2035
  • Figure 61: North America Market Y-o-Y Growth (%) Projections by Skin Concern, 2025-2035
  • Figure 62: North America Market Value (USD Million) Analysis by Ingredient Actives, 2020-2035
  • Figure 63: North America Market Volume (Units) Analysis by Ingredient Actives, 2020-2035
  • Figure 64: North America Market Value Share (%) and BPS Analysis by Ingredient Actives, 2025-2035
  • Figure 65: North America Market Y-o-Y Growth (%) Projections by Ingredient Actives, 2025-2035
  • Figure 66: North America Market Value (USD Million) Analysis by Texture / Finish, 2020-2035
  • Figure 67: North America Market Volume (Units) Analysis by Texture / Finish, 2020-2035
  • Figure 68: North America Market Value Share (%) and BPS Analysis by Texture / Finish, 2025-2035
  • Figure 69: North America Market Y-o-Y Growth (%) Projections by Texture / Finish, 2025-2035
  • Figure 70: North America Market Value (USD Million) Analysis by Packaging / Dispensing, 2020-2035
  • Figure 71: North America Market Volume (Units) Analysis by Packaging / Dispensing, 2020-2035
  • Figure 72: North America Market Value Share (%) and BPS Analysis by Packaging / Dispensing, 2025-2035
  • Figure 73: North America Market Y-o-Y Growth (%) Projections by Packaging / Dispensing, 2025-2035
  • Figure 74: North America Market Value (USD Million) Analysis by Distribution Channel, 2020-2035
  • Figure 75: North America Market Volume (Units) Analysis by Distribution Channel, 2020-2035
  • Figure 76: North America Market Value Share (%) and BPS Analysis by Distribution Channel, 2025-2035
  • Figure 77: North America Market Y-o-Y Growth (%) Projections by Distribution Channel, 2025-2035
  • Figure 78: North America Market Attractiveness by Skin Type, 2025-2035
  • Figure 79: North America Market Attractiveness by Skin Concern, 2025-2035
  • Figure 80: North America Market Attractiveness by Ingredient Actives, 2025-2035
  • Figure 81: North America Market Attractiveness by Texture / Finish, 2025-2035
  • Figure 82: North America Market Attractiveness by Packaging / Dispensing, 2025-2035
  • Figure 83: North America Market Attractiveness by Distribution Channel, 2025-2035
  • Figure 84: North America Market Attractiveness by Country, 2025-2035
  • Figure 85: Latin America Market Value (USD Million) by Skin Type, 2025-2035
  • Figure 86: Latin America Market Value (USD Million) by Skin Concern, 2025-2035
  • Figure 87: Latin America Market Value (USD Million) by Ingredient Actives, 2025-2035
  • Figure 88: Latin America Market Value (USD Million) by Texture / Finish, 2025-2035
  • Figure 89: Latin America Market Value (USD Million) by Packaging / Dispensing, 2025-2035
  • Figure 90: Latin America Market Value (USD Million) by Distribution Channel, 2025-2035
  • Figure 91: Latin America Market Value (USD Million) by Country, 2025-2035
  • Figure 92: Latin America Market Value (USD Million) Analysis by Country, 2020-2035
  • Figure 93: Latin America Market Volume (Units) Analysis by Country, 2020-2035
  • Figure 94: Latin America Market Value Share (%) and BPS Analysis by Country, 2025-2035
  • Figure 95: Latin America Market Y-o-Y Growth (%) Projections by Country, 2025-2035
  • Figure 96: Latin America Market Value (USD Million) Analysis by Skin Type, 2020-2035
  • Figure 97: Latin America Market Volume (Units) Analysis by Skin Type, 2020-2035
  • Figure 98: Latin America Market Value Share (%) and BPS Analysis by Skin Type, 2025-2035
  • Figure 99: Latin America Market Y-o-Y Growth (%) Projections by Skin Type, 2025-2035
  • Figure 100: Latin America Market Value (USD Million) Analysis by Skin Concern, 2020-2035
  • Figure 101: Latin America Market Volume (Units) Analysis by Skin Concern, 2020-2035
  • Figure 102: Latin America Market Value Share (%) and BPS Analysis by Skin Concern, 2025-2035
  • Figure 103: Latin America Market Y-o-Y Growth (%) Projections by Skin Concern, 2025-2035
  • Figure 104: Latin America Market Value (USD Million) Analysis by Ingredient Actives, 2020-2035
  • Figure 105: Latin America Market Volume (Units) Analysis by Ingredient Actives, 2020-2035
  • Figure 106: Latin America Market Value Share (%) and BPS Analysis by Ingredient Actives, 2025-2035
  • Figure 107: Latin America Market Y-o-Y Growth (%) Projections by Ingredient Actives, 2025-2035
  • Figure 108: Latin America Market Value (USD Million) Analysis by Texture / Finish, 2020-2035
  • Figure 109: Latin America Market Volume (Units) Analysis by Texture / Finish, 2020-2035
  • Figure 110: Latin America Market Value Share (%) and BPS Analysis by Texture / Finish, 2025-2035
  • Figure 111: Latin America Market Y-o-Y Growth (%) Projections by Texture / Finish, 2025-2035
  • Figure 112: Latin America Market Value (USD Million) Analysis by Packaging / Dispensing, 2020-2035
  • Figure 113: Latin America Market Volume (Units) Analysis by Packaging / Dispensing, 2020-2035
  • Figure 114: Latin America Market Value Share (%) and BPS Analysis by Packaging / Dispensing, 2025-2035
  • Figure 115: Latin America Market Y-o-Y Growth (%) Projections by Packaging / Dispensing, 2025-2035
  • Figure 116: Latin America Market Value (USD Million) Analysis by Distribution Channel, 2020-2035
  • Figure 117: Latin America Market Volume (Units) Analysis by Distribution Channel, 2020-2035
  • Figure 118: Latin America Market Value Share (%) and BPS Analysis by Distribution Channel, 2025-2035
  • Figure 119: Latin America Market Y-o-Y Growth (%) Projections by Distribution Channel, 2025-2035
  • Figure 120: Latin America Market Attractiveness by Skin Type, 2025-2035
  • Figure 121: Latin America Market Attractiveness by Skin Concern, 2025-2035
  • Figure 122: Latin America Market Attractiveness by Ingredient Actives, 2025-2035
  • Figure 123: Latin America Market Attractiveness by Texture / Finish, 2025-2035
  • Figure 124: Latin America Market Attractiveness by Packaging / Dispensing, 2025-2035
  • Figure 125: Latin America Market Attractiveness by Distribution Channel, 2025-2035
  • Figure 126: Latin America Market Attractiveness by Country, 2025-2035
  • Figure 127: Europe Market Value (USD Million) by Skin Type, 2025-2035
  • Figure 128: Europe Market Value (USD Million) by Skin Concern, 2025-2035
  • Figure 129: Europe Market Value (USD Million) by Ingredient Actives, 2025-2035
  • Figure 130: Europe Market Value (USD Million) by Texture / Finish, 2025-2035
  • Figure 131: Europe Market Value (USD Million) by Packaging / Dispensing, 2025-2035
  • Figure 132: Europe Market Value (USD Million) by Distribution Channel, 2025-2035
  • Figure 133: Europe Market Value (USD Million) by Country, 2025-2035
  • Figure 134: Europe Market Value (USD Million) Analysis by Country, 2020-2035
  • Figure 135: Europe Market Volume (Units) Analysis by Country, 2020-2035
  • Figure 136: Europe Market Value Share (%) and BPS Analysis by Country, 2025-2035
  • Figure 137: Europe Market Y-o-Y Growth (%) Projections by Country, 2025-2035
  • Figure 138: Europe Market Value (USD Million) Analysis by Skin Type, 2020-2035
  • Figure 139: Europe Market Volume (Units) Analysis by Skin Type, 2020-2035
  • Figure 140: Europe Market Value Share (%) and BPS Analysis by Skin Type, 2025-2035
  • Figure 141: Europe Market Y-o-Y Growth (%) Projections by Skin Type, 2025-2035
  • Figure 142: Europe Market Value (USD Million) Analysis by Skin Concern, 2020-2035
  • Figure 143: Europe Market Volume (Units) Analysis by Skin Concern, 2020-2035
  • Figure 144: Europe Market Value Share (%) and BPS Analysis by Skin Concern, 2025-2035
  • Figure 145: Europe Market Y-o-Y Growth (%) Projections by Skin Concern, 2025-2035
  • Figure 146: Europe Market Value (USD Million) Analysis by Ingredient Actives, 2020-2035
  • Figure 147: Europe Market Volume (Units) Analysis by Ingredient Actives, 2020-2035
  • Figure 148: Europe Market Value Share (%) and BPS Analysis by Ingredient Actives, 2025-2035
  • Figure 149: Europe Market Y-o-Y Growth (%) Projections by Ingredient Actives, 2025-2035
  • Figure 150: Europe Market Value (USD Million) Analysis by Texture / Finish, 2020-2035
  • Figure 151: Europe Market Volume (Units) Analysis by Texture / Finish, 2020-2035
  • Figure 152: Europe Market Value Share (%) and BPS Analysis by Texture / Finish, 2025-2035
  • Figure 153: Europe Market Y-o-Y Growth (%) Projections by Texture / Finish, 2025-2035
  • Figure 154: Europe Market Value (USD Million) Analysis by Packaging / Dispensing, 2020-2035
  • Figure 155: Europe Market Volume (Units) Analysis by Packaging / Dispensing, 2020-2035
  • Figure 156: Europe Market Value Share (%) and BPS Analysis by Packaging / Dispensing, 2025-2035
  • Figure 157: Europe Market Y-o-Y Growth (%) Projections by Packaging / Dispensing, 2025-2035
  • Figure 158: Europe Market Value (USD Million) Analysis by Distribution Channel, 2020-2035
  • Figure 159: Europe Market Volume (Units) Analysis by Distribution Channel, 2020-2035
  • Figure 160: Europe Market Value Share (%) and BPS Analysis by Distribution Channel, 2025-2035
  • Figure 161: Europe Market Y-o-Y Growth (%) Projections by Distribution Channel, 2025-2035
  • Figure 162: Europe Market Attractiveness by Skin Type, 2025-2035
  • Figure 163: Europe Market Attractiveness by Skin Concern, 2025-2035
  • Figure 164: Europe Market Attractiveness by Ingredient Actives, 2025-2035
  • Figure 165: Europe Market Attractiveness by Texture / Finish, 2025-2035
  • Figure 166: Europe Market Attractiveness by Packaging / Dispensing, 2025-2035
  • Figure 167: Europe Market Attractiveness by Distribution Channel, 2025-2035
  • Figure 168: Europe Market Attractiveness by Country, 2025-2035
  • Figure 169: East Asia Market Value (USD Million) by Skin Type, 2025-2035
  • Figure 170: East Asia Market Value (USD Million) by Skin Concern, 2025-2035
  • Figure 171: East Asia Market Value (USD Million) by Ingredient Actives, 2025-2035
  • Figure 172: East Asia Market Value (USD Million) by Texture / Finish, 2025-2035
  • Figure 173: East Asia Market Value (USD Million) by Packaging / Dispensing, 2025-2035
  • Figure 174: East Asia Market Value (USD Million) by Distribution Channel, 2025-2035
  • Figure 175: East Asia Market Value (USD Million) by Country, 2025-2035
  • Figure 176: East Asia Market Value (USD Million) Analysis by Country, 2020-2035
  • Figure 177: East Asia Market Volume (Units) Analysis by Country, 2020-2035
  • Figure 178: East Asia Market Value Share (%) and BPS Analysis by Country, 2025-2035
  • Figure 179: East Asia Market Y-o-Y Growth (%) Projections by Country, 2025-2035
  • Figure 180: East Asia Market Value (USD Million) Analysis by Skin Type, 2020-2035
  • Figure 181: East Asia Market Volume (Units) Analysis by Skin Type, 2020-2035
  • Figure 182: East Asia Market Value Share (%) and BPS Analysis by Skin Type, 2025-2035
  • Figure 183: East Asia Market Y-o-Y Growth (%) Projections by Skin Type, 2025-2035
  • Figure 184: East Asia Market Value (USD Million) Analysis by Skin Concern, 2020-2035
  • Figure 185: East Asia Market Volume (Units) Analysis by Skin Concern, 2020-2035
  • Figure 186: East Asia Market Value Share (%) and BPS Analysis by Skin Concern, 2025-2035
  • Figure 187: East Asia Market Y-o-Y Growth (%) Projections by Skin Concern, 2025-2035
  • Figure 188: East Asia Market Value (USD Million) Analysis by Ingredient Actives, 2020-2035
  • Figure 189: East Asia Market Volume (Units) Analysis by Ingredient Actives, 2020-2035
  • Figure 190: East Asia Market Value Share (%) and BPS Analysis by Ingredient Actives, 2025-2035
  • Figure 191: East Asia Market Y-o-Y Growth (%) Projections by Ingredient Actives, 2025-2035
  • Figure 192: East Asia Market Value (USD Million) Analysis by Texture / Finish, 2020-2035
  • Figure 193: East Asia Market Volume (Units) Analysis by Texture / Finish, 2020-2035
  • Figure 194: East Asia Market Value Share (%) and BPS Analysis by Texture / Finish, 2025-2035
  • Figure 195: East Asia Market Y-o-Y Growth (%) Projections by Texture / Finish, 2025-2035
  • Figure 196: East Asia Market Value (USD Million) Analysis by Packaging / Dispensing, 2020-2035
  • Figure 197: East Asia Market Volume (Units) Analysis by Packaging / Dispensing, 2020-2035
  • Figure 198: East Asia Market Value Share (%) and BPS Analysis by Packaging / Dispensing, 2025-2035
  • Figure 199: East Asia Market Y-o-Y Growth (%) Projections by Packaging / Dispensing, 2025-2035
  • Figure 200: East Asia Market Value (USD Million) Analysis by Distribution Channel, 2020-2035
  • Figure 201: East Asia Market Volume (Units) Analysis by Distribution Channel, 2020-2035
  • Figure 202: East Asia Market Value Share (%) and BPS Analysis by Distribution Channel, 2025-2035
  • Figure 203: East Asia Market Y-o-Y Growth (%) Projections by Distribution Channel, 2025-2035
  • Figure 204: East Asia Market Attractiveness by Skin Type, 2025-2035
  • Figure 205: East Asia Market Attractiveness by Skin Concern, 2025-2035
  • Figure 206: East Asia Market Attractiveness by Ingredient Actives, 2025-2035
  • Figure 207: East Asia Market Attractiveness by Texture / Finish, 2025-2035
  • Figure 208: East Asia Market Attractiveness by Packaging / Dispensing, 2025-2035
  • Figure 209: East Asia Market Attractiveness by Distribution Channel, 2025-2035
  • Figure 210: East Asia Market Attractiveness by Country, 2025-2035
  • Figure 211: South Asia & Pacific Market Value (USD Million) by Skin Type, 2025-2035
  • Figure 212: South Asia & Pacific Market Value (USD Million) by Skin Concern, 2025-2035
  • Figure 213: South Asia & Pacific Market Value (USD Million) by Ingredient Actives, 2025-2035
  • Figure 214: South Asia & Pacific Market Value (USD Million) by Texture / Finish, 2025-2035
  • Figure 215: South Asia & Pacific Market Value (USD Million) by Packaging / Dispensing, 2025-2035
  • Figure 216: South Asia & Pacific Market Value (USD Million) by Distribution Channel, 2025-2035
  • Figure 217: South Asia & Pacific Market Value (USD Million) by Country, 2025-2035
  • Figure 218: South Asia & Pacific Market Value (USD Million) Analysis by Country, 2020-2035
  • Figure 219: South Asia & Pacific Market Volume (Units) Analysis by Country, 2020-2035
  • Figure 220: South Asia & Pacific Market Value Share (%) and BPS Analysis by Country, 2025-2035
  • Figure 221: South Asia & Pacific Market Y-o-Y Growth (%) Projections by Country, 2025-2035
  • Figure 222: South Asia & Pacific Market Value (USD Million) Analysis by Skin Type, 2020-2035
  • Figure 223: South Asia & Pacific Market Volume (Units) Analysis by Skin Type, 2020-2035
  • Figure 224: South Asia & Pacific Market Value Share (%) and BPS Analysis by Skin Type, 2025-2035
  • Figure 225: South Asia & Pacific Market Y-o-Y Growth (%) Projections by Skin Type, 2025-2035
  • Figure 226: South Asia & Pacific Market Value (USD Million) Analysis by Skin Concern, 2020-2035
  • Figure 227: South Asia & Pacific Market Volume (Units) Analysis by Skin Concern, 2020-2035
  • Figure 228: South Asia & Pacific Market Value Share (%) and BPS Analysis by Skin Concern, 2025-2035
  • Figure 229: South Asia & Pacific Market Y-o-Y Growth (%) Projections by Skin Concern, 2025-2035
  • Figure 230: South Asia & Pacific Market Value (USD Million) Analysis by Ingredient Actives, 2020-2035
  • Figure 231: South Asia & Pacific Market Volume (Units) Analysis by Ingredient Actives, 2020-2035
  • Figure 232: South Asia & Pacific Market Value Share (%) and BPS Analysis by Ingredient Actives, 2025-2035
  • Figure 233: South Asia & Pacific Market Y-o-Y Growth (%) Projections by Ingredient Actives, 2025-2035
  • Figure 234: South Asia & Pacific Market Value (USD Million) Analysis by Texture / Finish, 2020-2035
  • Figure 235: South Asia & Pacific Market Volume (Units) Analysis by Texture / Finish, 2020-2035
  • Figure 236: South Asia & Pacific Market Value Share (%) and BPS Analysis by Texture / Finish, 2025-2035
  • Figure 237: South Asia & Pacific Market Y-o-Y Growth (%) Projections by Texture / Finish, 2025-2035
  • Figure 238: South Asia & Pacific Market Value (USD Million) Analysis by Packaging / Dispensing, 2020-2035
  • Figure 239: South Asia & Pacific Market Volume (Units) Analysis by Packaging / Dispensing, 2020-2035
  • Figure 240: South Asia & Pacific Market Value Share (%) and BPS Analysis by Packaging / Dispensing, 2025-2035
  • Figure 241: South Asia & Pacific Market Y-o-Y Growth (%) Projections by Packaging / Dispensing, 2025-2035
  • Figure 242: South Asia & Pacific Market Value (USD Million) Analysis by Distribution Channel, 2020-2035
  • Figure 243: South Asia & Pacific Market Volume (Units) Analysis by Distribution Channel, 2020-2035
  • Figure 244: South Asia & Pacific Market Value Share (%) and BPS Analysis by Distribution Channel, 2025-2035
  • Figure 245: South Asia & Pacific Market Y-o-Y Growth (%) Projections by Distribution Channel, 2025-2035
  • Figure 246: South Asia & Pacific Market Attractiveness by Skin Type, 2025-2035
  • Figure 247: South Asia & Pacific Market Attractiveness by Skin Concern, 2025-2035
  • Figure 248: South Asia & Pacific Market Attractiveness by Ingredient Actives, 2025-2035
  • Figure 249: South Asia & Pacific Market Attractiveness by Texture / Finish, 2025-2035
  • Figure 250: South Asia & Pacific Market Attractiveness by Packaging / Dispensing, 2025-2035
  • Figure 251: South Asia & Pacific Market Attractiveness by Distribution Channel, 2025-2035
  • Figure 252: South Asia & Pacific Market Attractiveness by Country, 2025-2035
  • Figure 253: Middle East and Africa Market Value (USD Million) by Skin Type, 2025-2035
  • Figure 254: Middle East and Africa Market Value (USD Million) by Skin Concern, 2025-2035
  • Figure 255: Middle East and Africa Market Value (USD Million) by Ingredient Actives, 2025-2035
  • Figure 256: Middle East and Africa Market Value (USD Million) by Texture / Finish, 2025-2035
  • Figure 257: Middle East and Africa Market Value (USD Million) by Packaging / Dispensing, 2025-2035
  • Figure 258: Middle East and Africa Market Value (USD Million) by Distribution Channel, 2025-2035
  • Figure 259: Middle East and Africa Market Value (USD Million) by Country, 2025-2035
  • Figure 260: Middle East and Africa Market Value (USD Million) Analysis by Country, 2020-2035
  • Figure 261: Middle East and Africa Market Volume (Units) Analysis by Country, 2020-2035
  • Figure 262: Middle East and Africa Market Value Share (%) and BPS Analysis by Country, 2025-2035
  • Figure 263: Middle East and Africa Market Y-o-Y Growth (%) Projections by Country, 2025-2035
  • Figure 264: Middle East and Africa Market Value (USD Million) Analysis by Skin Type, 2020-2035
  • Figure 265: Middle East and Africa Market Volume (Units) Analysis by Skin Type, 2020-2035
  • Figure 266: Middle East and Africa Market Value Share (%) and BPS Analysis by Skin Type, 2025-2035
  • Figure 267: Middle East and Africa Market Y-o-Y Growth (%) Projections by Skin Type, 2025-2035
  • Figure 268: Middle East and Africa Market Value (USD Million) Analysis by Skin Concern, 2020-2035
  • Figure 269: Middle East and Africa Market Volume (Units) Analysis by Skin Concern, 2020-2035
  • Figure 270: Middle East and Africa Market Value Share (%) and BPS Analysis by Skin Concern, 2025-2035
  • Figure 271: Middle East and Africa Market Y-o-Y Growth (%) Projections by Skin Concern, 2025-2035
  • Figure 272: Middle East and Africa Market Value (USD Million) Analysis by Ingredient Actives, 2020-2035
  • Figure 273: Middle East and Africa Market Volume (Units) Analysis by Ingredient Actives, 2020-2035
  • Figure 274: Middle East and Africa Market Value Share (%) and BPS Analysis by Ingredient Actives, 2025-2035
  • Figure 275: Middle East and Africa Market Y-o-Y Growth (%) Projections by Ingredient Actives, 2025-2035
  • Figure 276: Middle East and Africa Market Value (USD Million) Analysis by Texture / Finish, 2020-2035
  • Figure 277: Middle East and Africa Market Volume (Units) Analysis by Texture / Finish, 2020-2035
  • Figure 278: Middle East and Africa Market Value Share (%) and BPS Analysis by Texture / Finish, 2025-2035
  • Figure 279: Middle East and Africa Market Y-o-Y Growth (%) Projections by Texture / Finish, 2025-2035
  • Figure 280: Middle East and Africa Market Value (USD Million) Analysis by Packaging / Dispensing, 2020-2035
  • Figure 281: Middle East and Africa Market Volume (Units) Analysis by Packaging / Dispensing, 2020-2035
  • Figure 282: Middle East and Africa Market Value Share (%) and BPS Analysis by Packaging / Dispensing, 2025-2035
  • Figure 283: Middle East and Africa Market Y-o-Y Growth (%) Projections by Packaging / Dispensing, 2025-2035
  • Figure 284: Middle East and Africa Market Value (USD Million) Analysis by Distribution Channel, 2020-2035
  • Figure 285: Middle East and Africa Market Volume (Units) Analysis by Distribution Channel, 2020-2035
  • Figure 286: Middle East and Africa Market Value Share (%) and BPS Analysis by Distribution Channel, 2025-2035
  • Figure 287: Middle East and Africa Market Y-o-Y Growth (%) Projections by Distribution Channel, 2025-2035
  • Figure 288: Middle East and Africa Market Attractiveness by Skin Type, 2025-2035
  • Figure 289: Middle East and Africa Market Attractiveness by Skin Concern, 2025-2035
  • Figure 290: Middle East and Africa Market Attractiveness by Ingredient Actives, 2025-2035
  • Figure 291: Middle East and Africa Market Attractiveness by Texture / Finish, 2025-2035
  • Figure 292: Middle East and Africa Market Attractiveness by Packaging / Dispensing, 2025-2035
  • Figure 293: Middle East and Africa Market Attractiveness by Distribution Channel, 2025-2035
  • Figure 294: Middle East and Africa Market Attractiveness by Country, 2025-2035

Frequently Asked Questions

How big is the Global Jelly Mist Market in 2025?

The global jelly mist market is estimated to be valued at USD 1,209.6 million in 2025.

What will be the size of the Global Jelly Mist Market in 2035?

The market size for the jelly mist market is projected to reach USD 2,925.2 million by 2035.

How much will the Global Jelly Mist Market grow between 2025 and 2035?

The jelly mist market is expected to grow at a CAGR of 9.2% between 2025 and 2035.

What are the key product types in the Global Jelly Mist Market?

The key product types in the jelly mist market are defined by texture/finish, including jelly-to-mist, watery-jelly, and essence-jelly.

Which skin type segment will contribute a significant share in the Global Jelly Mist Market in 2025?

In terms of skin type, combination skin is projected to command a 33.6% share in 2025, valued at USD 406.43 million.

Explore Similar Insights

Future Market Insights

Jelly Mist Market