Krill Meal Market Size and Share Forecast Outlook 2025 to 2035

The global krill meal market is projected to grow from USD 1.4 billion in 2025 to USD 2.0 billion by 2035, reflecting a CAGR of 3.6%.
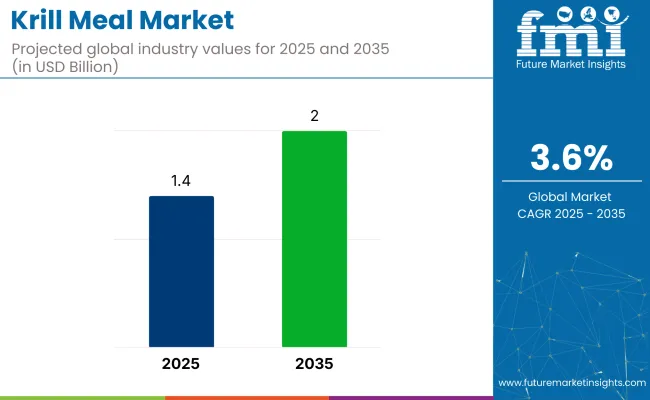
Quick Stats for krill meal market

  • Market Value (2025): USD 1.4 billion
  • Forecast Value (2035): USD 2.0 billion
  • Forecast CAGR: 3.6%
  • Type Market Leader in 2025: Human Consumption (40.2% Market Share)
  • Top Distribution Channel: Online Retail (26.7% Market Share)
  • Key Growth Region: AsiaPacific (fastest-growing market in Japan with 3.9% CAGR)

Krill Meal Market

Metric Value
Estimated Size (2025E) USD 1.4 billion
Projected Value (2035F) USD 2.0 billion
CAGR (2025 to 2035) 3.6%

This expansion is likely to be driven by rising health awareness, the nutritional benefits of krill meal products, and increasing usage in the aquafeed and nutraceutical industries. Furthermore, growing demand for omega-3-rich products is expected to reinforce growth across key markets such as the USA, Japan, and India over the next decade.

The market is likely to remain dominated by the USA with a leading share in overall market, expanding at a CAGR of 3.5% due to strong nutraceutical demand and advanced processing capabilities. Meanwhile, Japan and France closely follow this growth at prominent CAGRs of 3.9% and 3.0% respectively. Human consumption is anticipated to remain the dominant typesegment, holding a value share of 40.2% in 2035, while dietary supplements by end-use application account for 35% of the market share.

The market holds a relatively small but significant share within its parent markets. In the global seafood market, it accounts for less than 1%, given the dominance of fish, shellfish, and crustaceans for direct human consumption. Within the marine ingredients market, krill meal represents around 5-7% due to its specialized extraction for feed and nutraceuticals.

In the animal feed market, its share is under 1%, while in the Aquafeed Market, it contributes approximately 3-4% as a premium protein source. For the omega-3 ingredients market, it comprises roughly 2-3%, reflecting its use in high-value supplement formulations.

Krill Meal Market Analysis by Top Investment Segments

The market is segmented into market type, end-use application, distribution channel, and region.By market type, it includes human consumption, aquarium, aquaculture feed, and others (including pet food and industrial uses). By end-use application, the market is divided into pharmaceuticals, food and beverage, dietary supplements, and cosmetics.

The distribution channel segment includes pharmacies/drugstores, health & beauty stores, hypermarkets/supermarkets, direct selling, and online platforms. Regionally, the market covers North America, Latin America, Western Europe, Eastern Europe, East Asia, South Asia, the Pacific, and the Middle East and Africa.

By Market Type, Human Consumption Accounts for 40.2% of the Market Share

Human consumption is projected to remain the leading segment, driven by rising awareness of krill’s nutritional benefits and omega-3 content. This segment is anticipated to account for nearly 40.2% share of the market value by 2035 as consumer preference shifts towards marine-based dietary supplements. Demand from aquaculture feed will also remain strong due to krill meal’s high protein and lipid levels that enhance feed efficiency and fish health.
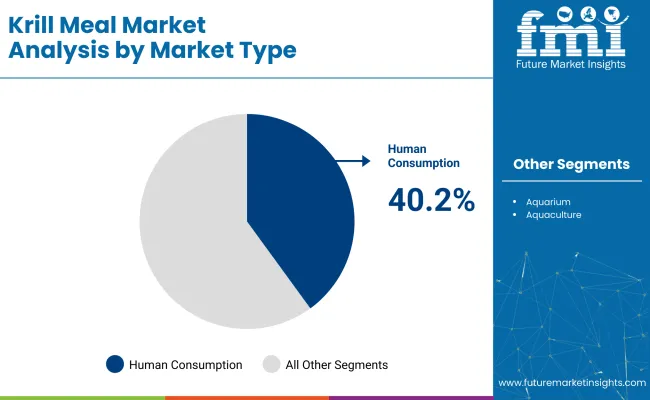
  • Aquaculture feed to witness steady demand in Asia-Pacific
  • Aquarium segment growth remains moderate
  • Others include pet food and industrial applications

Krill Meal Market By Market Type

By End Use Application, Dietary Supplements Account for 35% of the Market Share

Dietary supplements are likely to be the fastest-growing segment, supported by consumer focus on preventive healthcare and cardiovascular health benefits. This segment is expected to account for over 35% market share by 2035, owing to krill meal’s bioavailability and superior nutrient profile. Food and beverage applications are expanding with new functional products entering the market, while pharmaceutical usage is rising for specialty extracts.

  • The food & beverage sector is adopting krill extracts for fortification
  • Pharmaceuticals driven by the extraction of bioactive compounds
  • Cosmetics usage is limited to niche marine formulations

By Distribution Channel, Online Retail Accounts for 26.7% of the Market Share

Online distribution channels are projected to grow rapidly due to increasing consumer preference for convenient purchasing and access to global brands. The online segment is estimated to hold around 26.7% of total sales by 2035 as manufacturers expand direct-to-consumer sales strategies. Pharmacies and drugstores will continue to serve as key retail channels for krill-based nutraceuticals.
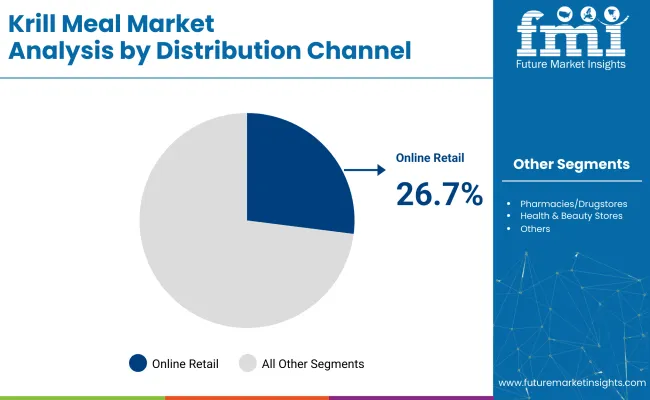
  • Pharmacies remain critical for nutraceutical sales
  • Direct selling is gaining traction in developing markets
  • Hypermarkets cater to bulk purchases for aquafeed and supplements

Krill Meal Market By Distribution Channel

Top Krill Meal Market Dynamics

Recent Trends in the Krill Meal Market

  • Increased adoption of krill meal in nutraceuticals due to its superior omega-3 bioavailability.
  • Rising investments in sustainable harvesting technologies to protect marine ecosystems.
  • Growing popularity of online retail channels for direct consumer sales of krill-based supplements.
  • Expansion of krill protein isolates and bioactive extracts for functional food and pharmaceutical applications.

Challenges Facing the Krill Meal Market
  • Stringent environmental regulations limit krill harvesting volumes in Antarctic waters.
  • High production and processing costs reduce profitability for smaller players.
  • Supply chain disruptions caused by seasonal harvesting constraints and climate factors.
  • Consumer concerns regarding marine sustainability and ethical sourcing practices.

Analyzing Top Countries Producingand Supplying Krill Meal

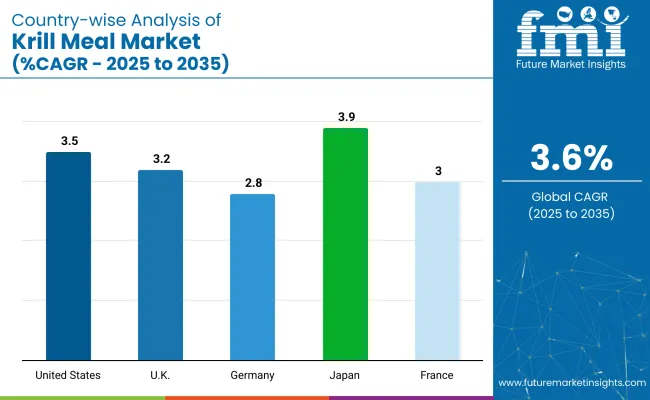
Country Wise Analysis Of Krill Meal Market

Among the top five countries in the krill meal market, Japan is projected to have the highest CAGR at 3.9% from 2025 to 2035, driven by its strong preference for marine-based dietary products and advanced extraction technologies. The USA follows with a CAGR of 3.5%, supported by high omega-3 supplement demand and strong aquafeed industry.

France is expected to grow at 3.0%, backed by expanding functional foods and supplements markets. The United Kingdom will see a CAGR of 3.2%, while Germany has the slowest growth at 2.8% due to regulatory constraints despite eco-friendly product demand.

The report covers an in-depth analysis of 40+ countries; five top-performing OECD countries are highlighted below.

United States Krill Meal Market Analysis

The krill meal revenue in the USA is projected to grow at a CAGR of 3.5% from 2025 to 2035. The country is expected to remain the largest market due to advanced harvesting technologies, high demand for omega-3 supplements, and strong aquafeed industry presence. Strategic marketing and product diversification into nutraceuticals have been enhancing market reach.

Furthermore, stringent FDA approvals ensure product quality, increasing consumer confidence. The USA market is supported by robust distribution networks and innovation in krill extraction methods, thus solidifying its leadership in the global market landscape.

  • Rising consumer focus on omega-3 enriched supplements.
  • The strong aquaculture sector is adopting krill meal for feed efficiency.
  • Innovation in extraction technology for protein isolates and oils.

Krill Meal Demand Analysis in the United Kingdom

The revenue of krill meal in the UK is anticipated to expand at a CAGR of 3.2% from 2025 to 2035. The growth is likely to be driven by increasing consumer preference for marine-based dietary supplements due to their cardiovascular and cognitive health benefits.

Additionally, UK manufacturers are investing in sustainable krill harvesting aligned with EU environmental standards. Distribution channels are expanding through e-commerce platforms, allowing brands to target health-conscious consumers directly. Regulatory clarity on marine-based nutraceutical imports is further enabling market stability.

  • Growing awareness of marine-based omega-3 health benefits.
  • Expansion of e-commerce distribution for dietary supplements.
  • Focus on sustainable harvesting to align with EU standards.

Germany Krill Meal Sales Analysis

Thesales of krill meal in Germany are forecasted to grow at a CAGR of 2.8% from 2025 to 2035. The country remains an attractive market due to high demand for clean-label and sustainably sourced nutraceuticals.

German consumers’ preference for eco-friendly and natural products continues to support krill meal sales for human consumption and dietary supplements. However, companies face challenges due to strict EU sustainability regulations and high competition from alternative omega-3 sources such as algae oils, necessitating innovation to retain market position.

  • Strong demand for sustainable marine-based supplements.
  • Challenges from strict EU environmental compliance.
  • Increasing product diversification into functional foods.

Krill Meal Demand Analysis in France

The krill meal industry in France is projected to register a CAGR of 3.0% from 2025 to 2035. Growth is driven by expanding dietary supplement markets and the incorporation of krill extracts in functional foods targeting cardiovascular health.

French nutraceutical firms are investing in R&D for new krill-based product formulations to gain a competitive advantage. However, environmental activism and regulatory hurdles on marine harvesting pose operational constraints, necessitating investment in sustainable sourcing certifications to maintain consumer trust.

  • Expansion of krill-based functional food and supplement applications.
  • Investment in R&D for innovative product formulations.
  • Regulatory focus on sustainable marine harvesting practices.

Japan Krill Meal Market Analysis

The revenue from krill meal in Japan is expected to expand at a CAGR of 3.9% from 2025 to 2035. The country’s growth is underpinned by cultural dietary preferences for marine-based products and increasing elderly population demand for joint health and cognitive function supplements.

Japanese companies are leveraging krill meal’s high phospholipid content in nutraceutical formulations. Furthermore, technological advancements in krill oil extraction are supporting premium product launches in the market, strengthening Japan’s position in the Asia-Pacific region.

  • High consumer acceptance of marine-based dietary products.
  • Technological advancements in krill oil extraction.
  • Strong demand for cognitive and joint health supplements.

Leading Krill Meal Suppliers

The market is moderately consolidated, with a few multinational leaders accounting for significant revenue shares alongside several regional nutraceutical firms. Tier-one companies such as Vitafusion, Nature’s Bounty, NOW Foods, Doctor’s Best, and Jarrow Formulas are competing based on product innovation, superior extraction technologies, sustainability certifications, and expanding distribution partnerships across online and offline channels. These firms leverage their brand reputation to penetrate premium dietary supplement segments globally.

Company strategies increasingly focus on sourcing traceable and eco-friendly krill meal, developing high-bioavailability formulations, and expanding direct-to-consumer platforms. Pricing competitiveness is maintained through economies of scale in raw material procurement, while innovation in extraction methods and functional blends (e.g., krill phospholipids with antioxidants) is enhancing product portfolios. Strategic partnerships with marine harvesting firms and e-commerce platforms are further strengthening market positions, particularly in North America and East Asia.

Recent Krill Meal Market News

In September 2024, Jarrow Formulas launched the Multi+ Multivitamin line, including Women’s, Men’s, and Mood Multi+ products. These multivitamins deliver 20 minerals and vitamins with 100% daily value and are formulated with proprietary blends for enhanced benefits such as hair health, mood support, and nitric oxide production for blood flow.

Krill Meal Market Report Scope

Report Attributes Details
Current Total Market Size (2025) USD 1.4 billion
Projected Market Size (2035) USD 2.0 billion
CAGR (2025 to 2035) 3.6%
Base Year for Estimation 2024
Historical Period 2020 to 2024
Projections Period 2025 to 2035
Market Analysis Parameters Revenue in USD billion/Volume in kilotons
By Market Type Human Consumption, Aquarium, Aquaculture Feed, Others (pet food, industrial uses)
By End Use Application Pharmaceuticals, Food and Beverage, Dietary Supplements, Cosmetics
By Distribution Channel Pharmacies/Drugstores, Health & Beauty Stores, Hypermarket/Supermarket, Direct Selling, Online
Regions Covered North America, Latin America, Western Europe, Eastern Europe, East Asia, South Asia, the Pacific, the Middle East and Africa
Countries Covered United States, Canada, United Kingdom, Germany, France, China, Japan, South Korea, Brazil, Australia
Key Players Vitafusion, Nature’s Bounty, NOW Foods, Doctor’s Best, Jarrow Formulas, Weber Naturals, Nature Made, Jamieson, Nordic Naturals
Additional Attributes Dollar sales by value, market share analysis by region, and country-wise analysis

Key Segments

By Market Use:

As per Market Use, the industry is categorized into Human Consumption, Aquarium, and Aquaculture Feed.

By End Use Application:

As per End Use Application, the industry is categorized into Pharmaceuticals, Food And Beverage, Dietary Supplements, and Cosmetics.

By Distribution Channel:

As per Distribution Channel, the industry is categorized into Pharmacies/Drugstores, Health & Beauty stores, Hypermarket/Supermarket, Direct Selling, and Online.

By Region:

Industry analysis has been carried out in key countries of North America, Latin America, Europe, East Asia, South Asia, Oceania, and the Middle East & Africa.

Table of Content

  1. Executive Summary
    • Global Market Outlook
    • Demand-side Trends
    • Supply-side Trends
    • Technology Roadmap Analysis
    • Analysis and Recommendations
  2. Market Overview
    • Market Coverage / Taxonomy
    • Market Definition / Scope / Limitations
  3. Market Background
    • Market Dynamics
      • Drivers
      • Restraints
      • Opportunity
      • Trends
    • Scenario Forecast
      • Demand in Optimistic Scenario
      • Demand in Likely Scenario
      • Demand in Conservative Scenario
    • Opportunity Map Analysis
    • Product Life Cycle Analysis
    • Supply Chain Analysis
      • Supply Side Participants and their Roles
        • Producers
        • Mid-Level Participants (Traders/ Agents/ Brokers)
        • Wholesalers and Distributors
      • Value Added and Value Created at Node in the Supply Chain
      • List of Raw Material Suppliers
      • List of Existing and Potential Buyer’s
    • Investment Feasibility Matrix
    • Value Chain Analysis
      • Profit Margin Analysis
      • Wholesalers and Distributors
      • Retailers
    • PESTLE and Porter’s Analysis
    • Regulatory Landscape
      • By Key Regions
      • By Key Countries
    • Regional Parent Market Outlook
    • Production and Consumption Statistics
    • Import and Export Statistics
  4. Global Market Analysis 2020 to 2024 and Forecast, 2025 to 2035
    • Historical Market Size Value (USD Billion) & Volume (kilotons) Analysis, 2020 to 2024
    • Current and Future Market Size Value (USD Billion) & Volume (kilotons) Projections, 2025 to 2035
      • Y-o-Y Growth Trend Analysis
      • Absolute $ Opportunity Analysis
  5. Global Market Pricing Analysis 2020 to 2024 and Forecast 2025 to 2035
  6. Global Market Analysis 2020 to 2024 and Forecast 2025 to 2035, By Market Type
    • Introduction / Key Findings
    • Historical Market Size Value (USD Billion) & Volume (kilotons) Analysis By Market Type, 2020 to 2024
    • Current and Future Market Size Value (USD Billion) & Volume (kilotons) Analysis and Forecast By Market Type, 2025 to 2035
      • Human Consumption
      • Aquarium
      • Aquaculture Feed
      • Others
    • Y-o-Y Growth Trend Analysis By Market Type, 2020 to 2024
    • Absolute $ Opportunity Analysis By Market Type, 2025 to 2035
  7. Global Market Analysis 2020 to 2024 and Forecast 2025 to 2035, By End Use Application
    • Introduction / Key Findings
    • Historical Market Size Value (USD Billion) & Volume (kilotons) Analysis By End Use Application, 2020 to 2024
    • Current and Future Market Size Value (USD Billion) & Volume (kilotons) Analysis and Forecast By End Use Application, 2025 to 2035
      • Pharmaceuticals
      • Food and Beverage
      • Dietary Supplements
      • Cosmetics
    • Y-o-Y Growth Trend Analysis By End Use Application, 2020 to 2024
    • Absolute $ Opportunity Analysis By End Use Application, 2025 to 2035
  8. Global Market Analysis 2020 to 2024 and Forecast 2025 to 2035, By Distribution Channel
    • Introduction / Key Findings
    • Historical Market Size Value (USD Billion) & Volume (kilotons) Analysis By Distribution Channel, 2020 to 2024
    • Current and Future Market Size Value (USD Billion) & Volume (kilotons) Analysis and Forecast By Distribution Channel, 2025 to 2035
      • Pharmacies/Drugstores
      • Health & Beauty Stores
      • Hypermarket/Supermarket
      • Direct Selling
      • Online
    • Y-o-Y Growth Trend Analysis By Distribution Channel, 2020 to 2024
    • Absolute $ Opportunity Analysis By Distribution Channel, 2025 to 2035
  9. Global Market Analysis 2020 to 2024 and Forecast 2025 to 2035, By Region
    • Introduction
    • Historical Market Size Value (USD Billion) & Volume (kilotons) Analysis By Region, 2020 to 2024
    • Current Market Size Value (USD Billion) & Volume (kilotons) Analysis and Forecast By Region, 2025 to 2035
      • North America
      • Latin America
      • Western Europe
      • Eastern Europe
      • East Asia
      • South Asia & Pacific
      • Middle East and Africa
    • Market Attractiveness Analysis By Region
  10. North America Market Analysis 2020 to 2024 and Forecast 2025 to 2035, By Country
    • Historical Market Size Value (USD Billion) & Volume (kilotons) Trend Analysis By Market Taxonomy, 2020 to 2024
    • Market Size Value (USD Billion) & Volume (kilotons) Forecast By Market Taxonomy, 2025 to 2035
      • By Country
        • USA
        • Canada
        • Mexico
      • By Market Type
      • By End Use Application
      • By Distribution Channel
    • Market Attractiveness Analysis
      • By Country
      • By Market Type
      • By End Use Application
      • By Distribution Channel
    • Key Takeaways
  11. Latin America Market Analysis 2020 to 2024 and Forecast 2025 to 2035, By Country
    • Historical Market Size Value (USD Billion) & Volume (kilotons) Trend Analysis By Market Taxonomy, 2020 to 2024
    • Market Size Value (USD Billion) & Volume (kilotons) Forecast By Market Taxonomy, 2025 to 2035
      • By Country
        • Brazil
        • Argentina
        • Rest of LATAM
      • By Market Type
      • By End Use Application
      • By Distribution Channel
    • Market Attractiveness Analysis
      • By Country
      • By Market Type
      • By End Use Application
      • By Distribution Channel
    • Key Takeaways
  12. Western Europe Market Analysis 2020 to 2024 and Forecast 2025 to 2035, By Country
    • Historical Market Size Value (USD Billion) & Volume (kilotons) Trend Analysis By Market Taxonomy, 2020 to 2024
    • Market Size Value (USD Billion) & Volume (kilotons) Forecast By Market Taxonomy, 2025 to 2035
      • By Country
        • Germany
        • Italy
        • France
        • UK
        • Spain
        • BENELUX
        • Nordic
        • Rest of W.Europe
      • By Market Type
      • By End Use Application
      • By Distribution Channel
    • Market Attractiveness Analysis
      • By Country
      • By Market Type
      • By End Use Application
      • By Distribution Channel
    • Key Takeaways
  13. Eastern Europe Market Analysis 2020 to 2024 and Forecast 2025 to 2035, By Country
    • Historical Market Size Value (USD Billion) & Volume (kilotons) Trend Analysis By Market Taxonomy, 2020 to 2024
    • Market Size Value (USD Billion) & Volume (kilotons) Forecast By Market Taxonomy, 2025 to 2035
      • By Country
        • Russia
        • Hungary
        • Poland
        • Balkan & Baltics
        • Rest of E. Europe
      • By Market Type
      • By End Use Application
      • By Distribution Channel
    • Market Attractiveness Analysis
      • By Country
      • By Market Type
      • By End Use Application
      • By Distribution Channel
    • Key Takeaways
  14. East Asia Market Analysis 2020 to 2024 and Forecast 2025 to 2035, By Country
    • Historical Market Size Value (USD Billion) & Volume (kilotons) Trend Analysis By Market Taxonomy, 2020 to 2024
    • Market Size Value (USD Billion) & Volume (kilotons) Forecast By Market Taxonomy, 2025 to 2035
      • By Country
        • China
        • Japan
        • South Korea
      • By Market Type
      • By End Use Application
      • By Distribution Channel
    • Market Attractiveness Analysis
      • By Country
      • By Market Type
      • By End Use Application
      • By Distribution Channel
    • Key Takeaways
  15. South Asia & Pacific Market Analysis 2020 to 2024 and Forecast 2025 to 2035, By Country
    • Historical Market Size Value (USD Billion) & Volume (kilotons) Trend Analysis By Market Taxonomy, 2020 to 2024
    • Market Size Value (USD Billion) & Volume (kilotons) Forecast By Market Taxonomy, 2025 to 2035
      • By Country
        • India
        • Australia & New Zealand
        • ASEAN
        • Rest of SAP
      • By Market Type
      • By End Use Application
      • By Distribution Channel
    • Market Attractiveness Analysis
      • By Country
      • By Market Type
      • By End Use Application
      • By Distribution Channel
    • Key Takeaways
  16. Middle East and Africa Market Analysis 2020 to 2024 and Forecast 2025 to 2035, By Country
    • Historical Market Size Value (USD Billion) & Volume (kilotons) Trend Analysis By Market Taxonomy, 2020 to 2024
    • Market Size Value (USD Billion) & Volume (kilotons) Forecast By Market Taxonomy, 2025 to 2035
      • By Country
        • GCC Countries
        • Northern Africa
        • South Africa
        • Turkiye
        • Rest of MEA
      • By Market Type
      • By End Use Application
      • By Distribution Channel
    • Market Attractiveness Analysis
      • By Country
      • By Market Type
      • By End Use Application
      • By Distribution Channel
    • Key Takeaways
  17. Key Countries Market Analysis
    • USA
      • Pricing Analysis
      • Market Share Analysis, 2024
        • By Market Type
        • By End Use Application
        • By Distribution Channel
    • Canada
      • Pricing Analysis
      • Market Share Analysis, 2024
        • By Market Type
        • By End Use Application
        • By Distribution Channel
    • Brazil
      • Pricing Analysis
      • Market Share Analysis, 2024
        • By Market Type
        • By End Use Application
        • By Distribution Channel
    • Mexico
      • Pricing Analysis
      • Market Share Analysis, 2024
        • By Market Type
        • By End Use Application
        • By Distribution Channel
    • Argentina
      • Pricing Analysis
      • Market Share Analysis, 2024
        • By Market Type
        • By End Use Application
        • By Distribution Channel
  18. Market Structure Analysis
    • Competition Dashboard
    • Competition Benchmarking
    • Market Share Analysis of Top Players
      • By Regional
      • By Market Type
      • By End Use Application
      • By Distribution Channel
  19. Competition Analysis
    • Competition Deep Dive
      • Vitafusion
        • Overview
        • Product Portfolio
        • Profitability by Market Segments (Product/Age /Sales Channel/Region)
        • Sales Footprint
        • Strategy Overview
          • Marketing Strategy
          • Product Strategy
          • Channel Strategy
      • Nature's Bounty
        • Overview
        • Product Portfolio
        • Profitability by Market Segments (Product/Age /Sales Channel/Region)
        • Sales Footprint
        • Strategy Overview
          • Marketing Strategy
          • Product Strategy
          • Channel Strategy
      • NOW Foods
        • Overview
        • Product Portfolio
        • Profitability by Market Segments (Product/Age /Sales Channel/Region)
        • Sales Footprint
        • Strategy Overview
          • Marketing Strategy
          • Product Strategy
          • Channel Strategy
      • Doctor's Best
        • Overview
        • Product Portfolio
        • Profitability by Market Segments (Product/Age /Sales Channel/Region)
        • Sales Footprint
        • Strategy Overview
          • Marketing Strategy
          • Product Strategy
          • Channel Strategy
      • Jarrow Formulas
        • Overview
        • Product Portfolio
        • Profitability by Market Segments (Product/Age /Sales Channel/Region)
        • Sales Footprint
        • Strategy Overview
          • Marketing Strategy
          • Product Strategy
          • Channel Strategy
      • Weber Naturals
        • Overview
        • Product Portfolio
        • Profitability by Market Segments (Product/Age /Sales Channel/Region)
        • Sales Footprint
        • Strategy Overview
          • Marketing Strategy
          • Product Strategy
          • Channel Strategy
      • Nature Made
        • Overview
        • Product Portfolio
        • Profitability by Market Segments (Product/Age /Sales Channel/Region)
        • Sales Footprint
        • Strategy Overview
          • Marketing Strategy
          • Product Strategy
          • Channel Strategy
      • Jamieson
        • Overview
        • Product Portfolio
        • Profitability by Market Segments (Product/Age /Sales Channel/Region)
        • Sales Footprint
        • Strategy Overview
          • Marketing Strategy
          • Product Strategy
          • Channel Strategy
      • Nordic Naturals
        • Overview
        • Product Portfolio
        • Profitability by Market Segments (Product/Age /Sales Channel/Region)
        • Sales Footprint
        • Strategy Overview
          • Marketing Strategy
          • Product Strategy
          • Channel Strategy
      • Others
        • Overview
        • Product Portfolio
        • Profitability by Market Segments (Product/Age /Sales Channel/Region)
        • Sales Footprint
        • Strategy Overview
          • Marketing Strategy
          • Product Strategy
          • Channel Strategy
  20. Assumptions & Acronyms Used
  21. Research Methodology

List of Tables

  • Table 1: Global Market Value (USD Billion) Forecast by Region, 2020-2035
  • Table 2: Global Market Volume (kilotons) Forecast by Region, 2020-2035
  • Table 3: Global Market Value (USD Billion) Forecast by Market Type, 2020-2035
  • Table 4: Global Market Volume (kilotons) Forecast by Market Type, 2020-2035
  • Table 5: Global Market Value (USD Billion) Forecast by End Use Application, 2020-2035
  • Table 6: Global Market Volume (kilotons) Forecast by End Use Application, 2020-2035
  • Table 7: Global Market Value (USD Billion) Forecast by Distribution Channel, 2020-2035
  • Table 8: Global Market Volume (kilotons) Forecast by Distribution Channel, 2020-2035
  • Table 9: North America Market Value (USD Billion) Forecast by Country, 2020-2035
  • Table 10: North America Market Volume (kilotons) Forecast by Country, 2020-2035
  • Table 11: North America Market Value (USD Billion) Forecast by Market Type, 2020-2035
  • Table 12: North America Market Volume (kilotons) Forecast by Market Type, 2020-2035
  • Table 13: North America Market Value (USD Billion) Forecast by End Use Application, 2020-2035
  • Table 14: North America Market Volume (kilotons) Forecast by End Use Application, 2020-2035
  • Table 15: North America Market Value (USD Billion) Forecast by Distribution Channel, 2020-2035
  • Table 16: North America Market Volume (kilotons) Forecast by Distribution Channel, 2020-2035
  • Table 17: Latin America Market Value (USD Billion) Forecast by Country, 2020-2035
  • Table 18: Latin America Market Volume (kilotons) Forecast by Country, 2020-2035
  • Table 19: Latin America Market Value (USD Billion) Forecast by Market Type, 2020-2035
  • Table 20: Latin America Market Volume (kilotons) Forecast by Market Type, 2020-2035
  • Table 21: Latin America Market Value (USD Billion) Forecast by End Use Application, 2020-2035
  • Table 22: Latin America Market Volume (kilotons) Forecast by End Use Application, 2020-2035
  • Table 23: Latin America Market Value (USD Billion) Forecast by Distribution Channel, 2020-2035
  • Table 24: Latin America Market Volume (kilotons) Forecast by Distribution Channel, 2020-2035
  • Table 25: Western Europe Market Value (USD Billion) Forecast by Country, 2020-2035
  • Table 26: Western Europe Market Volume (kilotons) Forecast by Country, 2020-2035
  • Table 27: Western Europe Market Value (USD Billion) Forecast by Market Type, 2020-2035
  • Table 28: Western Europe Market Volume (kilotons) Forecast by Market Type, 2020-2035
  • Table 29: Western Europe Market Value (USD Billion) Forecast by End Use Application, 2020-2035
  • Table 30: Western Europe Market Volume (kilotons) Forecast by End Use Application, 2020-2035
  • Table 31: Western Europe Market Value (USD Billion) Forecast by Distribution Channel, 2020-2035
  • Table 32: Western Europe Market Volume (kilotons) Forecast by Distribution Channel, 2020-2035
  • Table 33: Eastern Europe Market Value (USD Billion) Forecast by Country, 2020-2035
  • Table 34: Eastern Europe Market Volume (kilotons) Forecast by Country, 2020-2035
  • Table 35: Eastern Europe Market Value (USD Billion) Forecast by Market Type, 2020-2035
  • Table 36: Eastern Europe Market Volume (kilotons) Forecast by Market Type, 2020-2035
  • Table 37: Eastern Europe Market Value (USD Billion) Forecast by End Use Application, 2020-2035
  • Table 38: Eastern Europe Market Volume (kilotons) Forecast by End Use Application, 2020-2035
  • Table 39: Eastern Europe Market Value (USD Billion) Forecast by Distribution Channel, 2020-2035
  • Table 40: Eastern Europe Market Volume (kilotons) Forecast by Distribution Channel, 2020-2035
  • Table 41: East Asia Market Value (USD Billion) Forecast by Country, 2020-2035
  • Table 42: East Asia Market Volume (kilotons) Forecast by Country, 2020-2035
  • Table 43: East Asia Market Value (USD Billion) Forecast by Market Type, 2020-2035
  • Table 44: East Asia Market Volume (kilotons) Forecast by Market Type, 2020-2035
  • Table 45: East Asia Market Value (USD Billion) Forecast by End Use Application, 2020-2035
  • Table 46: East Asia Market Volume (kilotons) Forecast by End Use Application, 2020-2035
  • Table 47: East Asia Market Value (USD Billion) Forecast by Distribution Channel, 2020-2035
  • Table 48: East Asia Market Volume (kilotons) Forecast by Distribution Channel, 2020-2035
  • Table 49: South Asia & Pacific Market Value (USD Billion) Forecast by Country, 2020-2035
  • Table 50: South Asia & Pacific Market Volume (kilotons) Forecast by Country, 2020-2035
  • Table 51: South Asia & Pacific Market Value (USD Billion) Forecast by Market Type, 2020-2035
  • Table 52: South Asia & Pacific Market Volume (kilotons) Forecast by Market Type, 2020-2035
  • Table 53: South Asia & Pacific Market Value (USD Billion) Forecast by End Use Application, 2020-2035
  • Table 54: South Asia & Pacific Market Volume (kilotons) Forecast by End Use Application, 2020-2035
  • Table 55: South Asia & Pacific Market Value (USD Billion) Forecast by Distribution Channel, 2020-2035
  • Table 56: South Asia & Pacific Market Volume (kilotons) Forecast by Distribution Channel, 2020-2035
  • Table 57: Middle East and Africa Market Value (USD Billion) Forecast by Country, 2020-2035
  • Table 58: Middle East and Africa Market Volume (kilotons) Forecast by Country, 2020-2035
  • Table 59: Middle East and Africa Market Value (USD Billion) Forecast by Market Type, 2020-2035
  • Table 60: Middle East and Africa Market Volume (kilotons) Forecast by Market Type, 2020-2035
  • Table 61: Middle East and Africa Market Value (USD Billion) Forecast by End Use Application, 2020-2035
  • Table 62: Middle East and Africa Market Volume (kilotons) Forecast by End Use Application, 2020-2035
  • Table 63: Middle East and Africa Market Value (USD Billion) Forecast by Distribution Channel, 2020-2035
  • Table 64: Middle East and Africa Market Volume (kilotons) Forecast by Distribution Channel, 2020-2035

List of Figures

  • Figure 1: Global Market Volume (kilotons) Forecast 2020-2035
  • Figure 2: Global Market Pricing Analysis
  • Figure 3: Global Market Value (USD Billion) Forecast 2020-2035
  • Figure 4: Global Market Value Share and BPS Analysis by Market Type, 2025 and 2035
  • Figure 5: Global Market Y-o-Y Growth Comparison by Market Type, 2025-2035
  • Figure 6: Global Market Attractiveness Analysis by Market Type
  • Figure 7: Global Market Value Share and BPS Analysis by End Use Application, 2025 and 2035
  • Figure 8: Global Market Y-o-Y Growth Comparison by End Use Application, 2025-2035
  • Figure 9: Global Market Attractiveness Analysis by End Use Application
  • Figure 10: Global Market Value Share and BPS Analysis by Distribution Channel, 2025 and 2035
  • Figure 11: Global Market Y-o-Y Growth Comparison by Distribution Channel, 2025-2035
  • Figure 12: Global Market Attractiveness Analysis by Distribution Channel
  • Figure 13: Global Market Value (USD Billion) Share and BPS Analysis by Region, 2025 and 2035
  • Figure 14: Global Market Y-o-Y Growth Comparison by Region, 2025-2035
  • Figure 15: Global Market Attractiveness Analysis by Region
  • Figure 16: North America Market Incremental $ Opportunity, 2025-2035
  • Figure 17: Latin America Market Incremental $ Opportunity, 2025-2035
  • Figure 18: Western Europe Market Incremental $ Opportunity, 2025-2035
  • Figure 19: Eastern Europe Market Incremental $ Opportunity, 2025-2035
  • Figure 20: East Asia Market Incremental $ Opportunity, 2025-2035
  • Figure 21: South Asia & Pacific Market Incremental $ Opportunity, 2025-2035
  • Figure 22: Middle East and Africa Market Incremental $ Opportunity, 2025-2035
  • Figure 23: North America Market Value Share and BPS Analysis by Country, 2025 and 2035
  • Figure 24: North America Market Value Share and BPS Analysis by Market Type, 2025 and 2035
  • Figure 25: North America Market Y-o-Y Growth Comparison by Market Type, 2025-2035
  • Figure 26: North America Market Attractiveness Analysis by Market Type
  • Figure 27: North America Market Value Share and BPS Analysis by End Use Application, 2025 and 2035
  • Figure 28: North America Market Y-o-Y Growth Comparison by End Use Application, 2025-2035
  • Figure 29: North America Market Attractiveness Analysis by End Use Application
  • Figure 30: North America Market Value Share and BPS Analysis by Distribution Channel, 2025 and 2035
  • Figure 31: North America Market Y-o-Y Growth Comparison by Distribution Channel, 2025-2035
  • Figure 32: North America Market Attractiveness Analysis by Distribution Channel
  • Figure 33: Latin America Market Value Share and BPS Analysis by Country, 2025 and 2035
  • Figure 34: Latin America Market Value Share and BPS Analysis by Market Type, 2025 and 2035
  • Figure 35: Latin America Market Y-o-Y Growth Comparison by Market Type, 2025-2035
  • Figure 36: Latin America Market Attractiveness Analysis by Market Type
  • Figure 37: Latin America Market Value Share and BPS Analysis by End Use Application, 2025 and 2035
  • Figure 38: Latin America Market Y-o-Y Growth Comparison by End Use Application, 2025-2035
  • Figure 39: Latin America Market Attractiveness Analysis by End Use Application
  • Figure 40: Latin America Market Value Share and BPS Analysis by Distribution Channel, 2025 and 2035
  • Figure 41: Latin America Market Y-o-Y Growth Comparison by Distribution Channel, 2025-2035
  • Figure 42: Latin America Market Attractiveness Analysis by Distribution Channel
  • Figure 43: Western Europe Market Value Share and BPS Analysis by Country, 2025 and 2035
  • Figure 44: Western Europe Market Value Share and BPS Analysis by Market Type, 2025 and 2035
  • Figure 45: Western Europe Market Y-o-Y Growth Comparison by Market Type, 2025-2035
  • Figure 46: Western Europe Market Attractiveness Analysis by Market Type
  • Figure 47: Western Europe Market Value Share and BPS Analysis by End Use Application, 2025 and 2035
  • Figure 48: Western Europe Market Y-o-Y Growth Comparison by End Use Application, 2025-2035
  • Figure 49: Western Europe Market Attractiveness Analysis by End Use Application
  • Figure 50: Western Europe Market Value Share and BPS Analysis by Distribution Channel, 2025 and 2035
  • Figure 51: Western Europe Market Y-o-Y Growth Comparison by Distribution Channel, 2025-2035
  • Figure 52: Western Europe Market Attractiveness Analysis by Distribution Channel
  • Figure 53: Eastern Europe Market Value Share and BPS Analysis by Country, 2025 and 2035
  • Figure 54: Eastern Europe Market Value Share and BPS Analysis by Market Type, 2025 and 2035
  • Figure 55: Eastern Europe Market Y-o-Y Growth Comparison by Market Type, 2025-2035
  • Figure 56: Eastern Europe Market Attractiveness Analysis by Market Type
  • Figure 57: Eastern Europe Market Value Share and BPS Analysis by End Use Application, 2025 and 2035
  • Figure 58: Eastern Europe Market Y-o-Y Growth Comparison by End Use Application, 2025-2035
  • Figure 59: Eastern Europe Market Attractiveness Analysis by End Use Application
  • Figure 60: Eastern Europe Market Value Share and BPS Analysis by Distribution Channel, 2025 and 2035
  • Figure 61: Eastern Europe Market Y-o-Y Growth Comparison by Distribution Channel, 2025-2035
  • Figure 62: Eastern Europe Market Attractiveness Analysis by Distribution Channel
  • Figure 63: East Asia Market Value Share and BPS Analysis by Country, 2025 and 2035
  • Figure 64: East Asia Market Value Share and BPS Analysis by Market Type, 2025 and 2035
  • Figure 65: East Asia Market Y-o-Y Growth Comparison by Market Type, 2025-2035
  • Figure 66: East Asia Market Attractiveness Analysis by Market Type
  • Figure 67: East Asia Market Value Share and BPS Analysis by End Use Application, 2025 and 2035
  • Figure 68: East Asia Market Y-o-Y Growth Comparison by End Use Application, 2025-2035
  • Figure 69: East Asia Market Attractiveness Analysis by End Use Application
  • Figure 70: East Asia Market Value Share and BPS Analysis by Distribution Channel, 2025 and 2035
  • Figure 71: East Asia Market Y-o-Y Growth Comparison by Distribution Channel, 2025-2035
  • Figure 72: East Asia Market Attractiveness Analysis by Distribution Channel
  • Figure 73: South Asia & Pacific Market Value Share and BPS Analysis by Country, 2025 and 2035
  • Figure 74: South Asia & Pacific Market Value Share and BPS Analysis by Market Type, 2025 and 2035
  • Figure 75: South Asia & Pacific Market Y-o-Y Growth Comparison by Market Type, 2025-2035
  • Figure 76: South Asia & Pacific Market Attractiveness Analysis by Market Type
  • Figure 77: South Asia & Pacific Market Value Share and BPS Analysis by End Use Application, 2025 and 2035
  • Figure 78: South Asia & Pacific Market Y-o-Y Growth Comparison by End Use Application, 2025-2035
  • Figure 79: South Asia & Pacific Market Attractiveness Analysis by End Use Application
  • Figure 80: South Asia & Pacific Market Value Share and BPS Analysis by Distribution Channel, 2025 and 2035
  • Figure 81: South Asia & Pacific Market Y-o-Y Growth Comparison by Distribution Channel, 2025-2035
  • Figure 82: South Asia & Pacific Market Attractiveness Analysis by Distribution Channel
  • Figure 83: Middle East and Africa Market Value Share and BPS Analysis by Country, 2025 and 2035
  • Figure 84: Middle East and Africa Market Value Share and BPS Analysis by Market Type, 2025 and 2035
  • Figure 85: Middle East and Africa Market Y-o-Y Growth Comparison by Market Type, 2025-2035
  • Figure 86: Middle East and Africa Market Attractiveness Analysis by Market Type
  • Figure 87: Middle East and Africa Market Value Share and BPS Analysis by End Use Application, 2025 and 2035
  • Figure 88: Middle East and Africa Market Y-o-Y Growth Comparison by End Use Application, 2025-2035
  • Figure 89: Middle East and Africa Market Attractiveness Analysis by End Use Application
  • Figure 90: Middle East and Africa Market Value Share and BPS Analysis by Distribution Channel, 2025 and 2035
  • Figure 91: Middle East and Africa Market Y-o-Y Growth Comparison by Distribution Channel, 2025-2035
  • Figure 92: Middle East and Africa Market Attractiveness Analysis by Distribution Channel
  • Figure 93: Global Market - Tier Structure Analysis
  • Figure 94: Global Market - Company Share Analysis

Frequently Asked Questions

What is the projected size of the krill meal market in 2025?

The market size is valued at USD 1.4 billion in 2025.

What is the outlook for krill meal demand by 2035?

The market is forecasted to reach USD 2.0 billion by 2035, reflecting a CAGR of 3.6%.

Which market type leads the krill meal market in 2025?

Human consumption is expected to lead the market with a 40.2% value share in 2025.

Which distribution channel is projected to grow the fastest in the Krill Meal market by 2035?

Online retail is anticipated to be the fastest-growing channel with a projected 26.7% share by 2035.

Which country is projected to have the fastest-growing Krill Meal market?

Japan is expected to be the fastest-growing market with a CAGR of 3.9% from 2025 to 2035.

Explore Similar Insights

Future Market Insights

Krill Meal Market