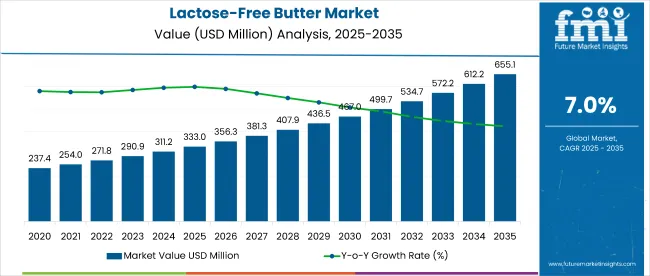
The global lactose-free butter market is estimated to reach USD 311 million in 2023 and is projected to reach USD 603 million by 2033. According to Future Market Insights (FMI), the lactose-free butter market is poised to expand at 7% CAGR, over the forecast period. Lactose-free butter either contains very less or no lactose. Cream, which is lactose-free, is used for obtaining lactose-free butter.
With the rising prevalence of lactose intolerance across the globe, the demand for lactose-free dairy products such as lactose-free milk and lactose-free butter is surging. Citing this trend, the demand for lactose-free butter is projected to surge over the forecast period.
The growing trend of veganism and increasing expenditure for such products is expected to increase. This is anticipated to facilitate growth in the lactose-free butter market.
Lactose-free butter manufacturers are catering to the demand for low-fat butter along with the lactose-free claim as well. As lactose-free butter is available only in regular flavors, manufacturers are introducing other flavors to capitalize on growing demand.
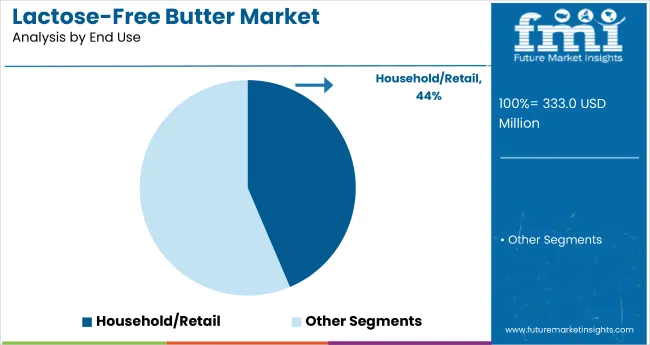
Lactose-free butter is mostly used for retail use, however, several manufacturers are producing lactose-free butter for consumers, especially vegans. Also, numerous food service operators in Latin America and Western Europe have shifted to lactose-free butter in the bakery sector. Due to the increasing demand for vegan and lactose-free food products.
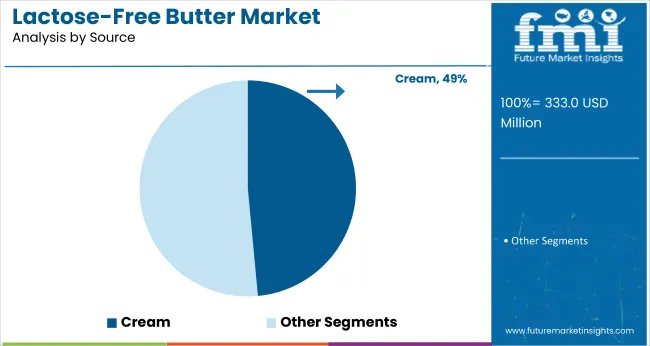
Further, the inclination towards clean-label food, which includes organic, gluten-free, non-GMO, etc. may boost the market. Thus, some manufacturers are introducing organic lactose-free butter using organic cream as the source.
Attribute | Details |
---|---|
Global Lactose-free Butter Market Valuation in 2022 | USD 299.52 million |
Estimated Global Market Share in 2023 | USD 311 million |
Forecasted Global Market Size by 2033 | USD 603 million |
Projected Global Market Growth Rate from 2023 to 2033 | 7% CAGR |
Market Share of Top 3 Companies | 39.4% |
Market Statistics | Details |
---|---|
Jan to Jun (H1), 2021 (A) | 7% |
Jul to Dec (H2), 2021 (A) | 5% |
Jan to Jun (H1), 2022 Projected (P) | 6% |
Jan to Jun (H1), 2022 Outlook (O) | 6% |
Jul to Dec (H2), 2022 Outlook (O) | 5% |
Jul to Dec (H2), 2022 Projected (P) | 6% |
BPS Change : H1,2022 (O) - H1,2021 (A) | 5.9% |
BPS Change : H1,2022 (O) - H1,2022 (P) | 6% |
BPS Change: H2, 2022 (O) - H2, 2021 (A) | 5% |
BPS Change: H2, 2022 (O) - H2, 2022 (P) | 4% |
According to the previous market survey reports, the overall lactose-free butter business in the year 2018 was pegged at around USD 271 million. Though the demand for lactose-free butter hiked in the following years, the overall sales dropped significantly in the years 2020 and 2021. Constraints on the supply side along with obstruction of retail sales channels presented a severe blow until the first quarter of 2022. However, the lactose-free butter producers witnessed some revival in 2022 and by its end, the net market valuation reached USD 299.52 million.
Interestingly enough, the pandemic period also opened up the opportunity for market players to include the product on online platforms. Future Market Insights projects the lactose-free butter market to remain steady in comparison to the CAGR of 2.5% witnessed between 2018 and 2022.
Brazil to Dominate the Latin America Lactose-free Butter Market
According to FMI, the prevalence of lactose intolerance is improving the demand for lactose-free butter in Brazil. It is found that 50 to 60% of the people in Latin America are lactose intolerant, particularly in Brazil.
This is expected to provide remunerative growth opportunities for lactose-free butter manufacturers in Latin America over the forecast period.
Regional Market Comparison | Global Market Share in Percentage |
---|---|
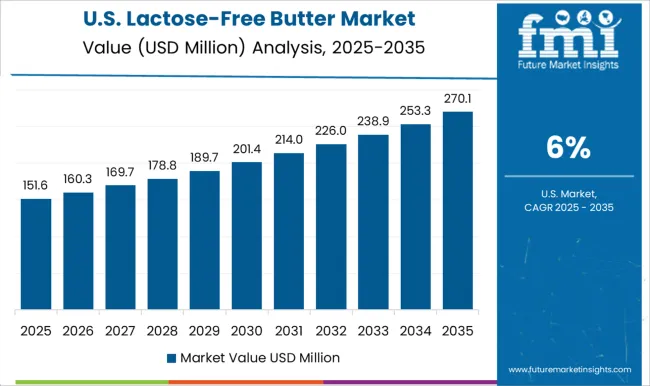
United States | 17.9% |
Germany | 5.3% |
Japan | 4.8% |
Australia | 1.2% |
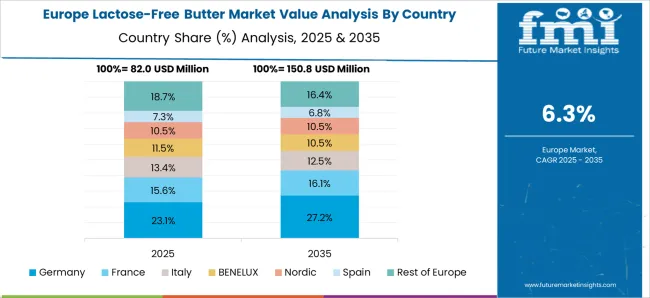
Germany and France to Influence the European Lactose-free Butter Market
Lactose-free dairy products are witnessing an increased demand over the past few years in France, opines FMI. Demand for lactose-free butter is increasing among health-conscious consumers, especially in France.
Lactose-free dairy butter consists of the same nutrients as that present in dairy butter. This is expected to result in a surging demand for lactose-free butter in the coming years.
Increasing consumption of lactose-free butter in countries such as Germany and France is encouraging manufacturers to produce in larger quantities to meet the rising demand. Furthermore, Germany is expected to account for the maximum market share in Europe, followed by France, over the assessment period.
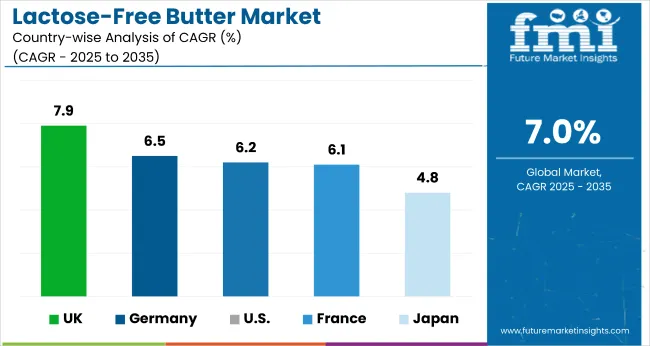
Regional Markets | CAGR (2023 to 2033) |
---|---|
United Kingdom | 7.9% |
China | 5.2% |
India | 12.4% |
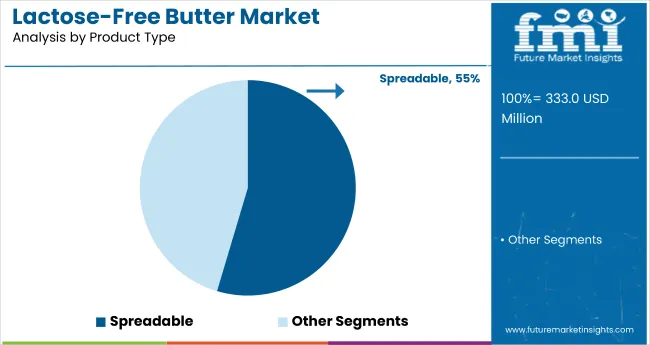
Spreadable Lactose-free Butter is a Widely Preferred Product Type
Spreadable lactose-free butter is expected to account for the maximum market share over the forecast period. This can be attributed to low cholesterol and low-fat content and its ability to maintain a soft texture even at a very low temperature which makes it easy to spread.
Owing to a rise in demand, key players are adopting new and updated technologies to increase their production across the globe. This is likely to positively influence the sales of the lactose-free butter market in the near future.
Category | Top Segment |
---|---|
By Application | Household or Retail Sector |
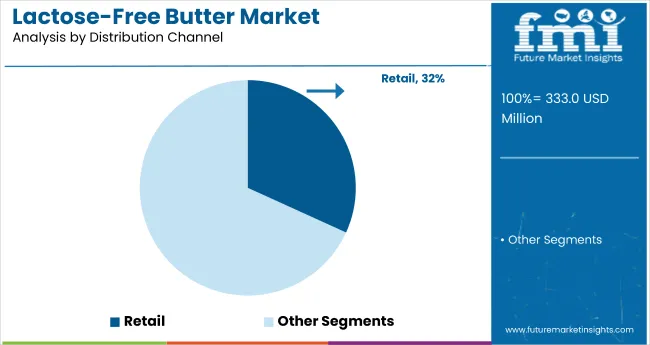
By Distribution Channel | Supermarket or Hypermarket |
Category | Market Share in Percentage |
---|---|
By Application | 43.6% |
By Distribution Channel | 31.8% |
Online Channel to Influence Market Growth
Since e-commerce is gradually becoming a primarily preferred channel by consumers for grocery purchasing, lactose-free butter suppliers are looking forward to introducing their products on online portals for business expansion. Thus, the online channel is predicted to continue exhibiting high growth through the forecast period.
Competition Landscape: Top Companies in the Lactose-free Butter Market
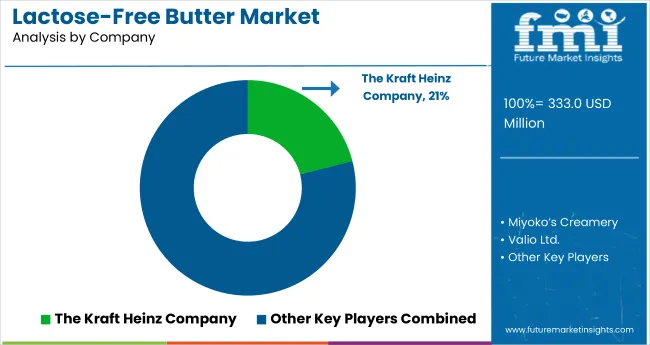
The overall market is fragmented globally, with key companies including Arla Foods, Challenge Dairy, Redwood Hill Farm & Creamery, Agropur, and Upfield controlling a sizable portion of the revenue share. Given the market's enormous potential and limited entry barriers, new players are entering quickly which is anticipated to diversify the market further.
Existing players are focusing on introducing and innovating a wide variety of products to attract a sizable number of customers and enhance brand loyalty. In areas where there is a high demand for lactose-free butter new start-ups have emerged making the regions competitive in recent years.
Challenge Dairy Foods Inc., which is a Dublin-based business, announced in December 2021 to launch a lactose-free butter with the essence of avocado oil. Besides naturally obtained avocado oils, this new premium lactose-free butter also claims to have consisted of premium omega fatty acids and sea salt.
Reese's Company debuted its lactose-free peanut butter cups in March 2023 which are created with plant-based components. These brand-new vegan peanut butter cups are coated in chocolate derived from oats and rice and have with same traditional peanut butter.
The natural peanut butter company EATNUF from Singapore declared in October 2022 that it is going to increase its market share in Malaysia and China in forthcoming years. The business planned to begin offering black sesame seed spread alongside its traditional almond and cashew nut butter within a year on online shopping channels.
IKEA announced in February 2023 its intentions to ‘remove or replace’ dairy items from all its stores in order to reduce its carbon impact. A 2022 Sustainability Report from this Swedish retailer looked at how the business may become climate-positive by 2030.
Attribute | Details |
---|---|
Forecast Period | 2023 to 2033 |
Historical Data Available for | 2018 to 2022 |
Market Analysis | USD million or billion for Value and MT for Volume |
Key Regions Covered | North America; Latin America; Europe; East Asia; South Asia; Oceania; and the Middle East & Africa |
Key Countries Covered | The United States, Canada, Brazil, Mexico, Chile, Peru, Germany, the United Kingdom, Spain, Italy, France, Russia, Poland, China, India, Japan, Australia, New Zealand, GCC Countries, North Africa, South Africa, and Turkey |
Key Segments Covered | By Product Type, By Nature, By Source, By End Use, By Distribution Channel, and By Region |
Key Companies Profiled | Agropur Dairy Cooperative; Challenge Dairy Company; Parmalat S.p.A; Uelzena Ingredients; CAPSA Food Company; Valio Ltd.; Butterfields Butter LLC; Miyoko’s Creamery; Molkerei Biedermann AG; The Kraft Heinz Company; The Hain Celestial Group, Inc.; Cargill Inc.; Corbion Inc.; Kerry Group PLC; Ingredion Incorporated; Chr Hasen A/S; Dupont Company; Kellogg Company; General Mills, Inc. |
Report Coverage | Market Forecast, Company Share Analysis, Competition Intelligence, Drivers, Restraints, Opportunities and Threats Analysis, Market Dynamics and Challenges, and Strategic Growth Initiatives |
Customization & Pricing | Available upon Request |
Table 1: Global Market Value (US$ Million) Forecast by Region, 2018 to 2033
Table 2: Global Market Volume (MT) Forecast by Region, 2018 to 2033
Table 3: Global Market Value (US$ Million) Forecast by Product Type, 2018 to 2033
Table 4: Global Market Volume (MT) Forecast by Product Type, 2018 to 2033
Table 5: Global Market Value (US$ Million) Forecast by Nature, 2018 to 2033
Table 6: Global Market Volume (MT) Forecast by Nature, 2018 to 2033
Table 7: Global Market Value (US$ Million) Forecast by Source, 2018 to 2033
Table 8: Global Market Volume (MT) Forecast by Source, 2018 to 2033
Table 9: Global Market Value (US$ Million) Forecast by End Use, 2018 to 2033
Table 10: Global Market Volume (MT) Forecast by End Use, 2018 to 2033
Table 11: Global Market Value (US$ Million) Forecast by Distribution Channel, 2018 to 2033
Table 12: Global Market Volume (MT) Forecast by Distribution Channel, 2018 to 2033
Table 13: North America Market Value (US$ Million) Forecast by Country, 2018 to 2033
Table 14: North America Market Volume (MT) Forecast by Country, 2018 to 2033
Table 15: North America Market Value (US$ Million) Forecast by Product Type, 2018 to 2033
Table 16: North America Market Volume (MT) Forecast by Product Type, 2018 to 2033
Table 17: North America Market Value (US$ Million) Forecast by Nature, 2018 to 2033
Table 18: North America Market Volume (MT) Forecast by Nature, 2018 to 2033
Table 19: North America Market Value (US$ Million) Forecast by Source, 2018 to 2033
Table 20: North America Market Volume (MT) Forecast by Source, 2018 to 2033
Table 21: North America Market Value (US$ Million) Forecast by End Use, 2018 to 2033
Table 22: North America Market Volume (MT) Forecast by End Use, 2018 to 2033
Table 23: North America Market Value (US$ Million) Forecast by Distribution Channel, 2018 to 2033
Table 24: North America Market Volume (MT) Forecast by Distribution Channel, 2018 to 2033
Table 25: Latin America Market Value (US$ Million) Forecast by Country, 2018 to 2033
Table 26: Latin America Market Volume (MT) Forecast by Country, 2018 to 2033
Table 27: Latin America Market Value (US$ Million) Forecast by Product Type, 2018 to 2033
Table 28: Latin America Market Volume (MT) Forecast by Product Type, 2018 to 2033
Table 29: Latin America Market Value (US$ Million) Forecast by Nature, 2018 to 2033
Table 30: Latin America Market Volume (MT) Forecast by Nature, 2018 to 2033
Table 31: Latin America Market Value (US$ Million) Forecast by Source, 2018 to 2033
Table 32: Latin America Market Volume (MT) Forecast by Source, 2018 to 2033
Table 33: Latin America Market Value (US$ Million) Forecast by End Use, 2018 to 2033
Table 34: Latin America Market Volume (MT) Forecast by End Use, 2018 to 2033
Table 35: Latin America Market Value (US$ Million) Forecast by Distribution Channel, 2018 to 2033
Table 36: Latin America Market Volume (MT) Forecast by Distribution Channel, 2018 to 2033
Table 37: Europe Market Value (US$ Million) Forecast by Country, 2018 to 2033
Table 38: Europe Market Volume (MT) Forecast by Country, 2018 to 2033
Table 39: Europe Market Value (US$ Million) Forecast by Product Type, 2018 to 2033
Table 40: Europe Market Volume (MT) Forecast by Product Type, 2018 to 2033
Table 41: Europe Market Value (US$ Million) Forecast by Nature, 2018 to 2033
Table 42: Europe Market Volume (MT) Forecast by Nature, 2018 to 2033
Table 43: Europe Market Value (US$ Million) Forecast by Source, 2018 to 2033
Table 44: Europe Market Volume (MT) Forecast by Source, 2018 to 2033
Table 45: Europe Market Value (US$ Million) Forecast by End Use, 2018 to 2033
Table 46: Europe Market Volume (MT) Forecast by End Use, 2018 to 2033
Table 47: Europe Market Value (US$ Million) Forecast by Distribution Channel, 2018 to 2033
Table 48: Europe Market Volume (MT) Forecast by Distribution Channel, 2018 to 2033
Table 49: Asia Pacific Market Value (US$ Million) Forecast by Country, 2018 to 2033
Table 50: Asia Pacific Market Volume (MT) Forecast by Country, 2018 to 2033
Table 51: Asia Pacific Market Value (US$ Million) Forecast by Product Type, 2018 to 2033
Table 52: Asia Pacific Market Volume (MT) Forecast by Product Type, 2018 to 2033
Table 53: Asia Pacific Market Value (US$ Million) Forecast by Nature, 2018 to 2033
Table 54: Asia Pacific Market Volume (MT) Forecast by Nature, 2018 to 2033
Table 55: Asia Pacific Market Value (US$ Million) Forecast by Source, 2018 to 2033
Table 56: Asia Pacific Market Volume (MT) Forecast by Source, 2018 to 2033
Table 57: Asia Pacific Market Value (US$ Million) Forecast by End Use, 2018 to 2033
Table 58: Asia Pacific Market Volume (MT) Forecast by End Use, 2018 to 2033
Table 59: Asia Pacific Market Value (US$ Million) Forecast by Distribution Channel, 2018 to 2033
Table 60: Asia Pacific Market Volume (MT) Forecast by Distribution Channel, 2018 to 2033
Table 61: MEA Market Value (US$ Million) Forecast by Country, 2018 to 2033
Table 62: MEA Market Volume (MT) Forecast by Country, 2018 to 2033
Table 63: MEA Market Value (US$ Million) Forecast by Product Type, 2018 to 2033
Table 64: MEA Market Volume (MT) Forecast by Product Type, 2018 to 2033
Table 65: MEA Market Value (US$ Million) Forecast by Nature, 2018 to 2033
Table 66: MEA Market Volume (MT) Forecast by Nature, 2018 to 2033
Table 67: MEA Market Value (US$ Million) Forecast by Source, 2018 to 2033
Table 68: MEA Market Volume (MT) Forecast by Source, 2018 to 2033
Table 69: MEA Market Value (US$ Million) Forecast by End Use, 2018 to 2033
Table 70: MEA Market Volume (MT) Forecast by End Use, 2018 to 2033
Table 71: MEA Market Value (US$ Million) Forecast by Distribution Channel, 2018 to 2033
Table 72: MEA Market Volume (MT) Forecast by Distribution Channel, 2018 to 2033
Figure 1: Global Market Value (US$ Million) by Product Type, 2023 to 2033
Figure 2: Global Market Value (US$ Million) by Nature, 2023 to 2033
Figure 3: Global Market Value (US$ Million) by Source, 2023 to 2033
Figure 4: Global Market Value (US$ Million) by End Use, 2023 to 2033
Figure 5: Global Market Value (US$ Million) by Distribution Channel, 2023 to 2033
Figure 6: Global Market Value (US$ Million) by Region, 2023 to 2033
Figure 7: Global Market Value (US$ Million) Analysis by Region, 2018 to 2033
Figure 8: Global Market Volume (MT) Analysis by Region, 2018 to 2033
Figure 9: Global Market Value Share (%) and BPS Analysis by Region, 2023 to 2033
Figure 10: Global Market Y-o-Y Growth (%) Projections by Region, 2023 to 2033
Figure 11: Global Market Value (US$ Million) Analysis by Product Type, 2018 to 2033
Figure 12: Global Market Volume (MT) Analysis by Product Type, 2018 to 2033
Figure 13: Global Market Value Share (%) and BPS Analysis by Product Type, 2023 to 2033
Figure 14: Global Market Y-o-Y Growth (%) Projections by Product Type, 2023 to 2033
Figure 15: Global Market Value (US$ Million) Analysis by Nature, 2018 to 2033
Figure 16: Global Market Volume (MT) Analysis by Nature, 2018 to 2033
Figure 17: Global Market Value Share (%) and BPS Analysis by Nature, 2023 to 2033
Figure 18: Global Market Y-o-Y Growth (%) Projections by Nature, 2023 to 2033
Figure 19: Global Market Value (US$ Million) Analysis by Source, 2018 to 2033
Figure 20: Global Market Volume (MT) Analysis by Source, 2018 to 2033
Figure 21: Global Market Value Share (%) and BPS Analysis by Source, 2023 to 2033
Figure 22: Global Market Y-o-Y Growth (%) Projections by Source, 2023 to 2033
Figure 23: Global Market Value (US$ Million) Analysis by End Use, 2018 to 2033
Figure 24: Global Market Volume (MT) Analysis by End Use, 2018 to 2033
Figure 25: Global Market Value Share (%) and BPS Analysis by End Use, 2023 to 2033
Figure 26: Global Market Y-o-Y Growth (%) Projections by End Use, 2023 to 2033
Figure 27: Global Market Value (US$ Million) Analysis by Distribution Channel, 2018 to 2033
Figure 28: Global Market Volume (MT) Analysis by Distribution Channel, 2018 to 2033
Figure 29: Global Market Value Share (%) and BPS Analysis by Distribution Channel, 2023 to 2033
Figure 30: Global Market Y-o-Y Growth (%) Projections by Distribution Channel, 2023 to 2033
Figure 31: Global Market Attractiveness by Product Type, 2023 to 2033
Figure 32: Global Market Attractiveness by Nature, 2023 to 2033
Figure 33: Global Market Attractiveness by Source, 2023 to 2033
Figure 34: Global Market Attractiveness by End Use, 2023 to 2033
Figure 35: Global Market Attractiveness by Distribution Channel, 2023 to 2033
Figure 36: Global Market Attractiveness by Region, 2023 to 2033
Figure 37: North America Market Value (US$ Million) by Product Type, 2023 to 2033
Figure 38: North America Market Value (US$ Million) by Nature, 2023 to 2033
Figure 39: North America Market Value (US$ Million) by Source, 2023 to 2033
Figure 40: North America Market Value (US$ Million) by End Use, 2023 to 2033
Figure 41: North America Market Value (US$ Million) by Distribution Channel, 2023 to 2033
Figure 42: North America Market Value (US$ Million) by Country, 2023 to 2033
Figure 43: North America Market Value (US$ Million) Analysis by Country, 2018 to 2033
Figure 44: North America Market Volume (MT) Analysis by Country, 2018 to 2033
Figure 45: North America Market Value Share (%) and BPS Analysis by Country, 2023 to 2033
Figure 46: North America Market Y-o-Y Growth (%) Projections by Country, 2023 to 2033
Figure 47: North America Market Value (US$ Million) Analysis by Product Type, 2018 to 2033
Figure 48: North America Market Volume (MT) Analysis by Product Type, 2018 to 2033
Figure 49: North America Market Value Share (%) and BPS Analysis by Product Type, 2023 to 2033
Figure 50: North America Market Y-o-Y Growth (%) Projections by Product Type, 2023 to 2033
Figure 51: North America Market Value (US$ Million) Analysis by Nature, 2018 to 2033
Figure 52: North America Market Volume (MT) Analysis by Nature, 2018 to 2033
Figure 53: North America Market Value Share (%) and BPS Analysis by Nature, 2023 to 2033
Figure 54: North America Market Y-o-Y Growth (%) Projections by Nature, 2023 to 2033
Figure 55: North America Market Value (US$ Million) Analysis by Source, 2018 to 2033
Figure 56: North America Market Volume (MT) Analysis by Source, 2018 to 2033
Figure 57: North America Market Value Share (%) and BPS Analysis by Source, 2023 to 2033
Figure 58: North America Market Y-o-Y Growth (%) Projections by Source, 2023 to 2033
Figure 59: North America Market Value (US$ Million) Analysis by End Use, 2018 to 2033
Figure 60: North America Market Volume (MT) Analysis by End Use, 2018 to 2033
Figure 61: North America Market Value Share (%) and BPS Analysis by End Use, 2023 to 2033
Figure 62: North America Market Y-o-Y Growth (%) Projections by End Use, 2023 to 2033
Figure 63: North America Market Value (US$ Million) Analysis by Distribution Channel, 2018 to 2033
Figure 64: North America Market Volume (MT) Analysis by Distribution Channel, 2018 to 2033
Figure 65: North America Market Value Share (%) and BPS Analysis by Distribution Channel, 2023 to 2033
Figure 66: North America Market Y-o-Y Growth (%) Projections by Distribution Channel, 2023 to 2033
Figure 67: North America Market Attractiveness by Product Type, 2023 to 2033
Figure 68: North America Market Attractiveness by Nature, 2023 to 2033
Figure 69: North America Market Attractiveness by Source, 2023 to 2033
Figure 70: North America Market Attractiveness by End Use, 2023 to 2033
Figure 71: North America Market Attractiveness by Distribution Channel, 2023 to 2033
Figure 72: North America Market Attractiveness by Country, 2023 to 2033
Figure 73: Latin America Market Value (US$ Million) by Product Type, 2023 to 2033
Figure 74: Latin America Market Value (US$ Million) by Nature, 2023 to 2033
Figure 75: Latin America Market Value (US$ Million) by Source, 2023 to 2033
Figure 76: Latin America Market Value (US$ Million) by End Use, 2023 to 2033
Figure 77: Latin America Market Value (US$ Million) by Distribution Channel, 2023 to 2033
Figure 78: Latin America Market Value (US$ Million) by Country, 2023 to 2033
Figure 79: Latin America Market Value (US$ Million) Analysis by Country, 2018 to 2033
Figure 80: Latin America Market Volume (MT) Analysis by Country, 2018 to 2033
Figure 81: Latin America Market Value Share (%) and BPS Analysis by Country, 2023 to 2033
Figure 82: Latin America Market Y-o-Y Growth (%) Projections by Country, 2023 to 2033
Figure 83: Latin America Market Value (US$ Million) Analysis by Product Type, 2018 to 2033
Figure 84: Latin America Market Volume (MT) Analysis by Product Type, 2018 to 2033
Figure 85: Latin America Market Value Share (%) and BPS Analysis by Product Type, 2023 to 2033
Figure 86: Latin America Market Y-o-Y Growth (%) Projections by Product Type, 2023 to 2033
Figure 87: Latin America Market Value (US$ Million) Analysis by Nature, 2018 to 2033
Figure 88: Latin America Market Volume (MT) Analysis by Nature, 2018 to 2033
Figure 89: Latin America Market Value Share (%) and BPS Analysis by Nature, 2023 to 2033
Figure 90: Latin America Market Y-o-Y Growth (%) Projections by Nature, 2023 to 2033
Figure 91: Latin America Market Value (US$ Million) Analysis by Source, 2018 to 2033
Figure 92: Latin America Market Volume (MT) Analysis by Source, 2018 to 2033
Figure 93: Latin America Market Value Share (%) and BPS Analysis by Source, 2023 to 2033
Figure 94: Latin America Market Y-o-Y Growth (%) Projections by Source, 2023 to 2033
Figure 95: Latin America Market Value (US$ Million) Analysis by End Use, 2018 to 2033
Figure 96: Latin America Market Volume (MT) Analysis by End Use, 2018 to 2033
Figure 97: Latin America Market Value Share (%) and BPS Analysis by End Use, 2023 to 2033
Figure 98: Latin America Market Y-o-Y Growth (%) Projections by End Use, 2023 to 2033
Figure 99: Latin America Market Value (US$ Million) Analysis by Distribution Channel, 2018 to 2033
Figure 100: Latin America Market Volume (MT) Analysis by Distribution Channel, 2018 to 2033
Figure 101: Latin America Market Value Share (%) and BPS Analysis by Distribution Channel, 2023 to 2033
Figure 102: Latin America Market Y-o-Y Growth (%) Projections by Distribution Channel, 2023 to 2033
Figure 103: Latin America Market Attractiveness by Product Type, 2023 to 2033
Figure 104: Latin America Market Attractiveness by Nature, 2023 to 2033
Figure 105: Latin America Market Attractiveness by Source, 2023 to 2033
Figure 106: Latin America Market Attractiveness by End Use, 2023 to 2033
Figure 107: Latin America Market Attractiveness by Distribution Channel, 2023 to 2033
Figure 108: Latin America Market Attractiveness by Country, 2023 to 2033
Figure 109: Europe Market Value (US$ Million) by Product Type, 2023 to 2033
Figure 110: Europe Market Value (US$ Million) by Nature, 2023 to 2033
Figure 111: Europe Market Value (US$ Million) by Source, 2023 to 2033
Figure 112: Europe Market Value (US$ Million) by End Use, 2023 to 2033
Figure 113: Europe Market Value (US$ Million) by Distribution Channel, 2023 to 2033
Figure 114: Europe Market Value (US$ Million) by Country, 2023 to 2033
Figure 115: Europe Market Value (US$ Million) Analysis by Country, 2018 to 2033
Figure 116: Europe Market Volume (MT) Analysis by Country, 2018 to 2033
Figure 117: Europe Market Value Share (%) and BPS Analysis by Country, 2023 to 2033
Figure 118: Europe Market Y-o-Y Growth (%) Projections by Country, 2023 to 2033
Figure 119: Europe Market Value (US$ Million) Analysis by Product Type, 2018 to 2033
Figure 120: Europe Market Volume (MT) Analysis by Product Type, 2018 to 2033
Figure 121: Europe Market Value Share (%) and BPS Analysis by Product Type, 2023 to 2033
Figure 122: Europe Market Y-o-Y Growth (%) Projections by Product Type, 2023 to 2033
Figure 123: Europe Market Value (US$ Million) Analysis by Nature, 2018 to 2033
Figure 124: Europe Market Volume (MT) Analysis by Nature, 2018 to 2033
Figure 125: Europe Market Value Share (%) and BPS Analysis by Nature, 2023 to 2033
Figure 126: Europe Market Y-o-Y Growth (%) Projections by Nature, 2023 to 2033
Figure 127: Europe Market Value (US$ Million) Analysis by Source, 2018 to 2033
Figure 128: Europe Market Volume (MT) Analysis by Source, 2018 to 2033
Figure 129: Europe Market Value Share (%) and BPS Analysis by Source, 2023 to 2033
Figure 130: Europe Market Y-o-Y Growth (%) Projections by Source, 2023 to 2033
Figure 131: Europe Market Value (US$ Million) Analysis by End Use, 2018 to 2033
Figure 132: Europe Market Volume (MT) Analysis by End Use, 2018 to 2033
Figure 133: Europe Market Value Share (%) and BPS Analysis by End Use, 2023 to 2033
Figure 134: Europe Market Y-o-Y Growth (%) Projections by End Use, 2023 to 2033
Figure 135: Europe Market Value (US$ Million) Analysis by Distribution Channel, 2018 to 2033
Figure 136: Europe Market Volume (MT) Analysis by Distribution Channel, 2018 to 2033
Figure 137: Europe Market Value Share (%) and BPS Analysis by Distribution Channel, 2023 to 2033
Figure 138: Europe Market Y-o-Y Growth (%) Projections by Distribution Channel, 2023 to 2033
Figure 139: Europe Market Attractiveness by Product Type, 2023 to 2033
Figure 140: Europe Market Attractiveness by Nature, 2023 to 2033
Figure 141: Europe Market Attractiveness by Source, 2023 to 2033
Figure 142: Europe Market Attractiveness by End Use, 2023 to 2033
Figure 143: Europe Market Attractiveness by Distribution Channel, 2023 to 2033
Figure 144: Europe Market Attractiveness by Country, 2023 to 2033
Figure 145: Asia Pacific Market Value (US$ Million) by Product Type, 2023 to 2033
Figure 146: Asia Pacific Market Value (US$ Million) by Nature, 2023 to 2033
Figure 147: Asia Pacific Market Value (US$ Million) by Source, 2023 to 2033
Figure 148: Asia Pacific Market Value (US$ Million) by End Use, 2023 to 2033
Figure 149: Asia Pacific Market Value (US$ Million) by Distribution Channel, 2023 to 2033
Figure 150: Asia Pacific Market Value (US$ Million) by Country, 2023 to 2033
Figure 151: Asia Pacific Market Value (US$ Million) Analysis by Country, 2018 to 2033
Figure 152: Asia Pacific Market Volume (MT) Analysis by Country, 2018 to 2033
Figure 153: Asia Pacific Market Value Share (%) and BPS Analysis by Country, 2023 to 2033
Figure 154: Asia Pacific Market Y-o-Y Growth (%) Projections by Country, 2023 to 2033
Figure 155: Asia Pacific Market Value (US$ Million) Analysis by Product Type, 2018 to 2033
Figure 156: Asia Pacific Market Volume (MT) Analysis by Product Type, 2018 to 2033
Figure 157: Asia Pacific Market Value Share (%) and BPS Analysis by Product Type, 2023 to 2033
Figure 158: Asia Pacific Market Y-o-Y Growth (%) Projections by Product Type, 2023 to 2033
Figure 159: Asia Pacific Market Value (US$ Million) Analysis by Nature, 2018 to 2033
Figure 160: Asia Pacific Market Volume (MT) Analysis by Nature, 2018 to 2033
Figure 161: Asia Pacific Market Value Share (%) and BPS Analysis by Nature, 2023 to 2033
Figure 162: Asia Pacific Market Y-o-Y Growth (%) Projections by Nature, 2023 to 2033
Figure 163: Asia Pacific Market Value (US$ Million) Analysis by Source, 2018 to 2033
Figure 164: Asia Pacific Market Volume (MT) Analysis by Source, 2018 to 2033
Figure 165: Asia Pacific Market Value Share (%) and BPS Analysis by Source, 2023 to 2033
Figure 166: Asia Pacific Market Y-o-Y Growth (%) Projections by Source, 2023 to 2033
Figure 167: Asia Pacific Market Value (US$ Million) Analysis by End Use, 2018 to 2033
Figure 168: Asia Pacific Market Volume (MT) Analysis by End Use, 2018 to 2033
Figure 169: Asia Pacific Market Value Share (%) and BPS Analysis by End Use, 2023 to 2033
Figure 170: Asia Pacific Market Y-o-Y Growth (%) Projections by End Use, 2023 to 2033
Figure 171: Asia Pacific Market Value (US$ Million) Analysis by Distribution Channel, 2018 to 2033
Figure 172: Asia Pacific Market Volume (MT) Analysis by Distribution Channel, 2018 to 2033
Figure 173: Asia Pacific Market Value Share (%) and BPS Analysis by Distribution Channel, 2023 to 2033
Figure 174: Asia Pacific Market Y-o-Y Growth (%) Projections by Distribution Channel, 2023 to 2033
Figure 175: Asia Pacific Market Attractiveness by Product Type, 2023 to 2033
Figure 176: Asia Pacific Market Attractiveness by Nature, 2023 to 2033
Figure 177: Asia Pacific Market Attractiveness by Source, 2023 to 2033
Figure 178: Asia Pacific Market Attractiveness by End Use, 2023 to 2033
Figure 179: Asia Pacific Market Attractiveness by Distribution Channel, 2023 to 2033
Figure 180: Asia Pacific Market Attractiveness by Country, 2023 to 2033
Figure 181: MEA Market Value (US$ Million) by Product Type, 2023 to 2033
Figure 182: MEA Market Value (US$ Million) by Nature, 2023 to 2033
Figure 183: MEA Market Value (US$ Million) by Source, 2023 to 2033
Figure 184: MEA Market Value (US$ Million) by End Use, 2023 to 2033
Figure 185: MEA Market Value (US$ Million) by Distribution Channel, 2023 to 2033
Figure 186: MEA Market Value (US$ Million) by Country, 2023 to 2033
Figure 187: MEA Market Value (US$ Million) Analysis by Country, 2018 to 2033
Figure 188: MEA Market Volume (MT) Analysis by Country, 2018 to 2033
Figure 189: MEA Market Value Share (%) and BPS Analysis by Country, 2023 to 2033
Figure 190: MEA Market Y-o-Y Growth (%) Projections by Country, 2023 to 2033
Figure 191: MEA Market Value (US$ Million) Analysis by Product Type, 2018 to 2033
Figure 192: MEA Market Volume (MT) Analysis by Product Type, 2018 to 2033
Figure 193: MEA Market Value Share (%) and BPS Analysis by Product Type, 2023 to 2033
Figure 194: MEA Market Y-o-Y Growth (%) Projections by Product Type, 2023 to 2033
Figure 195: MEA Market Value (US$ Million) Analysis by Nature, 2018 to 2033
Figure 196: MEA Market Volume (MT) Analysis by Nature, 2018 to 2033
Figure 197: MEA Market Value Share (%) and BPS Analysis by Nature, 2023 to 2033
Figure 198: MEA Market Y-o-Y Growth (%) Projections by Nature, 2023 to 2033
Figure 199: MEA Market Value (US$ Million) Analysis by Source, 2018 to 2033
Figure 200: MEA Market Volume (MT) Analysis by Source, 2018 to 2033
Figure 201: MEA Market Value Share (%) and BPS Analysis by Source, 2023 to 2033
Figure 202: MEA Market Y-o-Y Growth (%) Projections by Source, 2023 to 2033
Figure 203: MEA Market Value (US$ Million) Analysis by End Use, 2018 to 2033
Figure 204: MEA Market Volume (MT) Analysis by End Use, 2018 to 2033
Figure 205: MEA Market Value Share (%) and BPS Analysis by End Use, 2023 to 2033
Figure 206: MEA Market Y-o-Y Growth (%) Projections by End Use, 2023 to 2033
Figure 207: MEA Market Value (US$ Million) Analysis by Distribution Channel, 2018 to 2033
Figure 208: MEA Market Volume (MT) Analysis by Distribution Channel, 2018 to 2033
Figure 209: MEA Market Value Share (%) and BPS Analysis by Distribution Channel, 2023 to 2033
Figure 210: MEA Market Y-o-Y Growth (%) Projections by Distribution Channel, 2023 to 2033
Figure 211: MEA Market Attractiveness by Product Type, 2023 to 2033
Figure 212: MEA Market Attractiveness by Nature, 2023 to 2033
Figure 213: MEA Market Attractiveness by Source, 2023 to 2033
Figure 214: MEA Market Attractiveness by End Use, 2023 to 2033
Figure 215: MEA Market Attractiveness by Distribution Channel, 2023 to 2033
Figure 216: MEA Market Attractiveness by Country, 2023 to 2033
The market reached a valuation of USD 299.52 million in 2022.
Cargill Inc., Corbion Inc., and Kerry Group PLC are the key market players.
The household or retail sector pushes at 43.6% of the market growth.
The market is valued at USD 311 million in 2023.
The market is estimated to reach USD 603 million by 2033.
Explore Dairy and Dairy Products Insights
Thank you!
You will receive an email from our Business Development Manager. Please be sure to check your SPAM/JUNK folder too.