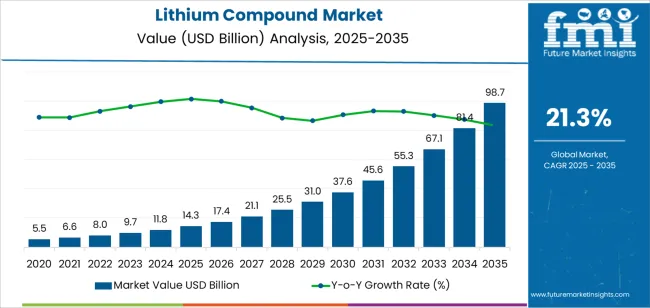
The lithium compound market is anticipated to be worth USD 11.8 billion in 2024. The market is expected to grow at an astounding rate from 2024 to 2034, with a CAGR of 21.3%. By 2034, the market value is predicted to hit USD 81.5 billion.
Lithium Compound Market Analysis
Attributes | Details |
---|---|
Lithium Compound Market Value for 2024 | USD 11.8 billion |
Projected Market Value for 2034 | USD 81.5 billion |
Value-based CAGR of Market for 2024 to 2034 | 21.3% |
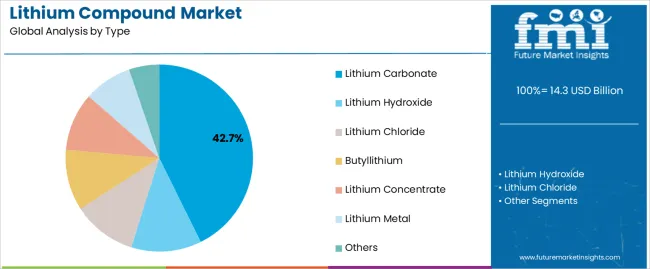
For the 2024 to 2034 period, lithium chloride is expected to progress at a CAGR of 21.0%. Some of the key drivers for the increasing use of lithium chloride are:
Attributes | Details |
---|---|
Top Type | Lithium Chloride |
CAGR (2024 to 2034) | 21.0% |
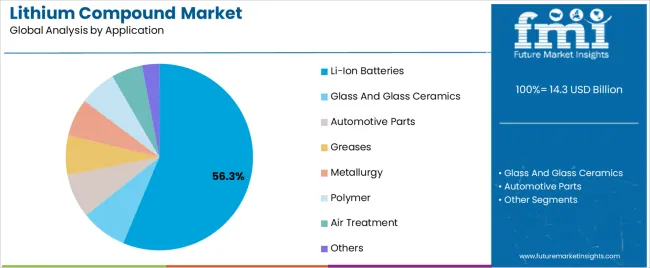
Li-ion batteries are predicted to progress at a CAGR of 20.9% over the forecast period. Some of the key drivers for its progress include:
Attributes | Details |
---|---|
Top Application | Li-ion Batteries |
CAGR (2024 to 2034) | 20.9% |
Impressive quantities of automobile production in the Asia Pacific, including electric vehicles, are signaling a positive outlook for the market in the region. The region’s burgeoning chemical research industry also aids in the market’s development.
The overall pharmaceutical use of the compound is also increasing, with the admittance rates to hospitals reaching substantial quantities in the regions.
Countries | CAGR |
---|---|
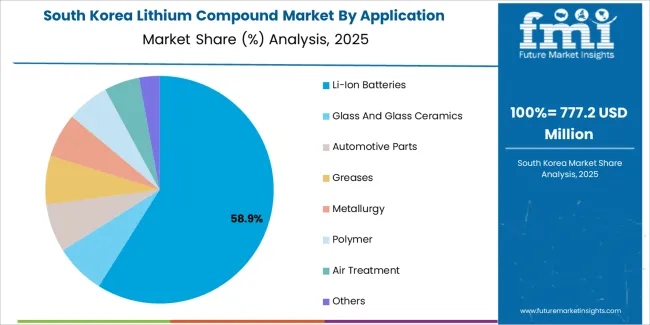
South Korea | 23.4% |
Japan | 22.9% |
China | 21.9% |
United Kingdom | 22.6% |
United States | 21.7% |
The market is set to register a CAGR of 23.4% in South Korea for the forecast period. The key drivers for growth are:
The CAGR for lithium compound in China is tipped to be 21.9% over the forecast period. Some of the key factors driving the growth are:
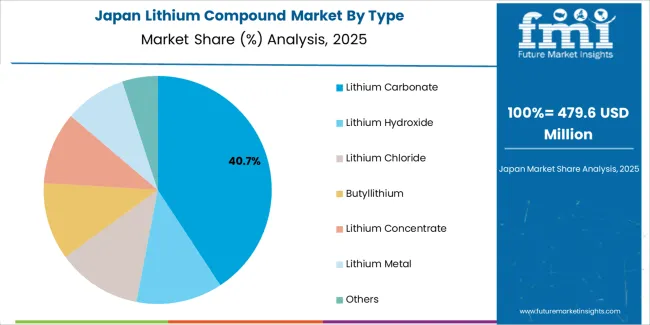
The market is expected to register a CAGR of 22.9% in Japan. Some of the key trends include:
The market is expected to progress at a CAGR of 22.6% in the United Kingdom. Key factors driving the growth are:
The market is anticipated to register a CAGR of 21.7% in the United States over the forecast period. Some prominent factors driving growth are:
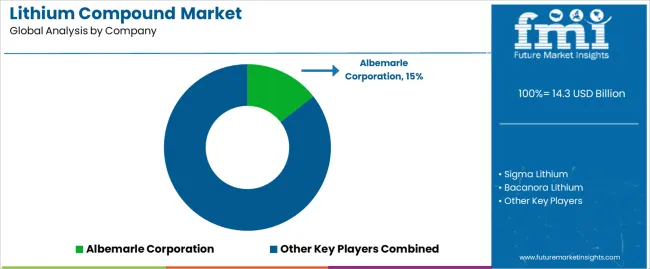
Giants with reputable names in lithium compound manufacturing have made their presence known in the market. Though there is still scope to do business for small-scale players and new entrants, the big-name players control a substantial portion of the market share.
Industry players are on the lookout for new avenues of growth in the form of developing new applications for the product, especially in industrial use. Newer compounds are also being tested for their viability in replacing older compounds.
Recent Developments in the Lithium Compound Market
Table 1: Global Market Value (US$ Million) Forecast by Region, 2019 to 2034
Table 2: Global Market Volume (Tons) Forecast by Region, 2019 to 2034
Table 3: Global Market Value (US$ Million) Forecast by Type, 2019 to 2034
Table 4: Global Market Volume (Tons) Forecast by Type, 2019 to 2034
Table 5: Global Market Value (US$ Million) Forecast by Application, 2019 to 2034
Table 6: Global Market Volume (Tons) Forecast by Application, 2019 to 2034
Table 7: North America Market Value (US$ Million) Forecast by Country, 2019 to 2034
Table 8: North America Market Volume (Tons) Forecast by Country, 2019 to 2034
Table 9: North America Market Value (US$ Million) Forecast by Type, 2019 to 2034
Table 10: North America Market Volume (Tons) Forecast by Type, 2019 to 2034
Table 11: North America Market Value (US$ Million) Forecast by Application, 2019 to 2034
Table 12: North America Market Volume (Tons) Forecast by Application, 2019 to 2034
Table 13: Latin America Market Value (US$ Million) Forecast by Country, 2019 to 2034
Table 14: Latin America Market Volume (Tons) Forecast by Country, 2019 to 2034
Table 15: Latin America Market Value (US$ Million) Forecast by Type, 2019 to 2034
Table 16: Latin America Market Volume (Tons) Forecast by Type, 2019 to 2034
Table 17: Latin America Market Value (US$ Million) Forecast by Application, 2019 to 2034
Table 18: Latin America Market Volume (Tons) Forecast by Application, 2019 to 2034
Table 19: Europe Market Value (US$ Million) Forecast by Country, 2019 to 2034
Table 20: Europe Market Volume (Tons) Forecast by Country, 2019 to 2034
Table 21: Europe Market Value (US$ Million) Forecast by Type, 2019 to 2034
Table 22: Europe Market Volume (Tons) Forecast by Type, 2019 to 2034
Table 23: Europe Market Value (US$ Million) Forecast by Application, 2019 to 2034
Table 24: Europe Market Volume (Tons) Forecast by Application, 2019 to 2034
Table 25: East Asia Market Value (US$ Million) Forecast by Country, 2019 to 2034
Table 26: East Asia Market Volume (Tons) Forecast by Country, 2019 to 2034
Table 27: East Asia Market Value (US$ Million) Forecast by Type, 2019 to 2034
Table 28: East Asia Market Volume (Tons) Forecast by Type, 2019 to 2034
Table 29: East Asia Market Value (US$ Million) Forecast by Application, 2019 to 2034
Table 30: East Asia Market Volume (Tons) Forecast by Application, 2019 to 2034
Table 31: South Asia Market Value (US$ Million) Forecast by Country, 2019 to 2034
Table 32: South Asia Market Volume (Tons) Forecast by Country, 2019 to 2034
Table 33: South Asia Market Value (US$ Million) Forecast by Type, 2019 to 2034
Table 34: South Asia Market Volume (Tons) Forecast by Type, 2019 to 2034
Table 35: South Asia Market Value (US$ Million) Forecast by Application, 2019 to 2034
Table 36: South Asia Market Volume (Tons) Forecast by Application, 2019 to 2034
Table 37: Oceania Market Value (US$ Million) Forecast by Country, 2019 to 2034
Table 38: Oceania Market Volume (Tons) Forecast by Country, 2019 to 2034
Table 39: Oceania Market Value (US$ Million) Forecast by Type, 2019 to 2034
Table 40: Oceania Market Volume (Tons) Forecast by Type, 2019 to 2034
Table 41: Oceania Market Value (US$ Million) Forecast by Application, 2019 to 2034
Table 42: Oceania Market Volume (Tons) Forecast by Application, 2019 to 2034
Table 43: MEA Market Value (US$ Million) Forecast by Country, 2019 to 2034
Table 44: MEA Market Volume (Tons) Forecast by Country, 2019 to 2034
Table 45: MEA Market Value (US$ Million) Forecast by Type, 2019 to 2034
Table 46: MEA Market Volume (Tons) Forecast by Type, 2019 to 2034
Table 47: MEA Market Value (US$ Million) Forecast by Application, 2019 to 2034
Table 48: MEA Market Volume (Tons) Forecast by Application, 2019 to 2034
Figure 1: Global Market Value (US$ Million) by Type, 2024 to 2034
Figure 2: Global Market Value (US$ Million) by Application, 2024 to 2034
Figure 3: Global Market Value (US$ Million) by Region, 2024 to 2034
Figure 4: Global Market Value (US$ Million) Analysis by Region, 2019 to 2034
Figure 5: Global Market Volume (Tons) Analysis by Region, 2019 to 2034
Figure 6: Global Market Value Share (%) and BPS Analysis by Region, 2024 to 2034
Figure 7: Global Market Y-o-Y Growth (%) Projections by Region, 2024 to 2034
Figure 8: Global Market Value (US$ Million) Analysis by Type, 2019 to 2034
Figure 9: Global Market Volume (Tons) Analysis by Type, 2019 to 2034
Figure 10: Global Market Value Share (%) and BPS Analysis by Type, 2024 to 2034
Figure 11: Global Market Y-o-Y Growth (%) Projections by Type, 2024 to 2034
Figure 12: Global Market Value (US$ Million) Analysis by Application, 2019 to 2034
Figure 13: Global Market Volume (Tons) Analysis by Application, 2019 to 2034
Figure 14: Global Market Value Share (%) and BPS Analysis by Application, 2024 to 2034
Figure 15: Global Market Y-o-Y Growth (%) Projections by Application, 2024 to 2034
Figure 16: Global Market Attractiveness by Type, 2024 to 2034
Figure 17: Global Market Attractiveness by Application, 2024 to 2034
Figure 18: Global Market Attractiveness by Region, 2024 to 2034
Figure 19: North America Market Value (US$ Million) by Type, 2024 to 2034
Figure 20: North America Market Value (US$ Million) by Application, 2024 to 2034
Figure 21: North America Market Value (US$ Million) by Country, 2024 to 2034
Figure 22: North America Market Value (US$ Million) Analysis by Country, 2019 to 2034
Figure 23: North America Market Volume (Tons) Analysis by Country, 2019 to 2034
Figure 24: North America Market Value Share (%) and BPS Analysis by Country, 2024 to 2034
Figure 25: North America Market Y-o-Y Growth (%) Projections by Country, 2024 to 2034
Figure 26: North America Market Value (US$ Million) Analysis by Type, 2019 to 2034
Figure 27: North America Market Volume (Tons) Analysis by Type, 2019 to 2034
Figure 28: North America Market Value Share (%) and BPS Analysis by Type, 2024 to 2034
Figure 29: North America Market Y-o-Y Growth (%) Projections by Type, 2024 to 2034
Figure 30: North America Market Value (US$ Million) Analysis by Application, 2019 to 2034
Figure 31: North America Market Volume (Tons) Analysis by Application, 2019 to 2034
Figure 32: North America Market Value Share (%) and BPS Analysis by Application, 2024 to 2034
Figure 33: North America Market Y-o-Y Growth (%) Projections by Application, 2024 to 2034
Figure 34: North America Market Attractiveness by Type, 2024 to 2034
Figure 35: North America Market Attractiveness by Application, 2024 to 2034
Figure 36: North America Market Attractiveness by Country, 2024 to 2034
Figure 37: Latin America Market Value (US$ Million) by Type, 2024 to 2034
Figure 38: Latin America Market Value (US$ Million) by Application, 2024 to 2034
Figure 39: Latin America Market Value (US$ Million) by Country, 2024 to 2034
Figure 40: Latin America Market Value (US$ Million) Analysis by Country, 2019 to 2034
Figure 41: Latin America Market Volume (Tons) Analysis by Country, 2019 to 2034
Figure 42: Latin America Market Value Share (%) and BPS Analysis by Country, 2024 to 2034
Figure 43: Latin America Market Y-o-Y Growth (%) Projections by Country, 2024 to 2034
Figure 44: Latin America Market Value (US$ Million) Analysis by Type, 2019 to 2034
Figure 45: Latin America Market Volume (Tons) Analysis by Type, 2019 to 2034
Figure 46: Latin America Market Value Share (%) and BPS Analysis by Type, 2024 to 2034
Figure 47: Latin America Market Y-o-Y Growth (%) Projections by Type, 2024 to 2034
Figure 48: Latin America Market Value (US$ Million) Analysis by Application, 2019 to 2034
Figure 49: Latin America Market Volume (Tons) Analysis by Application, 2019 to 2034
Figure 50: Latin America Market Value Share (%) and BPS Analysis by Application, 2024 to 2034
Figure 51: Latin America Market Y-o-Y Growth (%) Projections by Application, 2024 to 2034
Figure 52: Latin America Market Attractiveness by Type, 2024 to 2034
Figure 53: Latin America Market Attractiveness by Application, 2024 to 2034
Figure 54: Latin America Market Attractiveness by Country, 2024 to 2034
Figure 55: Europe Market Value (US$ Million) by Type, 2024 to 2034
Figure 56: Europe Market Value (US$ Million) by Application, 2024 to 2034
Figure 57: Europe Market Value (US$ Million) by Country, 2024 to 2034
Figure 58: Europe Market Value (US$ Million) Analysis by Country, 2019 to 2034
Figure 59: Europe Market Volume (Tons) Analysis by Country, 2019 to 2034
Figure 60: Europe Market Value Share (%) and BPS Analysis by Country, 2024 to 2034
Figure 61: Europe Market Y-o-Y Growth (%) Projections by Country, 2024 to 2034
Figure 62: Europe Market Value (US$ Million) Analysis by Type, 2019 to 2034
Figure 63: Europe Market Volume (Tons) Analysis by Type, 2019 to 2034
Figure 64: Europe Market Value Share (%) and BPS Analysis by Type, 2024 to 2034
Figure 65: Europe Market Y-o-Y Growth (%) Projections by Type, 2024 to 2034
Figure 66: Europe Market Value (US$ Million) Analysis by Application, 2019 to 2034
Figure 67: Europe Market Volume (Tons) Analysis by Application, 2019 to 2034
Figure 68: Europe Market Value Share (%) and BPS Analysis by Application, 2024 to 2034
Figure 69: Europe Market Y-o-Y Growth (%) Projections by Application, 2024 to 2034
Figure 70: Europe Market Attractiveness by Type, 2024 to 2034
Figure 71: Europe Market Attractiveness by Application, 2024 to 2034
Figure 72: Europe Market Attractiveness by Country, 2024 to 2034
Figure 73: East Asia Market Value (US$ Million) by Type, 2024 to 2034
Figure 74: East Asia Market Value (US$ Million) by Application, 2024 to 2034
Figure 75: East Asia Market Value (US$ Million) by Country, 2024 to 2034
Figure 76: East Asia Market Value (US$ Million) Analysis by Country, 2019 to 2034
Figure 77: East Asia Market Volume (Tons) Analysis by Country, 2019 to 2034
Figure 78: East Asia Market Value Share (%) and BPS Analysis by Country, 2024 to 2034
Figure 79: East Asia Market Y-o-Y Growth (%) Projections by Country, 2024 to 2034
Figure 80: East Asia Market Value (US$ Million) Analysis by Type, 2019 to 2034
Figure 81: East Asia Market Volume (Tons) Analysis by Type, 2019 to 2034
Figure 82: East Asia Market Value Share (%) and BPS Analysis by Type, 2024 to 2034
Figure 83: East Asia Market Y-o-Y Growth (%) Projections by Type, 2024 to 2034
Figure 84: East Asia Market Value (US$ Million) Analysis by Application, 2019 to 2034
Figure 85: East Asia Market Volume (Tons) Analysis by Application, 2019 to 2034
Figure 86: East Asia Market Value Share (%) and BPS Analysis by Application, 2024 to 2034
Figure 87: East Asia Market Y-o-Y Growth (%) Projections by Application, 2024 to 2034
Figure 88: East Asia Market Attractiveness by Type, 2024 to 2034
Figure 89: East Asia Market Attractiveness by Application, 2024 to 2034
Figure 90: East Asia Market Attractiveness by Country, 2024 to 2034
Figure 91: South Asia Market Value (US$ Million) by Type, 2024 to 2034
Figure 92: South Asia Market Value (US$ Million) by Application, 2024 to 2034
Figure 93: South Asia Market Value (US$ Million) by Country, 2024 to 2034
Figure 94: South Asia Market Value (US$ Million) Analysis by Country, 2019 to 2034
Figure 95: South Asia Market Volume (Tons) Analysis by Country, 2019 to 2034
Figure 96: South Asia Market Value Share (%) and BPS Analysis by Country, 2024 to 2034
Figure 97: South Asia Market Y-o-Y Growth (%) Projections by Country, 2024 to 2034
Figure 98: South Asia Market Value (US$ Million) Analysis by Type, 2019 to 2034
Figure 99: South Asia Market Volume (Tons) Analysis by Type, 2019 to 2034
Figure 100: South Asia Market Value Share (%) and BPS Analysis by Type, 2024 to 2034
Figure 101: South Asia Market Y-o-Y Growth (%) Projections by Type, 2024 to 2034
Figure 102: South Asia Market Value (US$ Million) Analysis by Application, 2019 to 2034
Figure 103: South Asia Market Volume (Tons) Analysis by Application, 2019 to 2034
Figure 104: South Asia Market Value Share (%) and BPS Analysis by Application, 2024 to 2034
Figure 105: South Asia Market Y-o-Y Growth (%) Projections by Application, 2024 to 2034
Figure 106: South Asia Market Attractiveness by Type, 2024 to 2034
Figure 107: South Asia Market Attractiveness by Application, 2024 to 2034
Figure 108: South Asia Market Attractiveness by Country, 2024 to 2034
Figure 109: Oceania Market Value (US$ Million) by Type, 2024 to 2034
Figure 110: Oceania Market Value (US$ Million) by Application, 2024 to 2034
Figure 111: Oceania Market Value (US$ Million) by Country, 2024 to 2034
Figure 112: Oceania Market Value (US$ Million) Analysis by Country, 2019 to 2034
Figure 113: Oceania Market Volume (Tons) Analysis by Country, 2019 to 2034
Figure 114: Oceania Market Value Share (%) and BPS Analysis by Country, 2024 to 2034
Figure 115: Oceania Market Y-o-Y Growth (%) Projections by Country, 2024 to 2034
Figure 116: Oceania Market Value (US$ Million) Analysis by Type, 2019 to 2034
Figure 117: Oceania Market Volume (Tons) Analysis by Type, 2019 to 2034
Figure 118: Oceania Market Value Share (%) and BPS Analysis by Type, 2024 to 2034
Figure 119: Oceania Market Y-o-Y Growth (%) Projections by Type, 2024 to 2034
Figure 120: Oceania Market Value (US$ Million) Analysis by Application, 2019 to 2034
Figure 121: Oceania Market Volume (Tons) Analysis by Application, 2019 to 2034
Figure 122: Oceania Market Value Share (%) and BPS Analysis by Application, 2024 to 2034
Figure 123: Oceania Market Y-o-Y Growth (%) Projections by Application, 2024 to 2034
Figure 124: Oceania Market Attractiveness by Type, 2024 to 2034
Figure 125: Oceania Market Attractiveness by Application, 2024 to 2034
Figure 126: Oceania Market Attractiveness by Country, 2024 to 2034
Figure 127: MEA Market Value (US$ Million) by Type, 2024 to 2034
Figure 128: MEA Market Value (US$ Million) by Application, 2024 to 2034
Figure 129: MEA Market Value (US$ Million) by Country, 2024 to 2034
Figure 130: MEA Market Value (US$ Million) Analysis by Country, 2019 to 2034
Figure 131: MEA Market Volume (Tons) Analysis by Country, 2019 to 2034
Figure 132: MEA Market Value Share (%) and BPS Analysis by Country, 2024 to 2034
Figure 133: MEA Market Y-o-Y Growth (%) Projections by Country, 2024 to 2034
Figure 134: MEA Market Value (US$ Million) Analysis by Type, 2019 to 2034
Figure 135: MEA Market Volume (Tons) Analysis by Type, 2019 to 2034
Figure 136: MEA Market Value Share (%) and BPS Analysis by Type, 2024 to 2034
Figure 137: MEA Market Y-o-Y Growth (%) Projections by Type, 2024 to 2034
Figure 138: MEA Market Value (US$ Million) Analysis by Application, 2019 to 2034
Figure 139: MEA Market Volume (Tons) Analysis by Application, 2019 to 2034
Figure 140: MEA Market Value Share (%) and BPS Analysis by Application, 2024 to 2034
Figure 141: MEA Market Y-o-Y Growth (%) Projections by Application, 2024 to 2034
Figure 142: MEA Market Attractiveness by Type, 2024 to 2034
Figure 143: MEA Market Attractiveness by Application, 2024 to 2034
Figure 144: MEA Market Attractiveness by Country, 2024 to 2034
The lithium compound market size is expected to be worth USD 11.8 billion in 2024.
The lithium compound market is estimated to get as big as USD 81.5 billion in 2034.
The CAGR for the United States in the lithium compound market during the 2024 to 2034 period is estimated to be 21.7%.
The lithium compound market can be divided into the following segments: type and application.
The lithium compound market is expected to grow at a CAGR of 21.3% from 2024 to 2034.
Explore Similar Insights
Thank you!
You will receive an email from our Business Development Manager. Please be sure to check your SPAM/JUNK folder too.