Lithium and Lithium Ion Battery Electrolyte Market Size and Share Forecast Outlook 2025 to 2035

The lithium and lithium ion battery electrolyte market is projected to expand significantly from USD 5.8 billion in 2025 to USD 18.3 billion by 2035, advancing at a robust CAGR of 12.2%. This growth is driven by increasing electric vehicle adoption, rising consumer electronics demand, and expanding energy storage applications. The market demonstrates a strong upward trajectory, supported by technological innovations in electrolyte formulations, stringent regulatory policies promoting clean energy, and growing investments in battery manufacturing capacities worldwide.

By 2030, the market is forecast to reach USD 10.3 billion, reflecting steady growth in the first half of the period. The absolute dollar growth between 2025 and 2035 is projected at about USD 12.6 billion, indicating rapid and sustained expansion. Growth is expected to accelerate as advancements in solid-state electrolytes, high-purity lithium salts, and sustainable sourcing solutions gain broader market penetration in automotive, consumer electronics, and power sectors.

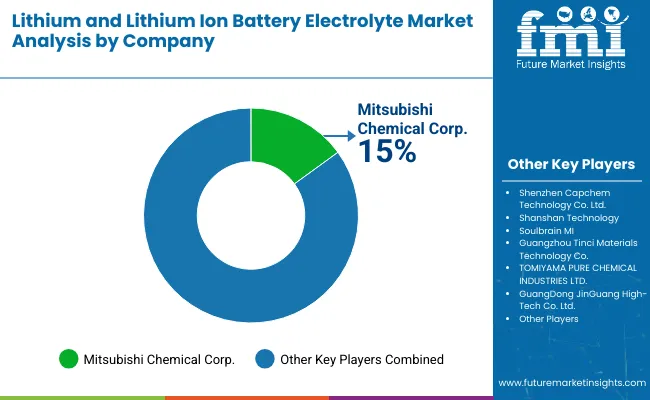
Key companies such as Mitsubishi Chemical Corp., Shenzhen Capchem Technology Co. Ltd., and Shanshan Technology are consolidating their leadership by scaling production capacities, enhancing R&D in next-generation electrolyte technologies, and forming strategic partnerships across the battery value chain. Their innovation pipelines focus on high-performance, safe, and environmentally friendly electrolyte materials, enabling stronger positioning in fast-growing electric vehicle and energy storage markets.
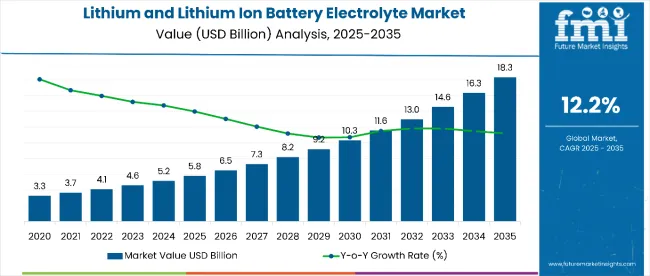
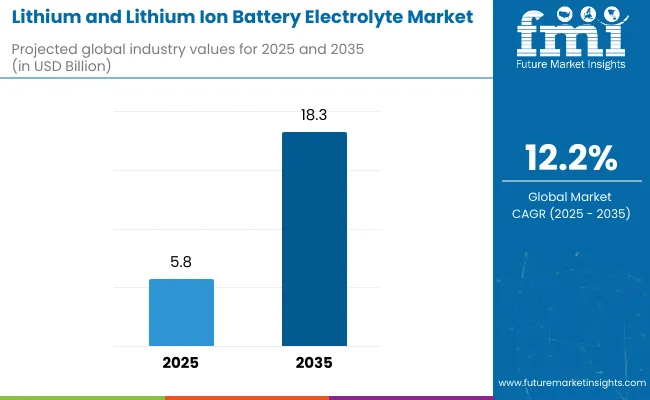
Lithium And Lithium Ion Battery Electrolytes Market Value Analysis

Quick Stats for Lithium and Lithium Ion Battery Electrolyte Market

  • Lithium and Lithium Ion Battery Electrolyte Market Value (2025): USD 5.8 billion
  • Lithium and Lithium Ion Battery Electrolyte Market Forecast Value (2035): USD 18.3 billion
  • Lithium and Lithium Ion Battery Electrolyte Market Forecast CAGR: 12.2%
  • Leading Segment in Lithium and Lithium Ion Battery Electrolyte Market in 2025: Lithium-Based Electrolytes (84%)
  • Key Growth Regions in Lithium and Lithium Ion Battery Electrolyte Market: Asia Pacific and North America
  • Top Players in Lithium and Lithium Ion Battery Electrolyte Market: Mitsubishi Chemical Corp., Shenzhen Capchem Technology Co. Ltd., Shanshan Technology, LG Chem, Panasonic Corporation

Lithium And Lithium Ion Battery Electrolytes Market

Metric Value
Market Value (2025) USD 5.8 billion
Market Forecast Value (2035) USD 18.3 billion
Forecast CAGR 12.2%

The market accounts for 30% of the automotive battery segment, driven by the essential role of lithium-ion batteries in powering electric vehicles worldwide. It accounts for around 10.8% of the consumer electronics battery market, supported by demand for smartphones, laptops, and wearable devices requiring high-performance electrolytes. The market contributes significantly to the stationary energy storage systems sector, which is rapidly expanding with renewable energy adoption. It also holds a notable share in general industrial battery applications, including power tools and backup systems.

The market is evolving with advancements in solid-state and gel electrolyte technologies that enhance safety, energy density, and battery life. Manufacturers are expanding into high-purity, pharmaceutical-grade, and sustainable electrolyte formulations to meet stringent regulatory standards and consumer expectations. Strategic collaborations between electrolyte suppliers, battery manufacturers, and automakers, along with rising investments in battery recycling and sustainable sourcing, are reshaping the supply chain and distribution landscape. These trends are challenging traditional battery chemistries and accelerating the shift toward next-generation energy storage solutions.

Why is Lithium and Lithium Ion Battery Electrolyte Market Growing?

The lithium and lithium ion battery electrolyte market is growing rapidly due to multiple converging factors. Primarily, the global shift toward clean and sustainable energy solutions is accelerating demand for electric vehicles (EVs), which rely heavily on lithium-ion batteries for power. Governments worldwide are enforcing stricter emission regulations and offering incentives to boost EV adoption, driving battery manufacturers to enhance performance, safety, and energy density, thereby necessitating advanced electrolytes.

Technological innovation also plays a significant role, as the development of solid-state and gel electrolytes enables safer, longer-lasting batteries with faster charging capabilities. These advancements address key challenges such as thermal instability and leakage in traditional liquid electrolytes, increasing consumer confidence and widening application scope.

Additionally, growing consumer electronics markets including smartphones, laptops, and wearable devices require high-performance batteries with reliable electrolytes to extend usage time and efficiency. The expanding stationary energy storage sector, vital for renewable energy integration, further fuels electrolyte demand.

Lithium and Lithium Ion Battery Electrolyte Market by Top Investment Segments

The market is segmented by form, product type, end use, and region. By form, the market is divided into liquid, solid, and gel. Based on product type, the market is categorized into lithium-based, sulfide-based, polymer-based, oxide-based, and others (such as hybrid and composite electrolytes). In terms of end use, the market is classified into automotive, consumer electronics, power & energy, and general industrial. Regionally, the market is divided into North America, Latin America, Western Europe, South Asia, East Asia, Eastern Europe, and the Middle East & Africa.
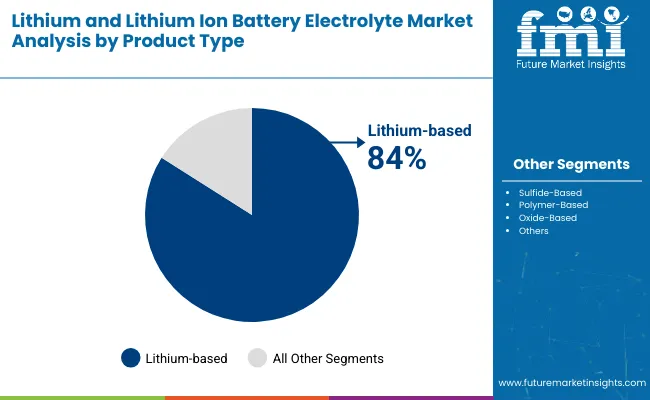
By Product Type, Lithium-based Segment Accounts for 84% Market Share

Lithium And Lithium Ion Battery Electrolytes Market By Product Type

The lithium-based electrolyte segment is the most lucrative and dominant sector within the lithium and lithium ion battery electrolyte market, commanding 84% of the market share in 2025. This segment's prominence stems from lithium’s inherent properties such as high energy density, lightweight nature, and excellent electrochemical stability, making it the preferred choice for electric vehicles (EVs), consumer electronics, and energy storage systems. Lithium-based electrolytes enable batteries to deliver superior performance with longer cycle life and faster charging capabilities, critical requirements in rapidly evolving automotive and electronics industries.

The surge in global electric vehicle adoption, driven by stringent emission regulations and sustainability initiatives, is a key growth engine fueling lithium-based electrolyte demand. Additionally, ongoing research into enhancing safety and reducing costs of lithium electrolytes further strengthens this segment’s market position. Although emerging segments like sulfide, polymer, and oxide-based electrolytes offer promising innovation, they currently hold smaller shares due to developmental and commercialization challenges. The expansive application horizon and ongoing technological advancements assure that lithium-based electrolytes will maintain their lucrative and commanding position from 2025 to 2035.
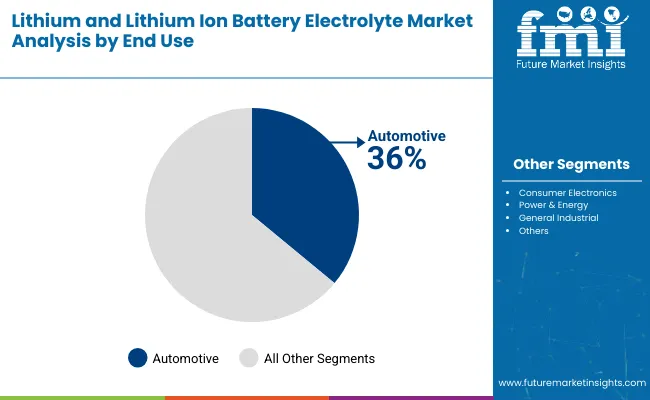
By End Use, Automotive Segment Accounts for 36% Market Share

Lithium And Lithium Ion Battery Electrolytes Market By End Use

The automotive segment is the most lucrative and dominant end-use category in the lithium and lithium ion battery electrolyte market, accounting for 36% of the market share in 2025. This segment's strong growth is driven largely by the accelerating global adoption of electric vehicles (EVs), fueled by stringent emission regulations, government incentives, and increasing consumer preference for clean mobility solutions. Lithium-ion batteries are integral to EV performance, relying heavily on advanced electrolytes that offer higher energy density, improved safety, and extended battery lifespan.

The rise of electric buses, commercial vehicles, and passenger EVs worldwide, especially in markets like China, India, Europe, and North America, further propels demand for automotive-grade electrolytes. In addition, automakers are investing substantially in battery technologies to enhance vehicle range and reduce charging times, directly benefiting the electrolyte market. While consumer electronics and power & energy sectors are significant, the automotive segment's scale, regulatory backing, and continuous innovation make it the most lucrative and impactful market driver for lithium-ion battery electrolytes from 2025 to 2035.

What are the Drivers, Restraints, and Key Trends of the Lithium and Lithium Ion Battery Electrolyte Market?

From 2025 to 2035, escalating adoption of electric vehicles (EVs) and rapid advancements in consumer electronics are driving significant growth in the lithium and lithium ion battery electrolyte market. Increasing focus on clean energy, sustainability, and efficient energy storage systems has positioned manufacturers investing in innovative electrolyte technologies, such as solid-state and gel electrolytes, as key players in meeting evolving performance and safety requirements.

Growing Electric Vehicle Adoption Drives Market Expansion

Rising global environmental regulations and government incentives to reduce carbon emissions act as primary catalysts propelling the lithium ion battery electrolyte market. By 2025, battery manufacturers are expected to enhance electrolyte formulations to improve energy density, charging speeds, and thermal stability, supporting the mainstream adoption of EVs and augmenting demand for high-purity lithium-based electrolytes.

Technological Innovations Enhance Market Opportunities

Recent innovations in electrolyte chemistry including solid-state electrolytes, lithium salts with higher ionic conductivity, and safer non-volatile formulations are broadening applications across automotive, consumer electronics, and stationary energy storage systems. Manufacturers embracing sustainable sourcing, advanced manufacturing processes, and eco-friendly chemistries gain competitive advantage, catering to increasingly stringent regulatory standards and environmentally conscious consumers, thereby reinforcing sustained market growth.
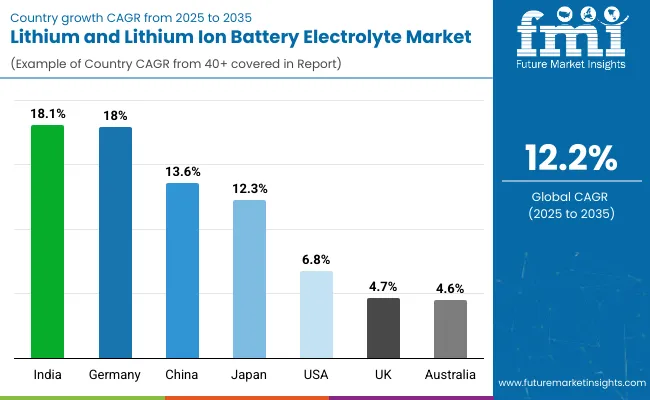
Lithium and Lithium Ion Battery Electrolyte Market Analysis by Key Countries

Lithium And Lithium Ion Battery Electrolytes Market By Country

Country CAGR (%)
India 18.1
Germany 18.0
China 13.6
Japan 12.3
United States 6.8
United Kingdom 4.7
Australia 4.6

In the lithium and lithium-ion battery electrolyte market, India is projected to lead with the highest CAGR of 18.1%, driven by strong government support and expanding EV adoption. Germany follows closely at 18.0%, fueled by its automotive sector and strict EU regulations. China’s growth rate stands at 13.6%, supported by its vast EV market and integrated supply chains. Japan grows at 12.3%, focusing on advanced electrolyte technologies. The USA expands moderately at 6.8%, backed by incentives and domestic production. The UK and Australia have lower CAGRs of 4.7% and 4.6%, respectively, with growth tied to innovation and resource availability.

The report covers an in-depth analysis of 40+ countries; seven top-performing OECD countries are highlighted below.

Output Expansion in Lithium and Lithium Ion Battery Electrolyte Market in India

Demand for lithium and lithium ion battery electrolyte in India is projected to grow at a robust CAGR of 18.1%, reflecting rapid output expansion driven by strong government support including national EV policies and clean energy initiatives. Investments in domestic electrolyte manufacturing facilities are increasing, supported by partnerships with global technology leaders. Rising demand from the automotive and consumer electronics sectors fuels capacity growth. Manufacturers focus on enhancing product quality and sustainability, addressing raw material supply challenges while fostering innovation. The push toward localized production reduces import dependency and strengthens India’s position as a key electrolyte supplier in Asia. Growing R&D efforts also aim to advance solid-state electrolyte technologies, further diversifying India's market offerings.

  • National EV incentives drive battery production growth.
  • Increased investments in local manufacturing infrastructure.
  • Advancements in sustainable and advanced electrolyte formulations.

Production Capacity Trends in Lithium and Lithium Ion Battery Electrolyte Market in China

Revenue from lithium and lithium ion battery electrolyte in China is expected to grow at a CAGR of 13.6%, maintaining its position as the global leader in production capacity expansion. This growth is driven by the world’s largest electric vehicle market and aggressive clean energy policies. Comprehensive supply chain integration and economies of scale enable cost-effective manufacturing and rapid innovation cycles. Leading domestic companies and multinational players invest heavily in R&D to produce high-performance electrolytes, driving China’s dominant market share. The government’s commitment to renewable energy adoption fosters stationary energy storage growth, expanding electrolyte demand further. Solid-state electrolyte pilot programs signify China’s technological advancement in next-gen battery chemistry.

  • Largest EV market fueling electrolyte production scale-up.
  • Integrated supply chains and manufacturing clusters boost efficiency.
  • Government-driven renewable energy and battery recycling programs.

Structural Adoption and Capacity Expansion in Lithium and Lithium Ion Battery Electrolyte Market in Germany

Demand for lithium-ion battery electrolyte in Germany is poised for growth at a CAGR of 18.0%, underscored by structural adoption of advanced battery technologies and expanding production capacities. As Europe’s automotive hub, Germany leads the shift toward cleaner and high-energy-density batteries, necessitating superior electrolyte materials. Investments in sustainable manufacturing and recycling align with stringent EU regulations. German electrolyte producers prioritize product safety, quality certifications, and green formulations. The country’s robust R&D ecosystem partners with automotive manufacturers to innovate solid and polymer electrolytes, positioning Germany as a critical supplier in the European battery supply chain.

  • Europe’s automotive leadership drives high-performance electrolyte demand.
  • Strong regulatory push for sustainable battery materials production.
  • Increased capacity investments in green manufacturing facilities.

Technological Advancements and Capacity Scaling in Lithium and Lithium Ion Battery Electrolyte Market in Japan

Revenue from lithium and lithium ion battery electrolyte in Japan continues to emphasize technology-driven electrolyte market growth with a forecast CAGR of 12.3%, focusing on breakthroughs in solid-state and polymer electrolyte development. Its battery industry prioritizes safety, performance, and longevity, fostering demand for sophisticated electrolyte solutions. Expansion of production capacity is accompanied by rigorous quality controls and sustainability policies. Japanese companies lead in integrating electrolytes into next-generation batteries used in automotive and electronics sectors. Strategic collaborations aim to accelerate commercialization of advanced electrolytes, maintaining Japan’s reputation for precision manufacturing and innovation.

  • Leadership in solid-state and polymer electrolyte technologies.
  • Expansion of high-purity electrolyte production capacities.
  • Initiatives promoting sustainable and recyclable electrolyte materials.

Scaling Production and Innovation in Lithium and Lithium Ion Battery Electrolyte Market in United States

Sales of lithium and lithium ion battery electrolyte in the USA are forecasted to grow at a CAGR of 6.8%, showcasing steady scaling of production capacity motivated by growing electric vehicle sales and energy storage projects. Federal and state incentives support clean transportation and renewable integration, directly benefiting electrolyte manufacturers. Emphasis on advanced electrolyte formulations addressing safety and thermal stability is prominent. The market also benefits from a strong innovation ecosystem and partnerships between startups and established players. Increasing investments in domestic battery supply chains aim to reduce reliance on imports, supporting long-term market resiliency.

  • Federal and state policies accelerating EV adoption.
  • Collaborations between startups and large manufacturers.
  • Growing investments in battery supply chain localization.

Emerging Innovation and Expansion in Lithium and Lithium Ion Battery Electrolyte Market in United Kingdom

Demand for lithium and lithium-ion battery electrolyte in the UK is expected to grow at a CAGR of 4.7%, driven by innovation and gradual capacity expansion. Government initiatives promoting green energy and clean transportation incentivize electrolyte development. The UK hosts several startups pioneering solid and gel electrolyte technologies, accelerating commercialization. Renewable energy storage projects further support market demand. Focus on environmental compliance and sustainability drives innovation in eco-friendly electrolyte formulations, positioning the UK as a growing hub for advanced electrolyte materials.

  • Green energy policies fostering electrolyte market growth.
  • Startups driving innovation in solid and gel electrolytes.
  • Supportive government funding and regulatory frameworks.

Resource-Linked Capacity Growth in Lithium and Lithium Ion Battery Electrolyte Market in Australia

Revenue from lithium and lithium-ion battery electrolyte growth is closely linked to its rich lithium mineral resources, underpinning raw material security. The market is projected to grow at a CAGR of 4.6%, supported by investments in local processing and manufacturing of lithium salts and electrolytes to expand capacity. The country focuses on environmentally responsible mining and sustainable supply chains. Domestic EV adoption and renewable energy initiatives supplement market demand. Collaborations between mining companies and electrolyte producers enhance industry integration and promote advanced electrolyte technologies.
  • Abundant lithium reserves securing raw material supply.
  • Increasing domestic EV market and renewable energy projects.
  • Strategic partnerships between miners and battery material producers.

Competitive Landscape of the Lithium and Lithium Ion Battery Electrolyte Market

Lithium And Lithium Ion Battery Electrolytes Market By Company

The market is characterized by several well-established global and regional players, whose strategies focus on innovation, capacity expansion, and strategic partnerships. Leading companies such as Mitsubishi Chemical Corp., Shenzhen Capchem Technology Co. Ltd., Shanshan Technology, LG Chem, and Panasonic Corporation dominate the market due to their extensive product portfolios, advanced R&D capabilities, and strong manufacturing infrastructure.

Market leaders continuously invest in developing next-generation electrolyte technologies, including solid-state and gel electrolytes, to address safety, energy density, and charging speed challenges. Strategic collaborations with automotive OEMs, battery manufacturers, and research institutions allow these players to accelerate product innovation and commercialize cutting-edge electrolyte solutions tailored for electric vehicles, consumer electronics, and energy storage systems.

Capacity expansions, especially in Asia-Pacific regions like China, India, and Japan, bolster the supply chain’s robustness to meet surging demand. Additionally, companies are focusing on sustainable and environmentally friendly electrolyte production processes to comply with stringent regulations and cater to eco-conscious consumers.

Report Scope - Lithium and Lithium Ion Battery Electrolyte Market

Items Values
Quantitative Units (2025) USD 5.8 Billion
Form Liquid, Solid, Gel
Product Type Lithium-Based, Sulfide -Based, Polymer-Based, Oxide-Based, and Others ( such as hybrid and composite electrolytes)
End Use Automotive, Consumer Electronics, Power & Energy, General Industrial
Regions Covered North America, Europe, Asia-Pacific, Latin America, Middle East & Africa
Countries Covered United States, Canada, Germany, France, United Kingdom, China, Japan, India, Brazil, South Africa, and 40+ countries
Key Companies Profiled Mitsubishi Chemical Corp., Shenzhen Capchem Technology Co Ltd, Shanshan Technology, Soulbrain MI, Guangzhou Tinci Materials Technology Co., TOMIYAMA PURE CHEMICAL INDUSTRIES, LTD., GuangDong JinGuang High-Tech Co., Ltd, Panax Etec Co Ltd, UBE Industries, Zhangjiagang Guotai-Huarong New Chemical Materials Co., Ltd., and NEI Corporation
Additional Attributes Market segmentation by product type and end use, rising demand from EV adoption and energy storage, innovations in solid-state and gel electrolytes, strategic partnerships, regulatory focus on recycling, and improved energy density and charging

Key Segmentation

By Product Type:

Based on product type, the industry is segmented into lithium-based, sulfide-based, polymer-based, oxide-based, and others.

By Form:

Based on form, the industry is divided into liquid, solid, and gel.

By End-use:

Based on end-use, the industry is segregated into automotive, consumer electronics, power and energy, and general industrial.

By Region:

The sector has been analyzed with the following regions covered: North America, Latin America, Europe, South Asia, East Asia, Oceania, and the Middle East and Africa.

Table of Content

  1. Executive Summary
    • Global Market Outlook
    • Demand-side Trends
    • Supply-side Trends
    • Technology Roadmap Analysis
    • Analysis and Recommendations
  2. Market Overview
    • Market Coverage / Taxonomy
    • Market Definition / Scope / Limitations
  3. Market Background
    • Market Dynamics
      • Drivers
      • Restraints
      • Opportunity
      • Trends
    • Scenario Forecast
      • Demand in Optimistic Scenario
      • Demand in Likely Scenario
      • Demand in Conservative Scenario
    • Opportunity Map Analysis
    • Product Life Cycle Analysis
    • Supply Chain Analysis
      • Supply Side Participants and their Roles
        • Producers
        • Mid-Level Participants (Traders/ Agents/ Brokers)
        • Wholesalers and Distributors
      • Value Added and Value Created at Node in the Supply Chain
      • List of Raw Material Suppliers
      • List of Existing and Potential Buyer’s
    • Investment Feasibility Matrix
    • Value Chain Analysis
      • Profit Margin Analysis
      • Wholesalers and Distributors
      • Retailers
    • PESTLE and Porter’s Analysis
    • Regulatory Landscape
      • By Key Regions
      • By Key Countries
    • Regional Parent Market Outlook
    • Production and Consumption Statistics
    • Import and Export Statistics
  4. Global Market Analysis 2020 to 2024 and Forecast, 2025 to 2035
    • Historical Market Size Value (USD Billion) & Volume (Metric Tons) Analysis, 2020 to 2024
    • Current and Future Market Size Value (USD Billion) & Volume (Metric Tons) Projections, 2025 to 2035
      • Y-o-Y Growth Trend Analysis
      • Absolute $ Opportunity Analysis
  5. Global Market Pricing Analysis 2020 to 2024 and Forecast 2025 to 2035
  6. Global Market Analysis 2020 to 2024 and Forecast 2025 to 2035, By Form
    • Introduction / Key Findings
    • Historical Market Size Value (USD Billion) & Volume (Metric Tons) Analysis By Form, 2020 to 2024
    • Current and Future Market Size Value (USD Billion) & Volume (Metric Tons) Analysis and Forecast By Form, 2025 to 2035
      • Liquid
      • Solid
      • Gel
    • Y-o-Y Growth Trend Analysis By Form, 2020 to 2024
    • Absolute $ Opportunity Analysis By Form, 2025 to 2035
  7. Global Market Analysis 2020 to 2024 and Forecast 2025 to 2035, By Product Type
    • Introduction / Key Findings
    • Historical Market Size Value (USD Billion) & Volume (Metric Tons) Analysis By Product Type, 2020 to 2024
    • Current and Future Market Size Value (USD Billion) & Volume (Metric Tons) Analysis and Forecast By Product Type, 2025 to 2035
      • Lithium-based
      • Sulfide-based
      • Polymer-based
      • Oxide-based
      • Others (such as hybrid and composite electrolytes)
    • Y-o-Y Growth Trend Analysis By Product Type, 2020 to 2024
    • Absolute $ Opportunity Analysis By Product Type, 2025 to 2035
  8. Global Market Analysis 2020 to 2024 and Forecast 2025 to 2035, By End Use
    • Introduction / Key Findings
    • Historical Market Size Value (USD Billion) & Volume (Metric Tons) Analysis By End Use, 2020 to 2024
    • Current and Future Market Size Value (USD Billion) & Volume (Metric Tons) Analysis and Forecast By End Use, 2025 to 2035
      • Automotive
      • Consumer Electronics
      • Power & Energy
      • General Industrial
    • Y-o-Y Growth Trend Analysis By End Use, 2020 to 2024
    • Absolute $ Opportunity Analysis By End Use, 2025 to 2035
  9. Global Market Analysis 2020 to 2024 and Forecast 2025 to 2035, By Region
    • Introduction
    • Historical Market Size Value (USD Billion) & Volume (Metric Tons) Analysis By Region, 2020 to 2024
    • Current Market Size Value (USD Billion) & Volume (Metric Tons) Analysis and Forecast By Region, 2025 to 2035
      • North America
      • Latin America
      • Western Europe
      • Eastern Europe
      • East Asia
      • South Asia & Pacific
      • Middle East and Africa
    • Market Attractiveness Analysis By Region
  10. North America Market Analysis 2020 to 2024 and Forecast 2025 to 2035, By Country
    • Historical Market Size Value (USD Billion) & Volume (Metric Tons) Trend Analysis By Market Taxonomy, 2020 to 2024
    • Market Size Value (USD Billion) & Volume (Metric Tons) Forecast By Market Taxonomy, 2025 to 2035
      • By Country
        • USA
        • Canada
        • Mexico
      • By Form
      • By Product Type
      • By End Use
    • Market Attractiveness Analysis
      • By Country
      • By Form
      • By Product Type
      • By End Use
    • Key Takeaways
  11. Latin America Market Analysis 2020 to 2024 and Forecast 2025 to 2035, By Country
    • Historical Market Size Value (USD Billion) & Volume (Metric Tons) Trend Analysis By Market Taxonomy, 2020 to 2024
    • Market Size Value (USD Billion) & Volume (Metric Tons) Forecast By Market Taxonomy, 2025 to 2035
      • By Country
        • Brazil
        • Argentina
        • Rest of LATAM
      • By Form
      • By Product Type
      • By End Use
    • Market Attractiveness Analysis
      • By Country
      • By Form
      • By Product Type
      • By End Use
    • Key Takeaways
  12. Western Europe Market Analysis 2020 to 2024 and Forecast 2025 to 2035, By Country
    • Historical Market Size Value (USD Billion) & Volume (Metric Tons) Trend Analysis By Market Taxonomy, 2020 to 2024
    • Market Size Value (USD Billion) & Volume (Metric Tons) Forecast By Market Taxonomy, 2025 to 2035
      • By Country
        • Germany
        • Italy
        • France
        • UK
        • Spain
        • BENELUX
        • Nordic
        • Rest of W.Europe
      • By Form
      • By Product Type
      • By End Use
    • Market Attractiveness Analysis
      • By Country
      • By Form
      • By Product Type
      • By End Use
    • Key Takeaways
  13. Eastern Europe Market Analysis 2020 to 2024 and Forecast 2025 to 2035, By Country
    • Historical Market Size Value (USD Billion) & Volume (Metric Tons) Trend Analysis By Market Taxonomy, 2020 to 2024
    • Market Size Value (USD Billion) & Volume (Metric Tons) Forecast By Market Taxonomy, 2025 to 2035
      • By Country
        • Russia
        • Hungary
        • Poland
        • Balkan & Baltics
        • Rest of E. Europe
      • By Form
      • By Product Type
      • By End Use
    • Market Attractiveness Analysis
      • By Country
      • By Form
      • By Product Type
      • By End Use
    • Key Takeaways
  14. East Asia Market Analysis 2020 to 2024 and Forecast 2025 to 2035, By Country
    • Historical Market Size Value (USD Billion) & Volume (Metric Tons) Trend Analysis By Market Taxonomy, 2020 to 2024
    • Market Size Value (USD Billion) & Volume (Metric Tons) Forecast By Market Taxonomy, 2025 to 2035
      • By Country
        • China
        • Japan
        • South Korea
      • By Form
      • By Product Type
      • By End Use
    • Market Attractiveness Analysis
      • By Country
      • By Form
      • By Product Type
      • By End Use
    • Key Takeaways
  15. South Asia & Pacific Market Analysis 2020 to 2024 and Forecast 2025 to 2035, By Country
    • Historical Market Size Value (USD Billion) & Volume (Metric Tons) Trend Analysis By Market Taxonomy, 2020 to 2024
    • Market Size Value (USD Billion) & Volume (Metric Tons) Forecast By Market Taxonomy, 2025 to 2035
      • By Country
        • India
        • Australia & New Zealand
        • ASEAN
        • Rest of SAP
      • By Form
      • By Product Type
      • By End Use
    • Market Attractiveness Analysis
      • By Country
      • By Form
      • By Product Type
      • By End Use
    • Key Takeaways
  16. Middle East and Africa Market Analysis 2020 to 2024 and Forecast 2025 to 2035, By Country
    • Historical Market Size Value (USD Billion) & Volume (Metric Tons) Trend Analysis By Market Taxonomy, 2020 to 2024
    • Market Size Value (USD Billion) & Volume (Metric Tons) Forecast By Market Taxonomy, 2025 to 2035
      • By Country
        • GCC Countries
        • Northern Africa
        • South Africa
        • Turkiye
        • Rest of MEA
      • By Form
      • By Product Type
      • By End Use
    • Market Attractiveness Analysis
      • By Country
      • By Form
      • By Product Type
      • By End Use
    • Key Takeaways
  17. Key Countries Market Analysis
    • USA
      • Pricing Analysis
      • Market Share Analysis, 2024
        • By Form
        • By Product Type
        • By End Use
    • Canada
      • Pricing Analysis
      • Market Share Analysis, 2024
        • By Form
        • By Product Type
        • By End Use
    • Brazil
      • Pricing Analysis
      • Market Share Analysis, 2024
        • By Form
        • By Product Type
        • By End Use
    • Mexico
      • Pricing Analysis
      • Market Share Analysis, 2024
        • By Form
        • By Product Type
        • By End Use
    • Argentina
      • Pricing Analysis
      • Market Share Analysis, 2024
        • By Form
        • By Product Type
        • By End Use
  18. Market Structure Analysis
    • Competition Dashboard
    • Competition Benchmarking
    • Market Share Analysis of Top Players
      • By Regional
      • By Form
      • By Product Type
      • By End Use
  19. Competition Analysis
    • Competition Deep Dive
      • Mitsubishi Chemical Corp.
        • Overview
        • Product Portfolio
        • Profitability by Market Segments (Product/Age /Sales Channel/Region)
        • Sales Footprint
        • Strategy Overview
          • Marketing Strategy
          • Product Strategy
          • Channel Strategy
      • Shenzhen Capchem Technology Co Ltd
        • Overview
        • Product Portfolio
        • Profitability by Market Segments (Product/Age /Sales Channel/Region)
        • Sales Footprint
        • Strategy Overview
          • Marketing Strategy
          • Product Strategy
          • Channel Strategy
      • Soulbrain MI
        • Overview
        • Product Portfolio
        • Profitability by Market Segments (Product/Age /Sales Channel/Region)
        • Sales Footprint
        • Strategy Overview
          • Marketing Strategy
          • Product Strategy
          • Channel Strategy
      • Guangzhou Tinci Materials Technology Co.
        • Overview
        • Product Portfolio
        • Profitability by Market Segments (Product/Age /Sales Channel/Region)
        • Sales Footprint
        • Strategy Overview
          • Marketing Strategy
          • Product Strategy
          • Channel Strategy
      • TOMIYAMA PURE CHEMICAL INDUSTRIES, LTD.
        • Overview
        • Product Portfolio
        • Profitability by Market Segments (Product/Age /Sales Channel/Region)
        • Sales Footprint
        • Strategy Overview
          • Marketing Strategy
          • Product Strategy
          • Channel Strategy
      • GuangDong JinGuang High-Tech Co., Ltd
        • Overview
        • Product Portfolio
        • Profitability by Market Segments (Product/Age /Sales Channel/Region)
        • Sales Footprint
        • Strategy Overview
          • Marketing Strategy
          • Product Strategy
          • Channel Strategy
      • Panax Etec Co Ltd
        • Overview
        • Product Portfolio
        • Profitability by Market Segments (Product/Age /Sales Channel/Region)
        • Sales Footprint
        • Strategy Overview
          • Marketing Strategy
          • Product Strategy
          • Channel Strategy
      • UBE Industries
        • Overview
        • Product Portfolio
        • Profitability by Market Segments (Product/Age /Sales Channel/Region)
        • Sales Footprint
        • Strategy Overview
          • Marketing Strategy
          • Product Strategy
          • Channel Strategy
      • Zhangjiagang Guotai-Huarong New Chemical Materials Co., Ltd.
        • Overview
        • Product Portfolio
        • Profitability by Market Segments (Product/Age /Sales Channel/Region)
        • Sales Footprint
        • Strategy Overview
          • Marketing Strategy
          • Product Strategy
          • Channel Strategy
      • NEI Corporation
        • Overview
        • Product Portfolio
        • Profitability by Market Segments (Product/Age /Sales Channel/Region)
        • Sales Footprint
        • Strategy Overview
          • Marketing Strategy
          • Product Strategy
          • Channel Strategy
  20. Assumptions & Acronyms Used
  21. Research Methodology

List of Tables

  • Table 1: Global Market Value (USD Billion) Forecast by Region, 2020-2035
  • Table 2: Global Market Volume (Metric Tons) Forecast by Region, 2020-2035
  • Table 3: Global Market Value (USD Billion) Forecast by Form, 2020-2035
  • Table 4: Global Market Volume (Metric Tons) Forecast by Form, 2020-2035
  • Table 5: Global Market Value (USD Billion) Forecast by Product Type, 2020-2035
  • Table 6: Global Market Volume (Metric Tons) Forecast by Product Type, 2020-2035
  • Table 7: Global Market Value (USD Billion) Forecast by End Use, 2020-2035
  • Table 8: Global Market Volume (Metric Tons) Forecast by End Use, 2020-2035
  • Table 9: North America Market Value (USD Billion) Forecast by Country, 2020-2035
  • Table 10: North America Market Volume (Metric Tons) Forecast by Country, 2020-2035
  • Table 11: North America Market Value (USD Billion) Forecast by Form, 2020-2035
  • Table 12: North America Market Volume (Metric Tons) Forecast by Form, 2020-2035
  • Table 13: North America Market Value (USD Billion) Forecast by Product Type, 2020-2035
  • Table 14: North America Market Volume (Metric Tons) Forecast by Product Type, 2020-2035
  • Table 15: North America Market Value (USD Billion) Forecast by End Use, 2020-2035
  • Table 16: North America Market Volume (Metric Tons) Forecast by End Use, 2020-2035
  • Table 17: Latin America Market Value (USD Billion) Forecast by Country, 2020-2035
  • Table 18: Latin America Market Volume (Metric Tons) Forecast by Country, 2020-2035
  • Table 19: Latin America Market Value (USD Billion) Forecast by Form, 2020-2035
  • Table 20: Latin America Market Volume (Metric Tons) Forecast by Form, 2020-2035
  • Table 21: Latin America Market Value (USD Billion) Forecast by Product Type, 2020-2035
  • Table 22: Latin America Market Volume (Metric Tons) Forecast by Product Type, 2020-2035
  • Table 23: Latin America Market Value (USD Billion) Forecast by End Use, 2020-2035
  • Table 24: Latin America Market Volume (Metric Tons) Forecast by End Use, 2020-2035
  • Table 25: Western Europe Market Value (USD Billion) Forecast by Country, 2020-2035
  • Table 26: Western Europe Market Volume (Metric Tons) Forecast by Country, 2020-2035
  • Table 27: Western Europe Market Value (USD Billion) Forecast by Form, 2020-2035
  • Table 28: Western Europe Market Volume (Metric Tons) Forecast by Form, 2020-2035
  • Table 29: Western Europe Market Value (USD Billion) Forecast by Product Type, 2020-2035
  • Table 30: Western Europe Market Volume (Metric Tons) Forecast by Product Type, 2020-2035
  • Table 31: Western Europe Market Value (USD Billion) Forecast by End Use, 2020-2035
  • Table 32: Western Europe Market Volume (Metric Tons) Forecast by End Use, 2020-2035
  • Table 33: Eastern Europe Market Value (USD Billion) Forecast by Country, 2020-2035
  • Table 34: Eastern Europe Market Volume (Metric Tons) Forecast by Country, 2020-2035
  • Table 35: Eastern Europe Market Value (USD Billion) Forecast by Form, 2020-2035
  • Table 36: Eastern Europe Market Volume (Metric Tons) Forecast by Form, 2020-2035
  • Table 37: Eastern Europe Market Value (USD Billion) Forecast by Product Type, 2020-2035
  • Table 38: Eastern Europe Market Volume (Metric Tons) Forecast by Product Type, 2020-2035
  • Table 39: Eastern Europe Market Value (USD Billion) Forecast by End Use, 2020-2035
  • Table 40: Eastern Europe Market Volume (Metric Tons) Forecast by End Use, 2020-2035
  • Table 41: East Asia Market Value (USD Billion) Forecast by Country, 2020-2035
  • Table 42: East Asia Market Volume (Metric Tons) Forecast by Country, 2020-2035
  • Table 43: East Asia Market Value (USD Billion) Forecast by Form, 2020-2035
  • Table 44: East Asia Market Volume (Metric Tons) Forecast by Form, 2020-2035
  • Table 45: East Asia Market Value (USD Billion) Forecast by Product Type, 2020-2035
  • Table 46: East Asia Market Volume (Metric Tons) Forecast by Product Type, 2020-2035
  • Table 47: East Asia Market Value (USD Billion) Forecast by End Use, 2020-2035
  • Table 48: East Asia Market Volume (Metric Tons) Forecast by End Use, 2020-2035
  • Table 49: South Asia & Pacific Market Value (USD Billion) Forecast by Country, 2020-2035
  • Table 50: South Asia & Pacific Market Volume (Metric Tons) Forecast by Country, 2020-2035
  • Table 51: South Asia & Pacific Market Value (USD Billion) Forecast by Form, 2020-2035
  • Table 52: South Asia & Pacific Market Volume (Metric Tons) Forecast by Form, 2020-2035
  • Table 53: South Asia & Pacific Market Value (USD Billion) Forecast by Product Type, 2020-2035
  • Table 54: South Asia & Pacific Market Volume (Metric Tons) Forecast by Product Type, 2020-2035
  • Table 55: South Asia & Pacific Market Value (USD Billion) Forecast by End Use, 2020-2035
  • Table 56: South Asia & Pacific Market Volume (Metric Tons) Forecast by End Use, 2020-2035
  • Table 57: Middle East and Africa Market Value (USD Billion) Forecast by Country, 2020-2035
  • Table 58: Middle East and Africa Market Volume (Metric Tons) Forecast by Country, 2020-2035
  • Table 59: Middle East and Africa Market Value (USD Billion) Forecast by Form, 2020-2035
  • Table 60: Middle East and Africa Market Volume (Metric Tons) Forecast by Form, 2020-2035
  • Table 61: Middle East and Africa Market Value (USD Billion) Forecast by Product Type, 2020-2035
  • Table 62: Middle East and Africa Market Volume (Metric Tons) Forecast by Product Type, 2020-2035
  • Table 63: Middle East and Africa Market Value (USD Billion) Forecast by End Use, 2020-2035
  • Table 64: Middle East and Africa Market Volume (Metric Tons) Forecast by End Use, 2020-2035

List of Figures

  • Figure 1: Global Market Volume (Metric Tons) Forecast 2020-2035
  • Figure 2: Global Market Pricing Analysis
  • Figure 3: Global Market Value (USD Billion) Forecast 2020-2035
  • Figure 4: Global Market Value Share and BPS Analysis by Form, 2025 and 2035
  • Figure 5: Global Market Y-o-Y Growth Comparison by Form, 2025-2035
  • Figure 6: Global Market Attractiveness Analysis by Form
  • Figure 7: Global Market Value Share and BPS Analysis by Product Type, 2025 and 2035
  • Figure 8: Global Market Y-o-Y Growth Comparison by Product Type, 2025-2035
  • Figure 9: Global Market Attractiveness Analysis by Product Type
  • Figure 10: Global Market Value Share and BPS Analysis by End Use, 2025 and 2035
  • Figure 11: Global Market Y-o-Y Growth Comparison by End Use, 2025-2035
  • Figure 12: Global Market Attractiveness Analysis by End Use
  • Figure 13: Global Market Value (USD Billion) Share and BPS Analysis by Region, 2025 and 2035
  • Figure 14: Global Market Y-o-Y Growth Comparison by Region, 2025-2035
  • Figure 15: Global Market Attractiveness Analysis by Region
  • Figure 16: North America Market Incremental $ Opportunity, 2025-2035
  • Figure 17: Latin America Market Incremental $ Opportunity, 2025-2035
  • Figure 18: Western Europe Market Incremental $ Opportunity, 2025-2035
  • Figure 19: Eastern Europe Market Incremental $ Opportunity, 2025-2035
  • Figure 20: East Asia Market Incremental $ Opportunity, 2025-2035
  • Figure 21: South Asia & Pacific Market Incremental $ Opportunity, 2025-2035
  • Figure 22: Middle East and Africa Market Incremental $ Opportunity, 2025-2035
  • Figure 23: North America Market Value Share and BPS Analysis by Country, 2025 and 2035
  • Figure 24: North America Market Value Share and BPS Analysis by Form, 2025 and 2035
  • Figure 25: North America Market Y-o-Y Growth Comparison by Form, 2025-2035
  • Figure 26: North America Market Attractiveness Analysis by Form
  • Figure 27: North America Market Value Share and BPS Analysis by Product Type, 2025 and 2035
  • Figure 28: North America Market Y-o-Y Growth Comparison by Product Type, 2025-2035
  • Figure 29: North America Market Attractiveness Analysis by Product Type
  • Figure 30: North America Market Value Share and BPS Analysis by End Use, 2025 and 2035
  • Figure 31: North America Market Y-o-Y Growth Comparison by End Use, 2025-2035
  • Figure 32: North America Market Attractiveness Analysis by End Use
  • Figure 33: Latin America Market Value Share and BPS Analysis by Country, 2025 and 2035
  • Figure 34: Latin America Market Value Share and BPS Analysis by Form, 2025 and 2035
  • Figure 35: Latin America Market Y-o-Y Growth Comparison by Form, 2025-2035
  • Figure 36: Latin America Market Attractiveness Analysis by Form
  • Figure 37: Latin America Market Value Share and BPS Analysis by Product Type, 2025 and 2035
  • Figure 38: Latin America Market Y-o-Y Growth Comparison by Product Type, 2025-2035
  • Figure 39: Latin America Market Attractiveness Analysis by Product Type
  • Figure 40: Latin America Market Value Share and BPS Analysis by End Use, 2025 and 2035
  • Figure 41: Latin America Market Y-o-Y Growth Comparison by End Use, 2025-2035
  • Figure 42: Latin America Market Attractiveness Analysis by End Use
  • Figure 43: Western Europe Market Value Share and BPS Analysis by Country, 2025 and 2035
  • Figure 44: Western Europe Market Value Share and BPS Analysis by Form, 2025 and 2035
  • Figure 45: Western Europe Market Y-o-Y Growth Comparison by Form, 2025-2035
  • Figure 46: Western Europe Market Attractiveness Analysis by Form
  • Figure 47: Western Europe Market Value Share and BPS Analysis by Product Type, 2025 and 2035
  • Figure 48: Western Europe Market Y-o-Y Growth Comparison by Product Type, 2025-2035
  • Figure 49: Western Europe Market Attractiveness Analysis by Product Type
  • Figure 50: Western Europe Market Value Share and BPS Analysis by End Use, 2025 and 2035
  • Figure 51: Western Europe Market Y-o-Y Growth Comparison by End Use, 2025-2035
  • Figure 52: Western Europe Market Attractiveness Analysis by End Use
  • Figure 53: Eastern Europe Market Value Share and BPS Analysis by Country, 2025 and 2035
  • Figure 54: Eastern Europe Market Value Share and BPS Analysis by Form, 2025 and 2035
  • Figure 55: Eastern Europe Market Y-o-Y Growth Comparison by Form, 2025-2035
  • Figure 56: Eastern Europe Market Attractiveness Analysis by Form
  • Figure 57: Eastern Europe Market Value Share and BPS Analysis by Product Type, 2025 and 2035
  • Figure 58: Eastern Europe Market Y-o-Y Growth Comparison by Product Type, 2025-2035
  • Figure 59: Eastern Europe Market Attractiveness Analysis by Product Type
  • Figure 60: Eastern Europe Market Value Share and BPS Analysis by End Use, 2025 and 2035
  • Figure 61: Eastern Europe Market Y-o-Y Growth Comparison by End Use, 2025-2035
  • Figure 62: Eastern Europe Market Attractiveness Analysis by End Use
  • Figure 63: East Asia Market Value Share and BPS Analysis by Country, 2025 and 2035
  • Figure 64: East Asia Market Value Share and BPS Analysis by Form, 2025 and 2035
  • Figure 65: East Asia Market Y-o-Y Growth Comparison by Form, 2025-2035
  • Figure 66: East Asia Market Attractiveness Analysis by Form
  • Figure 67: East Asia Market Value Share and BPS Analysis by Product Type, 2025 and 2035
  • Figure 68: East Asia Market Y-o-Y Growth Comparison by Product Type, 2025-2035
  • Figure 69: East Asia Market Attractiveness Analysis by Product Type
  • Figure 70: East Asia Market Value Share and BPS Analysis by End Use, 2025 and 2035
  • Figure 71: East Asia Market Y-o-Y Growth Comparison by End Use, 2025-2035
  • Figure 72: East Asia Market Attractiveness Analysis by End Use
  • Figure 73: South Asia & Pacific Market Value Share and BPS Analysis by Country, 2025 and 2035
  • Figure 74: South Asia & Pacific Market Value Share and BPS Analysis by Form, 2025 and 2035
  • Figure 75: South Asia & Pacific Market Y-o-Y Growth Comparison by Form, 2025-2035
  • Figure 76: South Asia & Pacific Market Attractiveness Analysis by Form
  • Figure 77: South Asia & Pacific Market Value Share and BPS Analysis by Product Type, 2025 and 2035
  • Figure 78: South Asia & Pacific Market Y-o-Y Growth Comparison by Product Type, 2025-2035
  • Figure 79: South Asia & Pacific Market Attractiveness Analysis by Product Type
  • Figure 80: South Asia & Pacific Market Value Share and BPS Analysis by End Use, 2025 and 2035
  • Figure 81: South Asia & Pacific Market Y-o-Y Growth Comparison by End Use, 2025-2035
  • Figure 82: South Asia & Pacific Market Attractiveness Analysis by End Use
  • Figure 83: Middle East and Africa Market Value Share and BPS Analysis by Country, 2025 and 2035
  • Figure 84: Middle East and Africa Market Value Share and BPS Analysis by Form, 2025 and 2035
  • Figure 85: Middle East and Africa Market Y-o-Y Growth Comparison by Form, 2025-2035
  • Figure 86: Middle East and Africa Market Attractiveness Analysis by Form
  • Figure 87: Middle East and Africa Market Value Share and BPS Analysis by Product Type, 2025 and 2035
  • Figure 88: Middle East and Africa Market Y-o-Y Growth Comparison by Product Type, 2025-2035
  • Figure 89: Middle East and Africa Market Attractiveness Analysis by Product Type
  • Figure 90: Middle East and Africa Market Value Share and BPS Analysis by End Use, 2025 and 2035
  • Figure 91: Middle East and Africa Market Y-o-Y Growth Comparison by End Use, 2025-2035
  • Figure 92: Middle East and Africa Market Attractiveness Analysis by End Use
  • Figure 93: Global Market - Tier Structure Analysis
  • Figure 94: Global Market - Company Share Analysis

Frequently Asked Questions

How big is the lithium and lithium ion battery electrolyte market in 2025?

The global lithium and lithium ion battery electrolyte market is estimated to be valued at USD 5.8 billion in 2025.

What will be the size of lithium and lithium ion battery electrolyte market in 2035?

The market size for lithium and lithium ion battery electrolyte is projected to reach USD 18.3 billion by 2035.

How much will be the lithium and lithium ion battery electrolyte market growth between 2025 and 2035?

The lithium and lithium ion battery electrolyte market is expected to grow at a 12.2% CAGR between 2025 and 2035.

Which product type is projected to lead in the lithium and lithium ion battery electrolyte market in 2025?

The lithium-based segment is projected to lead in the lithium and lithium ion battery electrolyte market with 84% market share in 2025.

Which end use segment is expected to contribute significant share in the lithium and lithium ion battery electrolyte market in 2025?

In terms of end use, the automotive segment is projected to command 36% share in the lithium and lithium ion battery electrolyte market in 2025.

Explore Similar Insights

Future Market Insights

Lithium and Lithium Ion Battery Electrolyte Market

Chat With

MaRIA

Hi There, I am MaRIA, Your Market Research Intelligence Assistant. How may I help you?