
- Market Size (2026)
- USD 2684.0 Mn
- Forecast (2036)
- USD 12901.5 Mn
- CAGR (2026 to 2036)
- 17.0%
How big is the Loitering Munition Market in 2026?
The global loitering munition market is on course to reach USD 12,901.5 million by 2036, a 17.0% CAGR from 2026 to 2036. The market was valued at USD 2,200.0 million in 2025 and is estimated at USD 2,684.0 million in 2026.
Loitering Munition Market Size and Forecast
Table 1: Loitering Munition Market Size and Forecast
| Market size and forecast | Value |
|---|---|
| Market size in 2025 | USD 2,200.0 million |
| Estimated market size in 2026 | USD 2,684.0 million |
| Projected market size by 2036 | USD 12,901.5 million |
| CAGR from 2026 to 2036 | 17.0% |
Source: Future Market Insights analysis of the loitering munition market, 2026.
Funded repeat orders give this market its commercial base. AeroVironment disclosed a USD 186.0 million US Army delivery order in February 2026 under an existing USD 990.0 million contract ceiling. Poland took a different purchasing route. Its May 2025 WARMATE framework covers nearly 10,000 munitions through subsequent implementation agreements running to 2035. A ceiling creates purchasing capacity, whereas each funded release creates a production obligation.
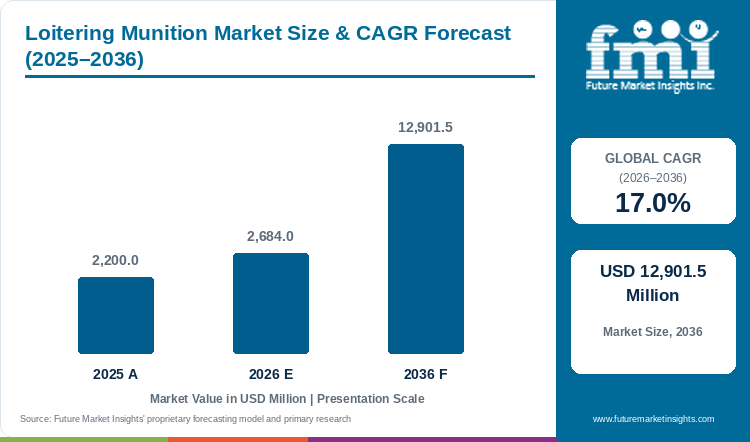
FMI expects revenue growth to depend on how efficiently manufacturers convert such commitments into accepted deliveries. Germany's June 2026 explanation of its purchasing approach described smaller initial orders, performance milestones and contractual requirements for continuing innovation. Suppliers must fund production while supporting successive accepted configurations. At a 17.0% CAGR, revenue in 2036 is 4.8 times the 2026 estimate. Investment in unmanned systems provides wider context for this market.
Key Market Trends & Insights
- National purchasing rules influence the supplier shortlist. India's August 2026 contracts for Loiter Munition Systems used the Buy (Indian) category and Fast Track Procedure. Local manufacturing participation therefore has commercial weight before price comparisons begin.
- Support equipment adds a material layer to procurement. Teledyne's December 2025 Marine Corps award covered more than 600 Rogue 1 systems together with control stations and training kits. A contract total therefore reflects a package value.
- Manufacturers are building domestic production capacity. Helsing described an operational German facility and initial monthly production capacity in February 2025. Customer acceptance determines the timing of sales from that capacity.
Regional Highlights
- The weight of Poland, Germany and India in global revenue increases. FMI projects Poland from 4.0% to 6.1%, Germany from 4.0% to 6.1% and India from 5.0% to 6.5% over 2026 to 2036.
- Revenue rises in Russia, Israel and Ukraine, though each loses global share. The 2036 outlook has Russia at 14.0% against 18.0% in 2026, Israel at 4.6% against 7.0% in 2026 and Ukraine at 13.6% against 16.0% in 2026.
Analyst Perspective
“The strongest commercial position belongs to a manufacturer that can meet funded delivery schedules while maintaining an accepted product configuration. Large framework ceilings attract attention, but repeat releases and documented acceptance provide the clearer evidence of continuing demand. Production investment must accommodate both replenishment economics and the customer's requirement for revisions during a contract.”
- Sudip Saha, Co-founder, FMI
How is the Loitering Munition Market segmented?
- By range: Short Range, Medium Range, and Long Range.
- By launch platform: Ground-launched, Air-launched, Naval-launched, and Man-portable.
- By guidance: Operator-guided, Semi-autonomous, and Autonomous and AI-enabled.
- By region: North America, Western Europe, Eastern Europe, East Asia, South Asia, Middle East, and Rest of world.
Why does the Short Range segment lead by Range in the Loitering Munition Market in 2026?
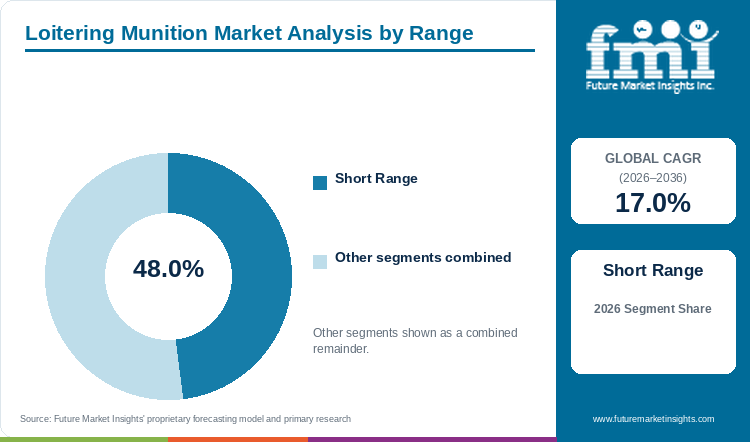
The Short Range segment holds 48.0% of the Loitering Munition Market by range in 2026.
Short Range leads the individual categories, but Medium Range and Long Range together account for 52.0% of revenue. Within the leading category, initial equipment purchases and replenishment create different delivery schedules and revenue mixes.
The US Marine Corps' Organic Precision Fires-Light programme illustrates how qualification and production purchasing connect. Anduril reported a USD 23.9 million award in January 2026 following a testing phase, with deliveries scheduled from February 2026 to April 2027. The relevant commercial evidence is the transition to a scheduled production obligation.
Short Range revenue is forecast to reach USD 5,217.5 million by 2036. Its share nevertheless falls to 40.4%, as other range categories grow faster. Manufacturers dependent on one class face a portfolio decision. Maintaining volume in the leading category may require a different cost structure from pursuing smaller programmes with more integration work. Order composition determines the implications for a factory's sales mix.
Medium Range and Long Range together hold the remaining 52.0% by range.
Table 2: Range, 2026 Share
| Leading Share | 2026 market share |
|---|---|
| Short Range | 48.0% |
| All Other Segments Combined Share | 52.0% |
Source: Future Market Insights analysis of the loitering munition market, 2026.
Why does the Ground-launched segment lead by Launch Platform in the Loitering Munition Market in 2026?
The Ground-launched segment holds 62.0% of the Loitering Munition Market by launch platform in 2026.
Large land-force acquisition programmes support the Ground-launched category. Its sales include initial launch equipment and subsequent munition purchases, which gives the category more than one source of revenue over a customer's programme. Germany's procurement explicitly allows further calls after smaller initial introductions prove satisfactory. For suppliers, this creates a continuing acceptance relationship.
FMI forecasts Ground-launched revenue of USD 7,365.8 million in 2036. Its share declines to 57.1% as the other platform categories expand. Air-launched products are a particularly fast-growing part of the outlook, with a 20.0% forecast CAGR. UVision announced an aerial-launch development for HERO-120 in June 2025.
Platform-specific purchases add approval and programme-management work. A new platform category broadens the possible revenue pool while requiring its own customer acceptance. Ground-launched leadership therefore coexists with a gradual broadening of the sales mix.
Air-launched, Naval-launched and Man-portable together hold the remaining 38.0% by launch platform.
Table 3: Launch Platform, 2026 Share
| Leading Share | 2026 market share |
|---|---|
| Ground-launched | 62.0% |
| All Other Segments Combined Share | 38.0% |
Source: Future Market Insights analysis of the loitering munition market, 2026.
Why does the Operator-guided segment lead by Guidance in the Loitering Munition Market in 2026?
The Operator-guided segment holds 45.0% of the Loitering Munition Market by guidance in 2026.
Automation and human supervision can coexist within one offering. IAI describes HAROP as supervised by human mission control, while Elbit's published SkyStriker material also identifies remote operation.
The forecast shows a pronounced change in mix. Operator-guided revenue rises to USD 2,905.2 million by 2036, but its share falls to 22.5%. Autonomous and AI-enabled products reach a 47.6% share, with a 24.8% CAGR.
Software revisions, documentation and verification may continue throughout a purchasing programme. Germany's published innovation clauses make that continuing obligation explicit. A manufacturer must price the work needed to preserve acceptance. The adjacent drone sensor market covers component demand.
Semi-autonomous and Autonomous and AI-enabled together hold the remaining 55.0% by guidance.
Table 4: Guidance, 2026 Share
| Leading Share | 2026 market share |
|---|---|
| Operator-guided | 45.0% |
| All Other Segments Combined Share | 55.0% |
Source: Future Market Insights analysis of the loitering munition market, 2026.
What are the key drivers restraints and opportunities?
Funded replenishment and national acquisition programmes support growth. Acceptance requirements, export permissions and rapidly changing specifications restrict conversion into revenue. Industrial partnerships create opportunities where buyers prioritize local supply.
Driver
Customers are placing recurring delivery orders and longer-duration purchasing frameworks, providing a basis for serial production.
Restraint
Framework ceilings, announced capacity and supplier demonstrations offer no guarantee of funded releases or accepted deliveries.
Opportunity
Local production and sustained configuration support can strengthen an offer where national procurement favours domestic industrial participation.
How do purchasing rules and qualification affect loitering munition market demand?
Government purchases are becoming more structured, although the contracts differ substantially. Poland's programme extends purchasing authority across a decade through later implementation agreements. The US Army example represents a funded delivery order under an established ceiling. For a manufacturer deciding when to invest, the sequence of customer commitments matters: qualification, funded release, delivery and acceptance each remove a different commercial uncertainty.
Ukraine's procurement announcements cover a broad mix of drones. Their scale demonstrates industrial demand, but much of that expenditure falls outside this report's narrower product definition. FMI expects specialized suppliers to compete on the parts of those programmes that purchase covered munition systems. Counting all unmanned aircraft as loitering munitions would overstate the available revenue. Wider unmanned aircraft procurement outside this definition is covered in FMI's unmanned aerial vehicle market.
What limits reliable loitering munition market supply and quality?
Product revisions can impose continuing costs after a contract is signed. Germany's milestone structure and innovation clauses illustrate a customer retaining the right to demand progress before committing to larger releases. This creates a working-capital burden when a manufacturer has invested in production ahead of acceptance. A backlog should be examined for its release conditions, as well as its gross value.
International trade adds a separate constraint. China's October 2026 announcement set 18 November 2026 as the future effective date for revised controls on drone-related items. The measures concern identified dual-use items and licensing. Suppliers must establish the applicable rules for each transaction. Sanctions affecting Russian defence entities create another barrier to lawful cross-border business. The related counter drone system market follows a different procurement purpose and is not included in the revenue forecast.
Where can suppliers win additional business in the loitering munition market?
National industrial policy creates openings for licensed production, customer-country assembly and long-duration support arrangements. India's signed Buy (Indian) contracts provide a concrete example of procurement being directed through domestic contractors. The commercial opportunity is an accepted local industrial offer, not simply a lower export quotation.
European production partnerships offer a different route. Rheinmetall identified RWM Italia as the production location for its NATO customer's HERO orders, with UVision support. Such arrangements connect an established product family to a regional manufacturing base. FMI expects customers to value a clear allocation of responsibility for delivery, revisions and support. Partnerships that divide those obligations ambiguously risk delaying acceptance even when the underlying product is available.
Loitering Munition Market by Country (2026 to 2036)
Table 5: Loitering Munition Market Country Growth Forecast
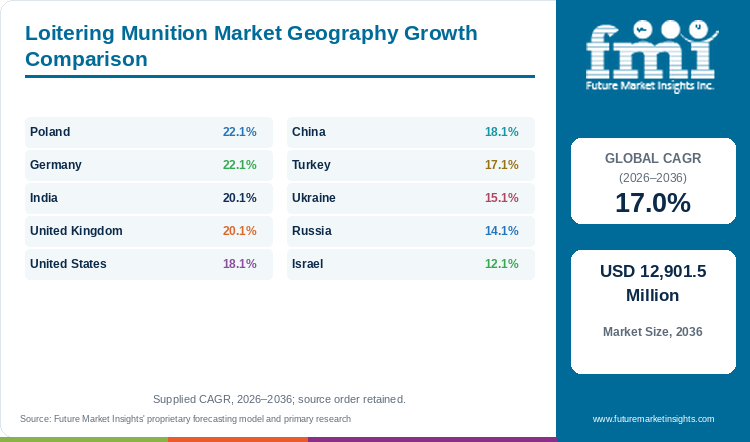
| Country | CAGR, 2026 to 2036 |
|---|---|
| Poland | 22.1% |
| Germany | 22.1% |
| India | 20.1% |
| United Kingdom | 20.1% |
| United States | 18.1% |
| China | 18.1% |
| Turkey | 17.1% |
| Ukraine | 15.1% |
| Russia | 14.1% |
| Israel | 12.1% |
Source: Future Market Insights analysis of the loitering munition market, 2026.
Poland
Poland's WARMATE framework creates a long purchasing horizon without fixing every delivery at signature. WB Group's May 2025 announcement described nearly 10,000 munitions in approximately 1,000 sets, to be acquired through implementation agreements by 2035. Those are different measures. Sets include the equipment arrangement around the rounds, while the framework governs later releases. Treating all three as one immediate delivery would misrepresent the programme.
FMI forecasts Poland at USD 107.4 million in 2026 and USD 790.6 million in 2036. The 22.1% CAGR over 2026 to 2036 is jointly the highest rate among the individually covered countries. Poland's revenue share rises from 4.0% to 6.1%. Growth reflects a developing procurement base instead of a claim that all framework volumes will be delivered in the base year. Poland adds USD 683.2 million, which places it joint sixth among the ten.
For domestic industry, the long horizon supports planning while preserving the customer's ability to purchase updated versions. This creates an incentive to maintain product development and accepted configuration control throughout the programme. The commercial challenge is to align investment with actual implementation orders. Production expansion before funded releases creates financing exposure, while expansion too late can weaken delivery credibility. FMI also distinguishes Polish customer demand from WB Group's export business. Foreign contracts support the company's wider manufacturing scale but belong to the relevant customer geography in this assessment.
Germany
Contract design is a defining feature of Germany's emerging market. The Bundeswehr reported purchases from Helsing and Stark in February 2026 and a third manufacturer in April 2026. Its published explanation highlighted performance milestones, initial smaller purchases and continuing innovation clauses. The customer is explicitly preserving options while the product category develops.
This approach supports FMI's forecast of USD 107.4 million in 2026 and USD 790.6 million in 2036. Germany's 22.1% CAGR from 2026 to 2036 matches Poland's as the fastest rate among covered individual countries. Its share rises from 4.0% to 6.1%. The forecast describes national demand and does not assign all production at German factories to German customers.
Domestic manufacturing is nevertheless an important industrial feature. One supplier announced an operational southern German factory in February 2025 as part of its Ukraine supply programme. The example separates plant location from customer geography. It also illustrates why a capacity announcement cannot be counted as domestic procurement revenue. FMI expects the German market to reward companies that can sustain development obligations after initial qualification. That requirement affects margins, staffing and the timing of investment across the contract. A low initial quotation may not remain commercially attractive if frequent revisions are inadequately funded. Conversely, a manufacturer with a clear path from trial quantities to repeat releases has a better basis for committing capital than one relying solely on public interest in the product category.
India
India's August 2026 procurement provides direct evidence that localization affects order allocation. The Ministry of Defence signed approximately INR 1,577.0 crore of Loiter Munition Systems contracts with TATA Advanced Systems Limited and NIBE Private Limited under the Buy (Indian) category. The announcement concerned signed contracts with accessories, not a general spending aspiration. It supports a concrete assessment of domestic industrial participation.
FMI forecasts revenue of USD 134.2 million in 2026 and USD 837.6 million in 2036. A 20.1% CAGR from 2026 to 2036 lifts India's share from 5.0% to 6.5%. The national market remains smaller than the largest current revenue pools, but its forecast rate gives it increasing importance to suppliers considering long-term customer development. Revenue in India multiplies 6.2 times by 2036, compared with 4.8 times worldwide.
The likely commercial route differs from a simple finished-product export sale. Domestic eligibility, contractual responsibility and access to a recognized local industrial offer affect which companies can participate. International product owners may contribute through partnerships, subject to the rules of the relevant acquisition. FMI expects the value of such relationships to depend on what is actually manufactured, supported and accepted locally. Equally, the total value of a signed equipment package should not be divided by an assumed round quantity to infer a national unit price. The reported accessories content makes that shortcut unreliable.
United Kingdom
British drone funding serves two distinct purposes: supporting Ukraine and developing the UK's own defence capability. In June 2025 the Ministry of Defence announced GBP 350.0 million for drones supplied to Ukraine and a target of 100,000 drones for that year. The programme covers several drone categories.
FMI forecasts covered UK revenue at USD 80.5 million in 2026 and USD 502.6 million in 2036. The 20.1% CAGR between 2026 and 2036 increases the country's share from 3.0% to 3.9%. This is a smaller starting market than the large current demand centres, with a comparatively strong expected rate of expansion. In the loitering munition market, the United Kingdom's 20.1% CAGR sits 3.1 points above the global 17.0%. The United Kingdom holds tenth place by 2026 revenue.
For companies, externally funded production can establish industrial experience and customer relationships without guaranteeing a later British procurement award. The route from supply for an overseas beneficiary to domestic acquisition involves separate requirements and budgets. FMI expects firms to benefit when they can demonstrate delivery continuity and a credible support arrangement, while keeping programme attribution precise. The government's funding announcement also referred to British defence companies, including smaller businesses. That gives evidence of industrial participation across the wider drone sector. Clear separation of donor funding, domestic demand and broader drone activity is essential to a realistic commercial assessment.
United States
The US market provides unusually clear public evidence of successive contract stages. AeroVironment's February 2026 announcement identified a USD 186.0 million delivery order under the Army's existing five-year arrangement. The order is a more immediate sales indicator than the maximum amount available under the framework. It also shows an existing supplier selling a revised product generation within an established customer relationship. In the loitering munition market, the United States adds USD 1,606.8 million, ranking first for increase. The United States' share of the global market rises from 14.0% to 15.4%. In the loitering munition market, the United States' revenue grows 5.3 times over the decade, against 4.8 times globally.
FMI forecasts US revenue of USD 375.8 million in 2026, rising to USD 1,982.6 million by 2036 at an 18.1% CAGR. The country's share increases from 14.0% to 15.4% during the period. No national revenue figure should be equated with the contract ceiling of an individual manufacturer.
The Marine Corps presents a further commercial distinction. Teledyne's announced production award included control stations and training kits, demonstrating the equipment and support content surrounding delivered rounds. That package structure affects the revenue mix when a programme is introduced. Later replenishment can have a different composition. FMI expects suppliers with existing acceptance history to retain an advantage in follow-on orders, while competing programmes create routes for additional manufacturers. The decisive evidence is a funded requirement that progresses into scheduled deliveries.
China
Export controls are a concrete commercial consideration in China's unmanned-technology sector. On 19 October 2026, MOFCOM announced adjustments for specified drone-related items and stated that the measures would take effect on 18 November 2026. As of this assessment, that effective date remains in the future. The announcement addresses licensing of covered dual-use items and does not amount to a prohibition on all civilian drones or all military-related products.
FMI projects China's covered market at USD 187.9 million in 2026. Revenue reaches USD 991.3 million by 2036 under an 18.1% CAGR outlook for 2026 to 2036. The revenue share increases from 7.0% to 7.7%. These figures describe market demand. They are separate from the country's broader position in unmanned-product manufacturing and component trade. China accounts for 7.0% of global revenue in 2026 and 7.7% in 2036. China records a USD 803.4 million increase, fourth of the ten.
An exporter must establish whether the relevant transaction requires permission and whether the receiving customer and intended use meet the applicable requirements. This adds a policy-dependent element to cross-border lead times. Domestic purchasing and export production also respond to different contractual authorities. FMI therefore treats announcements concerning general drone trade as context, instead of as proof of an equivalent increase in loitering munition sales. A clear product boundary is particularly important when a country manufactures both consumer aircraft and specialized defence systems across distinct companies and contracting arrangements.
Turkey
Turkey's supplier base has a visible export dimension alongside domestic purchasing. STM reported that KARGU was in service in more than ten countries across three continents in its February 2025 exercise announcement. That is company-reported international reach. It supports the existence of a wider customer base, but does not disclose the revenue distribution or quantities bought by each country.
FMI estimates Turkey's domestic covered revenue at USD 107.4 million in 2026 and USD 520.2 million in 2036. The forecast CAGR is 17.1% during 2026 to 2036, with the country maintaining approximately a 4.0% global share. This domestic demand series should remain separate from the worldwide sales of a Turkish manufacturer. Exports can expand factory activity without raising Turkish customer demand by the same amount. At 17.1%, the CAGR for Turkey is 0.1 points above the global 17.0%.
The industrial implication is a balance between home-customer continuity and varied export requirements. A common product family may support several national customers, but approval, training and contractual support arrangements are not automatically interchangeable. FMI expects manufacturers to assess the cost of maintaining that customer spread instead of judging an export footprint only by its country count. The most useful indicators for commercial assessment are identified contractual customers, the scope of the package and the status of delivery commitments. Reported adoption provides context within those boundaries.
Ukraine
Ukraine's drone procurement scale is substantial, yet the boundary of this market is especially important in the country. In March 2025 the Ministry of Defence described plans to purchase 4.5 million FPV drones and allocate more than UAH 110.0 billion to drones. Those figures cover a much wider category than this report. They cannot be substituted for loitering munition unit demand or revenue.
For covered systems, FMI projects USD 429.4 million in 2026 and USD 1,751.4 million by 2036. The implied outlook is a 15.1% CAGR during 2026 to 2036. Procurement involves both domestic industrial supply and international support. This creates a distinction between where a system is manufactured, which institution finances it and where the covered demand is recorded. A donor announcement does not automatically become revenue for a Ukrainian manufacturer. In the loitering munition market, Ukraine's 15.1% CAGR sits 1.9 points below the global 17.0%.
The ministry said 96.0% of its preceding drone procurement amount had gone to Ukrainian manufacturers and suppliers. This provides direct evidence of local participation across the broader drone sector. FMI expects local contractual access, delivery continuity and the ability to maintain accepted product versions to influence purchasing within the narrower munition category as well. Competition can become intense where many manufacturers seek the same funded demand. Companies must assess those elements separately from the headline scale of national procurement.
Russia
Russia has the largest individual country revenue base in FMI's 2026 assessment, at USD 483.1 million. Revenue is forecast to reach USD 1,805.5 million by 2036, representing a 14.1% CAGR from 2026 to 2036. Its share falls from 18.0% to 14.0% as other country markets expand more quickly. In the loitering munition market, Russia adds USD 1,322.4 million, ranking second for increase. Russia's share of global revenue eases from 18.0% to 14.0%. Russia's revenue grows 3.7 times over the decade, against 4.8 times globally. In the loitering munition market, Russia's 2026 revenue ranks first of ten.
Public evidence also shows why the Russian market must be assessed separately from ordinary international defence commerce. The US Treasury identified an Alabuga procurement and production network in its February 2024 sanctions announcement. An EU implementing regulation in March 2025 described LLC CST, also identified as Zala Aero Group, within the Kalashnikov Group's unmanned-weapons activity. These records establish restrictions and industrial relationships.
FMI's commercial reading is that a large demand base can coexist with limited lawful international access. Financing, ownership screening and the identity of the contractual counterparty affect the practical addressable market. National spending may support domestic production without creating a comparable opportunity for foreign equipment vendors. Sparse public disclosure also makes commercial comparisons with publicly reporting Western manufacturers less reliable.
Israel
Israel combines a domestic demand base with several internationally marketed product families. IAI's HAROP and Elbit Systems' SkyStriker are documented offerings, while a third supplier participates through the HERO family. These companies should be evaluated through their actual commercial roles. A product's global reach does not mean that all of its manufacturer's sales belong to the Israeli country market.
Domestic covered revenue is projected at USD 187.9 million in 2026 and USD 588.2 million in 2036. FMI's 12.1% CAGR during 2026 to 2036 is under the global rate, reducing Israel's share from 7.0% to 4.6%. It therefore remains consistent with a significant export-oriented supplier base. By absolute increase, Israel ranks last with USD 400.3 million over the decade.
Industrial partnerships shape the commercial route abroad. This cooperation connects the HERO product family with Italian manufacturing for a NATO customer. The sales opportunity involves regional industrial participation and the allocation of support responsibilities, in addition to the original product. FMI expects such arrangements to matter where customers want local production access or a familiar national contracting entity. Product portfolios can also span different customer programmes, so comparisons based on a single advertised feature are incomplete. For buyers and investors, contract geography, manufacturing location and demand geography should remain separate measures. Combining them would overstate both national demand and the revenue attributable to a specific supplier.
Who are the notable companies in the Loitering Munition Market?
Notable companies in the Loitering Munition Market include AeroVironment, Israel Aerospace Industries, Elbit Systems, Kalashnikov Group and Rheinmetall.
AeroVironment, Rheinmetall, WB Group and Teledyne FLIR provide contrasting examples of commercial positioning. AeroVironment has an established US Army delivery-order relationship. WB Group's Polish framework supports a longer national purchasing programme. Rheinmetall combines a European manufacturing role with a product partnership, while Teledyne supplies a package that includes control and training equipment. These are different paths to recurring revenue, not interchangeable indicators of market share.
IAI, Elbit and UVision contribute distinct marketed product families. STM adds a Turkish offering with a documented international customer footprint. Kalashnikov Group belongs to a separate commercial and sanctions context, which prevents treating it as an ordinary alternative for all customers. Helsing and Anduril illustrate newer competitors progressing from development into production commitments.
FMI expects the competitive field to remain divided by customer eligibility, national industrial policy and programme maturity. A company may hold a strong position in one procurement channel while having limited access to another. Manufacturing capacity, documented contracts and product acceptance provide the clearest comparisons. Parent-company revenue includes activities beyond the covered munition business and therefore measures a different commercial perimeter.
Key Developments in the Loitering Munition Market
- In February 2026, AeroVironment announced a USD 186.0 million Army delivery order for its next-generation Switchblade products under the existing Lethal Unmanned Systems contract.
- In August 2026, India's Ministry of Defence signed approximately INR 1,577.0 crore of Loiter Munition Systems contracts with TATA Advanced Systems Limited and NIBE Private Limited.
Key Players in the Loitering Munition Market
- AeroVironment
- Israel Aerospace Industries
- Elbit Systems
- Kalashnikov Group
- Rheinmetall
- STM
- UVision Air
- WB Group
- Teledyne FLIR
- Helsing
- Anduril
Loitering Munition Market Report Scope
Table 6: Loitering Munition Market Report Scope
| Coverage field | Report scope |
|---|---|
| Market definition | Expendable unmanned aerial weapons sold with associated launchers and control stations |
| Included product boundary | Tube-launched, vehicle-launched and long-range one-way attack systems within the stated scope |
| Exclusions | Reusable surveillance aircraft, counter-drone systems and separately sold general communications equipment |
| Quantitative Units | USD million |
| Market breakdowns | Range, Launch Platform and Guidance |
| Country and aggregate coverage | Russia, Ukraine, United States, Israel, China, India, Poland, Turkey, Germany and United Kingdom |
| Regions covered | North America, Western Europe, Eastern Europe, East Asia, South Asia, Middle East and Other covered geography |
| Companies covered | AeroVironment, Israel Aerospace Industries, Elbit Systems, Kalashnikov Group, Rheinmetall, STM, UVision Air, WB Group, Teledyne FLIR, Helsing and Anduril |
Source: Future Market Insights analysis of the loitering munition market, 2026.
Loitering Munition Market Research Methodology
This assessment combines FMI's numerical outlook with secondary review of original procurement announcements, manufacturer disclosures and regulatory records. Validation separates values from unit volumes and customer demand from production geography. Competitive interpretation uses documented contractual roles, retaining the stated delivery schedules and approval status of each announcement.
Loitering Munition Market by Segments
Loitering Munition Market segmented by Range:
- Short Range
- Medium Range
- Long Range
Loitering Munition Market segmented by Launch Platform:
- Ground-launched
- Air-launched
- Naval-launched
- Man-portable
Loitering Munition Market segmented by Guidance:
- Operator-guided
- Semi-autonomous
- Autonomous and AI-enabled
Loitering Munition Market by Region
- North America
- United States
- Western Europe
- Germany
- United Kingdom
- Eastern Europe
- Russia
- Ukraine
- Poland
- East Asia
- China
- South Asia
- India
- Middle East
- Israel
- Turkey
- Other covered geography
- Rest of world aggregate
Research Sources and Bibliography
- AeroVironment. (2026, February 26). AV Receives USD 186 Million U.S. Army Delivery Order for Next-Generation Switchblade Systems.
- Anduril Industries. (2026, January 15). Anduril Awarded USD 23.9 Million Contract for U.S. Marine Corps Organic Precision Fires-Light Program.
- Bundeswehr. (2026, June 2). Loitering Munition: Gamechanger für die Bundeswehr.
- Council of the European Union. (2025, March 14). Council Implementing Regulation (EU) 2025/527, entity entries. Official Journal of the European Union.
- Elbit Systems. (2017, June 20). Elbit Systems Introduces SkyStriker.
- Helsing. (2025, February 13). Helsing to produce 6,000 additional strike drones for Ukraine.
- Israel Aerospace Industries. (Accessed 2026, November 9). HAROP product overview.
- Ministry of Commerce of the People's Republic of China. (2026, October 19). MOFCOM Spokesperson's Remarks on Optimizing and Adjusting Export Control Measures for Drone-Related Items.
- Ministry of Defence, Government of India. (2026, August 14). Aatmanirbhar Bharat: MoD inks Rs 1,577 crore contracts for Loiter Munition Systems for Indian Army. Press Information Bureau, Release 2299561.
- Ministry of Defence of Ukraine. (2025, March 10). Glib Kanievskyi: In 2025, the Ministry of Defence plans to procure 4.5 million FPV drones.
- Rheinmetall. (2025, November 26). Rheinmetall supplies NATO customer a significant number of HERO Loitering Munitions.
- STM. (2025, February 6). STM's Tactical Mini UAV Systems Hit Targets at Winter Exercise 2025.
- Teledyne Technologies. (2025, December 5). Teledyne FLIR Defense Awarded USD 42.5 Million Drone Contract for U.S. Marine Corps Organic Precision Fires-Light Program.
- UK Ministry of Defence. (2025, June 4). Tenfold increase in UK drone deliveries for Ukraine at 50-nation Ukraine summit.
- US Department of the Treasury. (2024, February 23). Treasury sanctions hundreds of targets in Russia and globally, including the Alabuga UAV procurement network.
- UVision Air. (2025, June 5). UVision Unveils Aerial Launch Capability for HERO-120.
- WB Group. (2025, May 15). 10,000 Warmates for Poland.
Table of Content
- Key Takeaways
- Market Size and CAGR
- Top Growth Driver
- Fastest Growing Segment
- Leading Region
- Key Companies
- Emerging Opportunities
- Executive Summary
- Global Market Outlook
- Demand-side Trends
- Supply-side Trends
- Technology Roadmap Analysis
- Analysis and Recommendations
- Analyst Perspective (What is happening? Why now? What should investors know?)
- Key Questions Answered
- How large is the market?
- What is the CAGR?
- What are key trends?
- Which region dominates?
- Who are the leaders?
Read More...
- Market Overview
- Market Coverage / Taxonomy
- Market Definition / Scope / Limitations
- Research Methodology
- Chapter Orientation
- Analytical Lens and Working Hypotheses
- Market Structure, Signals, and Trend Drivers
- Benchmarking and Cross-market Comparability
- Market Sizing, Forecasting, and Opportunity Mapping
- Research Design and Evidence Framework
- Desk Research Programme (Secondary Evidence)
- Expert Input and Fieldwork (Primary Evidence)
- Tooling, Models, and Reference Databases
- Data Engineering and Model Build
- Quality Assurance and Audit Trail
- Market Background
- Market Dynamics (Drivers, Restraints, Opportunity, Trends)
- Scenario Forecast (Optimistic, Likely, Conservative)
- Impact Analysis
- AI Impact
- Sustainability Impact
- Regulatory Impact
- Technology Impact
- Consumer / Buyer Analysis
- Purchase Drivers
- Adoption Barriers
- Buyer Journey
- Opportunity Map Analysis
- Product Life Cycle Analysis
- Supply Chain Analysis
- Investment Feasibility Matrix
- Value Chain Analysis
- PESTLE and Porter's Analysis
- Regulatory Landscape
- Regional Parent Market Outlook
- Production and Consumption Statistics
- Import and Export Statistics
- Global Market Analysis and Forecast, 2021 to 2036
- Historical Market Size Value (USD Million) Analysis, 2021 to 2025
- Current and Future Market Size Value (USD Million) Projections, 2026 to 2036
- Y-o-Y Growth Trend Analysis
- Absolute $ Opportunity Analysis
- Global Market Pricing Analysis, 2021 to 2036
- Global Market Analysis and Forecast, By Range, 2021 to 2036
- Introduction / Key Findings
- Historical Market Size Value (USD Million) Analysis By Range, 2021 to 2025
- Current and Future Market Size Value (USD Million) Analysis and Forecast By Range, 2026 to 2036
- Short Range
- Medium Range
- Long Range
- Y-o-Y Growth Trend Analysis By Range, 2021 to 2025
- Absolute $ Opportunity Analysis By Range, 2026 to 2036
- Global Market Analysis and Forecast, By Launch Platform, 2021 to 2036
- Introduction / Key Findings
- Historical Market Size Value (USD Million) Analysis By Launch Platform, 2021 to 2025
- Current and Future Market Size Value (USD Million) Analysis and Forecast By Launch Platform, 2026 to 2036
- Ground-launched
- Air-launched
- Naval-launched
- Man-portable
- Y-o-Y Growth Trend Analysis By Launch Platform, 2021 to 2025
- Absolute $ Opportunity Analysis By Launch Platform, 2026 to 2036
- Global Market Analysis and Forecast, By Guidance, 2021 to 2036
- Introduction / Key Findings
- Historical Market Size Value (USD Million) Analysis By Guidance, 2021 to 2025
- Current and Future Market Size Value (USD Million) Analysis and Forecast By Guidance, 2026 to 2036
- Operator-guided
- Semi-autonomous
- Autonomous and AI-enabled
- Y-o-Y Growth Trend Analysis By Guidance, 2021 to 2025
- Absolute $ Opportunity Analysis By Guidance, 2026 to 2036
- Global Market Analysis and Forecast, By Region, 2021 to 2036
- Introduction
- Historical Market Size Value (USD Million) Analysis By Region, 2021 to 2025
- Current Market Size Value (USD Million) Analysis and Forecast By Region, 2026 to 2036
- North America
- Western Europe
- Eastern Europe
- East Asia
- South Asia
- Middle East
- Market Attractiveness Analysis By Region
- North America Market Analysis and Forecast, By Country, 2021 to 2036
- Historical Market Size Value (USD Million) Trend Analysis By Market Taxonomy, 2021 to 2025
- Market Size Value (USD Million) Forecast By Market Taxonomy, 2026 to 2036
- By Country
- United States
- By Range
- By Launch Platform
- By Guidance
- By Country
- Market Attractiveness Analysis
- By Country
- By Range
- By Launch Platform
- By Guidance
- Key Takeaways
- Western Europe Market Analysis and Forecast, By Country
- Historical Market Size Value (USD Million) Trend Analysis By Market Taxonomy, 2021 to 2025
- Market Size Value (USD Million) Forecast By Market Taxonomy, 2026 to 2036
- By Country
- Germany
- United Kingdom
- By Range
- By Launch Platform
- By Guidance
- By Country
- Market Attractiveness Analysis
- By Country
- By Range
- By Launch Platform
- By Guidance
- Key Takeaways
- Eastern Europe Market Analysis and Forecast, By Country
- Historical Market Size Value (USD Million) Trend Analysis By Market Taxonomy, 2021 to 2025
- Market Size Value (USD Million) Forecast By Market Taxonomy, 2026 to 2036
- By Country
- Russia
- Ukraine
- Poland
- By Range
- By Launch Platform
- By Guidance
- By Country
- Market Attractiveness Analysis
- By Country
- By Range
- By Launch Platform
- By Guidance
- Key Takeaways
- East Asia Market Analysis and Forecast, By Country
- Historical Market Size Value (USD Million) Trend Analysis By Market Taxonomy, 2021 to 2025
- Market Size Value (USD Million) Forecast By Market Taxonomy, 2026 to 2036
- By Country
- China
- By Range
- By Launch Platform
- By Guidance
- By Country
- Market Attractiveness Analysis
- By Country
- By Range
- By Launch Platform
- By Guidance
- Key Takeaways
- South Asia Market Analysis and Forecast, By Country
- Historical Market Size Value (USD Million) Trend Analysis By Market Taxonomy, 2021 to 2025
- Market Size Value (USD Million) Forecast By Market Taxonomy, 2026 to 2036
- By Country
- India
- By Range
- By Launch Platform
- By Guidance
- By Country
- Market Attractiveness Analysis
- By Country
- By Range
- By Launch Platform
- By Guidance
- Key Takeaways
- Middle East Market Analysis and Forecast, By Country
- Historical Market Size Value (USD Million) Trend Analysis By Market Taxonomy, 2021 to 2025
- Market Size Value (USD Million) Forecast By Market Taxonomy, 2026 to 2036
- By Country
- Israel
- Turkey
- Other covered geography
- Rest of world aggregate
- By Range
- By Launch Platform
- By Guidance
- By Country
- Market Attractiveness Analysis
- By Country
- By Range
- By Launch Platform
- By Guidance
- Key Takeaways
- Key Countries Market Analysis
- United States
- Pricing Analysis
- Market Share Analysis, 2025
- By Range
- By Launch Platform
- By Guidance
- Germany
- Pricing Analysis
- Market Share Analysis, 2025
- By Range
- By Launch Platform
- By Guidance
- United Kingdom
- Pricing Analysis
- Market Share Analysis, 2025
- By Range
- By Launch Platform
- By Guidance
- India
- Pricing Analysis
- Market Share Analysis, 2025
- By Range
- By Launch Platform
- By Guidance
- China
- Pricing Analysis
- Market Share Analysis, 2025
- By Range
- By Launch Platform
- By Guidance
- Russia
- Pricing Analysis
- Market Share Analysis, 2025
- By Range
- By Launch Platform
- By Guidance
- Poland
- Pricing Analysis
- Market Share Analysis, 2025
- By Range
- By Launch Platform
- By Guidance
- Turkey
- Pricing Analysis
- Market Share Analysis, 2025
- By Range
- By Launch Platform
- By Guidance
- Ukraine
- Pricing Analysis
- Market Share Analysis, 2025
- By Range
- By Launch Platform
- By Guidance
- Israel
- Pricing Analysis
- Market Share Analysis, 2025
- By Range
- By Launch Platform
- By Guidance
- United States
- Market Structure Analysis
- Competition Dashboard
- Competition Benchmarking
- Market Share Analysis of Top Players
- By Regional
- By Range
- By Launch Platform
- By Guidance
- Emerging Startups
- Innovation Benchmarking
- Competition Analysis
- Competition Deep Dive
- AeroVironment
- Overview
- Product Portfolio
- Profitability by Market Segments
- Sales Footprint
- Strategy Overview
- Marketing Strategy
- Product Strategy
- Channel Strategy
- Israel Aerospace Industries
- Elbit Systems
- Kalashnikov Group
- Rheinmetall
- STM
- UVision Air
- WB Group
- Teledyne FLIR
- Helsing
- Anduril
- AeroVironment
- Case Studies
- Success Stories
- Recent Developments
- Competition Deep Dive
- Assumptions & Acronyms Used
List of Tables
- Table 1: Global Market Value (USD Million) Forecast by Region, 2021 to 2036
- Table 2: Global Market Value (USD Million) Forecast by Range, 2021 to 2036
- Table 3: Global Market Value (USD Million) Forecast by Launch Platform, 2021 to 2036
- Table 4: Global Market Value (USD Million) Forecast by Guidance, 2021 to 2036
- Table 5: North America Market Value (USD Million) Forecast by Country, 2021 to 2036
- Table 6: North America Market Value (USD Million) Forecast by Range, 2021 to 2036
- Table 7: North America Market Value (USD Million) Forecast by Launch Platform, 2021 to 2036
- Table 8: North America Market Value (USD Million) Forecast by Guidance, 2021 to 2036
- Table 9: Western Europe Market Value (USD Million) Forecast by Country, 2021 to 2036
- Table 10: Western Europe Market Value (USD Million) Forecast by Range, 2021 to 2036
- Table 11: Western Europe Market Value (USD Million) Forecast by Launch Platform, 2021 to 2036
- Table 12: Western Europe Market Value (USD Million) Forecast by Guidance, 2021 to 2036
- Table 13: Eastern Europe Market Value (USD Million) Forecast by Country, 2021 to 2036
- Table 14: Eastern Europe Market Value (USD Million) Forecast by Range, 2021 to 2036
- Table 15: Eastern Europe Market Value (USD Million) Forecast by Launch Platform, 2021 to 2036
- Table 16: Eastern Europe Market Value (USD Million) Forecast by Guidance, 2021 to 2036
- Table 17: East Asia Market Value (USD Million) Forecast by Country, 2021 to 2036
- Table 18: East Asia Market Value (USD Million) Forecast by Range, 2021 to 2036
- Table 19: East Asia Market Value (USD Million) Forecast by Launch Platform, 2021 to 2036
- Table 20: East Asia Market Value (USD Million) Forecast by Guidance, 2021 to 2036
- Table 21: South Asia Market Value (USD Million) Forecast by Country, 2021 to 2036
- Table 22: South Asia Market Value (USD Million) Forecast by Range, 2021 to 2036
- Table 23: South Asia Market Value (USD Million) Forecast by Launch Platform, 2021 to 2036
- Table 24: South Asia Market Value (USD Million) Forecast by Guidance, 2021 to 2036
- Table 25: Middle East Market Value (USD Million) Forecast by Country, 2021 to 2036
- Table 26: Middle East Market Value (USD Million) Forecast by Range, 2021 to 2036
- Table 27: Middle East Market Value (USD Million) Forecast by Launch Platform, 2021 to 2036
- Table 28: Middle East Market Value (USD Million) Forecast by Guidance, 2021 to 2036
List of Figures
- Figure 1: Global Market Pricing Analysis
- Figure 2: Global Market Value (USD Million) Forecast 2021-2036
- Figure 3: Global Market Value Share and BPS Analysis by Range, 2026 and 2036
- Figure 4: Global Market Y-o-Y Growth Comparison by Range, 2026-2036
- Figure 5: Global Market Attractiveness Analysis by Range
- Figure 6: Global Market Value Share and BPS Analysis by Launch Platform, 2026 and 2036
- Figure 7: Global Market Y-o-Y Growth Comparison by Launch Platform, 2026-2036
- Figure 8: Global Market Attractiveness Analysis by Launch Platform
- Figure 9: Global Market Value Share and BPS Analysis by Guidance, 2026 and 2036
- Figure 10: Global Market Y-o-Y Growth Comparison by Guidance, 2026-2036
- Figure 11: Global Market Attractiveness Analysis by Guidance
- Figure 12: Global Market Value (USD Million) Share and BPS Analysis by Region, 2026 and 2036
- Figure 13: Global Market Y-o-Y Growth Comparison by Region, 2026-2036
- Figure 14: Global Market Attractiveness Analysis by Region
- Figure 15: North America Market Incremental Dollar Opportunity, 2026-2036
- Figure 16: Western Europe Market Incremental Dollar Opportunity, 2026-2036
- Figure 17: Eastern Europe Market Incremental Dollar Opportunity, 2026-2036
- Figure 18: East Asia Market Incremental Dollar Opportunity, 2026-2036
- Figure 19: South Asia Market Incremental Dollar Opportunity, 2026-2036
- Figure 20: Middle East Market Incremental Dollar Opportunity, 2026-2036
- Figure 21: North America Market Value Share and BPS Analysis by Country, 2026 and 2036
- Figure 22: North America Market Value Share and BPS Analysis by Range, 2026 and 2036
- Figure 23: North America Market Y-o-Y Growth Comparison by Range, 2026-2036
- Figure 24: North America Market Attractiveness Analysis by Range
- Figure 25: North America Market Value Share and BPS Analysis by Launch Platform, 2026 and 2036
- Figure 26: North America Market Y-o-Y Growth Comparison by Launch Platform, 2026-2036
- Figure 27: North America Market Attractiveness Analysis by Launch Platform
- Figure 28: North America Market Value Share and BPS Analysis by Guidance, 2026 and 2036
- Figure 29: North America Market Y-o-Y Growth Comparison by Guidance, 2026-2036
- Figure 30: North America Market Attractiveness Analysis by Guidance
- Figure 31: Western Europe Market Value Share and BPS Analysis by Country, 2026 and 2036
- Figure 32: Western Europe Market Value Share and BPS Analysis by Range, 2026 and 2036
- Figure 33: Western Europe Market Y-o-Y Growth Comparison by Range, 2026-2036
- Figure 34: Western Europe Market Attractiveness Analysis by Range
- Figure 35: Western Europe Market Value Share and BPS Analysis by Launch Platform, 2026 and 2036
- Figure 36: Western Europe Market Y-o-Y Growth Comparison by Launch Platform, 2026-2036
- Figure 37: Western Europe Market Attractiveness Analysis by Launch Platform
- Figure 38: Western Europe Market Value Share and BPS Analysis by Guidance, 2026 and 2036
- Figure 39: Western Europe Market Y-o-Y Growth Comparison by Guidance, 2026-2036
- Figure 40: Western Europe Market Attractiveness Analysis by Guidance
- Figure 41: Eastern Europe Market Value Share and BPS Analysis by Country, 2026 and 2036
- Figure 42: Eastern Europe Market Value Share and BPS Analysis by Range, 2026 and 2036
- Figure 43: Eastern Europe Market Y-o-Y Growth Comparison by Range, 2026-2036
- Figure 44: Eastern Europe Market Attractiveness Analysis by Range
- Figure 45: Eastern Europe Market Value Share and BPS Analysis by Launch Platform, 2026 and 2036
- Figure 46: Eastern Europe Market Y-o-Y Growth Comparison by Launch Platform, 2026-2036
- Figure 47: Eastern Europe Market Attractiveness Analysis by Launch Platform
- Figure 48: Eastern Europe Market Value Share and BPS Analysis by Guidance, 2026 and 2036
- Figure 49: Eastern Europe Market Y-o-Y Growth Comparison by Guidance, 2026-2036
- Figure 50: Eastern Europe Market Attractiveness Analysis by Guidance
- Figure 51: East Asia Market Value Share and BPS Analysis by Country, 2026 and 2036
- Figure 52: East Asia Market Value Share and BPS Analysis by Range, 2026 and 2036
- Figure 53: East Asia Market Y-o-Y Growth Comparison by Range, 2026-2036
- Figure 54: East Asia Market Attractiveness Analysis by Range
- Figure 55: East Asia Market Value Share and BPS Analysis by Launch Platform, 2026 and 2036
- Figure 56: East Asia Market Y-o-Y Growth Comparison by Launch Platform, 2026-2036
- Figure 57: East Asia Market Attractiveness Analysis by Launch Platform
- Figure 58: East Asia Market Value Share and BPS Analysis by Guidance, 2026 and 2036
- Figure 59: East Asia Market Y-o-Y Growth Comparison by Guidance, 2026-2036
- Figure 60: East Asia Market Attractiveness Analysis by Guidance
- Figure 61: South Asia Market Value Share and BPS Analysis by Country, 2026 and 2036
- Figure 62: South Asia Market Value Share and BPS Analysis by Range, 2026 and 2036
- Figure 63: South Asia Market Y-o-Y Growth Comparison by Range, 2026-2036
- Figure 64: South Asia Market Attractiveness Analysis by Range
- Figure 65: South Asia Market Value Share and BPS Analysis by Launch Platform, 2026 and 2036
- Figure 66: South Asia Market Y-o-Y Growth Comparison by Launch Platform, 2026-2036
- Figure 67: South Asia Market Attractiveness Analysis by Launch Platform
- Figure 68: South Asia Market Value Share and BPS Analysis by Guidance, 2026 and 2036
- Figure 69: South Asia Market Y-o-Y Growth Comparison by Guidance, 2026-2036
- Figure 70: South Asia Market Attractiveness Analysis by Guidance
- Figure 71: Middle East Market Value Share and BPS Analysis by Country, 2026 and 2036
- Figure 72: Middle East Market Value Share and BPS Analysis by Range, 2026 and 2036
- Figure 73: Middle East Market Y-o-Y Growth Comparison by Range, 2026-2036
- Figure 74: Middle East Market Attractiveness Analysis by Range
- Figure 75: Middle East Market Value Share and BPS Analysis by Launch Platform, 2026 and 2036
- Figure 76: Middle East Market Y-o-Y Growth Comparison by Launch Platform, 2026-2036
- Figure 77: Middle East Market Attractiveness Analysis by Launch Platform
- Figure 78: Middle East Market Value Share and BPS Analysis by Guidance, 2026 and 2036
- Figure 79: Middle East Market Y-o-Y Growth Comparison by Guidance, 2026-2036
- Figure 80: Middle East Market Attractiveness Analysis by Guidance
- Figure 81: Global Market - Tier Structure Analysis
- Figure 82: Global Market - Company Share Analysis
Frequently Asked Questions
How big is the loitering munition market in 2026?
FMI estimates the market at USD 2,684.0 million in 2026, up from USD 2,200.0 million in 2025. It is forecast to reach USD 12,901.5 million by 2036 at a 17.0% CAGR.
Which range leads the loitering munition market in 2026?
Short Range leads by range with 48.0% in 2026. All other segments together hold 52.0%.
Which launch platform and guidance lead in 2026?
Ground-launched holds 62.0% by launch platform and Operator-guided holds 45.0% by guidance in FMI's 2026 assessment.
Which market is forecast to grow fastest through 2036?
Poland and Germany tie for the highest forecast CAGR at 22.1% during 2026 to 2036, followed by India and United Kingdom at 20.1%.
Why is a contract ceiling different from a delivery order?
A ceiling sets the maximum permitted purchasing amount under an arrangement. A delivery order establishes a specific contractual release. AeroVironment's February 2026 Army announcement illustrates the latter within an existing ceiling.[1]
Preview the report firsthand - request a free sample
Get SampleGet the brochure for pricing and purchase details.
Get PDF
