

- Market Size (2026)
- USD 2.5 Bn
- Forecast (2036)
- USD 4.6 Bn
- CAGR (2026 to 2036)
- 6.1%
How big is Membrane Chemicals Market in 2026?
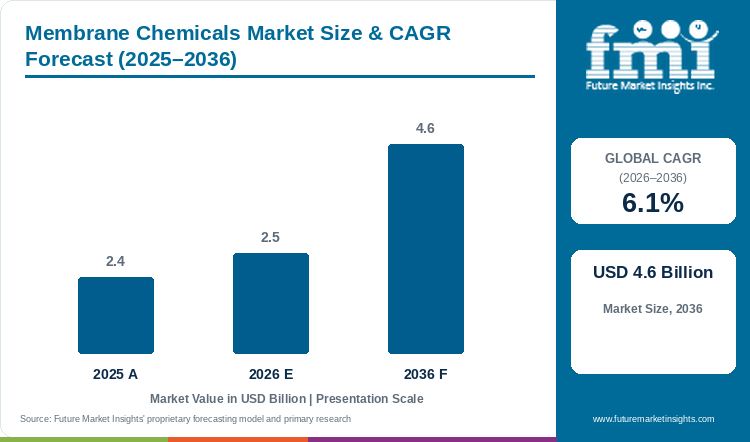
The membrane chemicals market is estimated at USD 2.4 billion in 2025 and is expected to reach USD 2.5 billion in 2026. Demand for membrane chemicals is projected to grow at a CAGR of 6.1% and reach USD 4.6 billion by 2036.
Demand for membrane chemicals moves with every reverse osmosis train that starts up, and sales are estimated at USD 2.4 billion for 2025, with USD 2.5 billion expected in 2026. On FMI's forecast, sales of membrane chemicals are projected to rise to USD 4.6 billion by 2036, a 6.1% CAGR over 2026 to 2036. An adoption review shows operators signing a dosing programme at start-up, as scale and biofilm cut flux within weeks on seawater and reuse feeds. Each new train adds a buyer of antiscalant, biocide and cleaner for the life of the membranes.
Competition in membrane chemistry is turning on price discipline and service reach. Kemira reported lower sales prices and flat volumes for April to June 2026, and bought the Clear Water Technologies business in the US.[1] At Ecolab, an energy surcharge raised pricing to 4% in the same quarter, and the Ovivo Electronics purchase gave Global Water a 6% boost to fixed currency growth.[2] Independent blenders selling generic antiscalant by the drum face the hardest squeeze, as large groups bundle dosing, monitoring and cleaning into one contract.
Chip fab and power station reuse loops are opening a second front for low-phosphorus antiscalants, which suit plants that send concentrate to rivers. A successful trial at commissioning will tie those sites to one supplier for years.
Key Market Trends & Insights
- Every reverse osmosis train doses scale inhibitor ahead of the first membrane stage, so antiscalants and antifoulants are expected to make up 35% of chemical type sales in 2026, with biocides near an estimated 24%.
- Power stations, refineries, chip fabs and food factories are likely to account for an estimated 40% of end use demand in 2026, ahead of waste water treatment at 25%. Ecolab reported 29% organic growth in Global High-Tech in the June 2026 quarter, from microelectronics and data centers.[2]
Regional Highlights
- China is forecast to grow at 8.2%, 2.1 points over the market rate of 6.1%, as coastal provinces and industrial parks add seawater desalination.
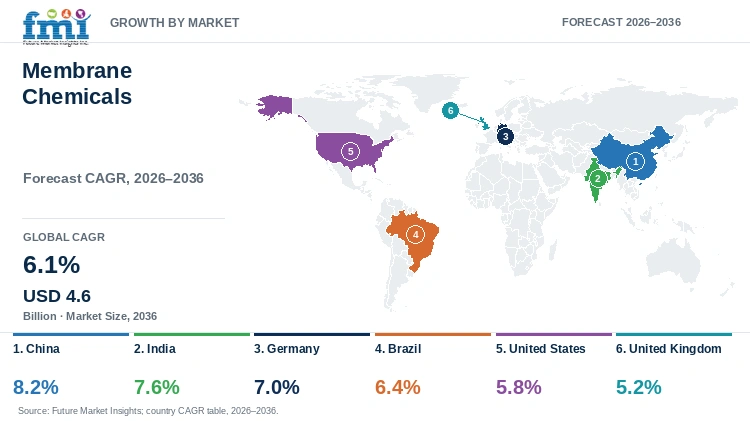
- Behind China, India (7.6%) and Germany (7%) keep a clear lead on the global figure. Brazil is close to the average on 6.4%. Large installed fleets that mainly need replacement chemistry leave the United States on 5.8% and the United Kingdom at the bottom on 5.2%.
- Daily seawater desalination capacity in China has surpassed 3 million tonnes, the Ministry of Natural Resources said in June 2026.[3]
Market Size & Forecast
Table 1: Market Size and Forecast for the Membrane Chemicals Market (USD billion and percentage), 2025 to 2036
| Metric | Value |
|---|---|
| 2025 Market Size | USD 2.4 billion |
| Estimated Market Size in 2026 | USD 2.5 billion |
| Projected Market Size by 2036 | USD 4.6 billion |
| CAGR, 2026 to 2036 | 6.1% |
| Added Revenue, 2026 to 2036 | USD 2.1 billion |
| Market Expansion Multiple | 1.8x |
Orders for membrane chemicals arrive as repeat deliveries, so volume follows the hours that installed membranes run and the number of new trains commissioned. Chennai Metro Water runs three desalination plants with 360 MLD of combined capacity, and two more 400 MLD plants are planned for the city, DT Next reported in September 2026.[4] Ultrapure water for semiconductor and power plants draws on the same chemistry, and an 8% CAGR forecast for the ultrapure water market keeps electronics-grade antiscalant orders rising. On FMI's forecast, the decade adds about USD 2.1 billion of new sales, so the membrane chemicals market in 2036 is likely to be close to 1.8 times as large as in 2026. Softer factory output is the near-term risk, and Kemira saw lower demand in packaging, pulp and industrial water during Q2 2026.[1]
Desalination Pipelines and Pricing Signals
Seawater projects give the steadiest new demand. The Águas de Fortaleza consortium of Marquise, Abengoa Água and PB Construções expects to start building a 1,000 litre per second reverse osmosis plant for about 720,000 people within 60 days, O Povo reported on 17 July 2026.[5] Anglian Water appointed a TYPSA and Stantec joint venture, supported by Acciona Agua, as primary technical partner for two seawater plants in Lincolnshire and Norfolk, under a contract of up to GBP 29 million.[6] Each of these plants will run pretreatment, antiscalant and cleaning programmes for decades once commissioned.
Pricing is the second signal. Kemira put 2026 raw material and logistics cost inflation at about EUR 100 million and expects to recover roughly half through price increases.[1] Ecolab guided to second-half 2026 pricing between 5% and 6%.[2] Veolia reported Water Technologies revenue of EUR 2,213 million for the first half of 2026, up 0.6% excluding projects.[7] Suppliers on service contracts will pass input costs to plant owners sooner than drum sellers can.
Table 2: Desalination, Reuse and Price Indicators for the Membrane Chemicals Market (capacity, sales and price data), 2025 to 2026
| Indicator | Data Point | Relevance | Source |
|---|---|---|---|
| China seawater desalination capacity, June 2026 | Above 3 million tonnes per day | Large installed base needing dosing | [3] |
| Chennai desalination capacity, September 2026 | 360 MLD running; two 400 MLD plants planned | New municipal trains | [4] |
| Fortaleza reverse osmosis plant, July 2026 | 1,000 litres per second; about 720,000 people | New seawater demand in Brazil | [5] |
| Anglian Water technical partner contract, February 2026 | Up to GBP 29 million; two seawater plants | First desalination in the region | [6] |
| Kemira Q2 2026 revenue | EUR 693.0 million; prices lower, volumes stable | Price pressure on commodity chemistry | [1] |
| Ecolab Global High-Tech organic growth, Q2 2026 | Up 29% | Electronics water demand | [2] |
| Veolia Water Technologies revenue, H1 2026 | EUR 2,213 million; up 0.6% excluding projects | Service and chemicals activity | [7] |
Analyst Perspective
“I expect the strongest membrane chemical contracts through 2036 to come from seawater and reuse plants built on long concessions, since operators fix a pretreatment and cleaning programme at commissioning and seldom change supplier afterwards. Pairing low-phosphorus antiscalants with remote fouling monitoring is, in my view, the surest way for a supplier to keep those plants for the full concession.”
- Nikhil Kaitwade, Principal Consultant, Future Market Insights.
How is the membrane chemicals market segmented?
The market is segmented into chemical type, end use, and region. Antiscalants and antifoulants are expected to lead chemical type with 35% share in 2026, and industrial users are likely to lead end use with an estimated 40%.
By chemical type: antiscalants and antifoulants, biocides, pH adjusters, dechlorinants, and others.
By end use: industrial, waste water treatment, municipal, and others.
By region: desalination, reuse and process water plants in North America, Latin America, Western Europe, Eastern Europe, East Asia, South Asia and Pacific, and Middle East and Africa.
Why do antiscalants and antifoulants lead membrane chemicals sales by chemical type?
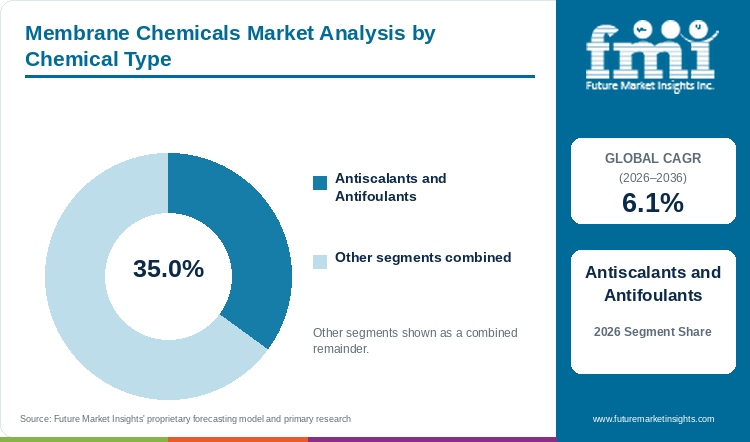
Antiscalants and antifoulants are expected to lead chemical type sales with 35% share in 2026. Biocides follow at an estimated 24%, pH adjusters at about 17%, dechlorinants near 14% and other chemistries at roughly 10%.
Table 3: Chemical Type Share for the Membrane Chemicals Market (percentage share), 2026
| Chemical Type | Estimated Share (2026) |
|---|---|
| Antiscalants and Antifoulants | 35% |
| Biocides | 24% |
| pH Adjusters | 17% |
| Dechlorinants | 14% |
| Others | 10% |
| Total | 100.0% |
Table 4: Chemical Type Leadership and Market Growth for the Membrane Chemicals Market (segment and CAGR percentage), 2026 to 2036
| Metric | Value |
|---|---|
| Global CAGR (2026 to 2036) | 6.1% |
| Leading Segment | Antiscalants and Antifoulants |
Calcium carbonate, sulphate and silica start to scale the last membrane stage as soon as recovery rises, so antiscalants and antifoulants will lead in 2026 with a 35% share of chemical type sales. Dosing of scale inhibitor never stops during operation. Biocides, an estimated 24%, go in as shock or intermittent doses against biofilm, and plants on clean well water use few of them. pH adjusters, about 17%, are bulk acids and caustic with a low price per tonne. Dechlorinants, near 14%, are needed only after upstream chlorination, mostly as sodium bisulphite on municipal and seawater feeds. Other chemistries, roughly 10%, cover cleaners and preservatives used at shutdowns. Wastewater operators are also adding fouling control upstream, and a 9.1% CAGR from 2026 to 2036 is forecast for the anti-fouling chemicals for membrane bioreactors market. Ecolab's 29% organic growth in Global High-Tech in Q2 2026 came from microelectronics and data centers.[2] Plant operators will treat antiscalant as the one chemical with no off switch.
- Phosphonate, polyacrylate and phosphorus-free polymer blends make up most antiscalant volume.
- Alma Watech commissioned a blowdown recycling plant for EEW at Helmstedt in January 2026, with reverse osmosis tailored to the cooling tower additives.[8]
Why do industrial users lead membrane chemicals sales by end use?
Industrial users are projected to lead end use sales with an estimated 40% share in 2026, ahead of waste water treatment at 25%, municipal plants at about 23% and other users near 12%.
Table 5: End Use Share for the Membrane Chemicals Market (percentage share), 2026
| End Use | Estimated Share (2026) |
|---|---|
| Industrial | 40% |
| Waste Water Treatment | 25% |
| Municipal | 23% |
| Others | 12% |
| Total | 100.0% |
Boiler feed, process water and ultrapure water lines run at high recovery and protect costly output, so industrial users are predicted to lead with an estimated 40% of 2026 end use sales and pay for premium chemistry. Waste water treatment, at 25%, covers reuse and zero liquid discharge plants, and fouling there is heavy across a smaller number of large sites. Municipal plants, an estimated 23%, buy through big tenders for drinking water and seawater supply, and price decides most awards. Utility treatment budgets move slowly, and a 4.6% CAGR is projected for the water and wastewater treatment chemicals market, so municipal chemistry will lose ground to industrial programmes. Other users, near 12%, are hospitals, hotels and commercial buildings with small skids. Kemira described demand in urban water as stable in Q2 2026 and reported lower demand in industrial water.[1] Hardware orders move with the chemistry, and a 6.4% CAGR for the membrane filtration market keeps system and chemical demand in step. Factory water managers will keep choosing service-backed programmes, and municipal buyers will keep choosing on price.
- Boiler feed, cooling tower blowdown, process water and ultrapure water make up the industrial base.
- EEW now returns treated blowdown to the cooling circuit at Helmstedt through ultrafiltration and reverse osmosis, Alma Watech said on 18 January 2026.[8]
What are the drivers, restraints, and opportunities in the membrane chemicals market?
Water scarcity and reuse targets keep adding reverse osmosis trains that need chemical programmes for life. Price pressure on commodity grades and softer factory output squeeze suppliers, and phosphorus-free chemistry for reuse plants opens new contracts.
- Driver: Utilities and factories short of fresh water are turning to seawater, brackish water and treated effluent, and each of these feeds needs scale and fouling control at every membrane stage.
- Restraint: Large municipal tenders buy antiscalant on price, and cost inflation in phosphonates and polymers is hard to pass on inside fixed-term supply contracts.
- Opportunity: Reuse and zero liquid discharge plants want phosphorus-free antiscalants and monitored cleaning, which favours suppliers with field service and laboratory support.
Water Scarcity Adds New Membrane Trains
Adoption of membrane treatment grows with every region that runs short of fresh water, and each plant becomes a long-term chemical account. China's daily seawater desalination capacity has surpassed 3 million tonnes, enough for the residential needs of 15 million people, according to the Ministry of Natural Resources.[3] Anglian Water is planning two seawater plants with pretreatment, reverse osmosis and remineralisation to meet a forecast shortfall of 593 Ml per day by 2050.[6] Every such plant will dose antiscalant and dechlorinant from the first day of operation.
Cost Inflation Squeezes Commodity Grades
Margins on commodity membrane chemistry are thin, as municipal tenders fix prices for several years. Kemira's operative EBITDA margin in Water Solutions fell to 17.4% from 22.9% in Q2 2026.[1] Veolia's Water Technologies revenue was 4.8% lower in the first half of 2026, and 0.6% higher excluding projects.[7] FMI expects price competition to stay sharpest in pH adjusters and dechlorinants, which buyers treat as bulk commodities.
Reuse and Electronics Water Open Service Contracts
Sites that pay for chemistry protecting output will supply most new growth of the membrane chemicals market. Ecolab counted a 6% benefit from the Ovivo Electronics acquisition in Global Water fixed currency growth in Q2 2026.[2] Alma Watech's Helmstedt plant turns cooling tower blowdown into process water for EEW.[8] Remote fouling monitoring and phosphorus-free antiscalants will decide supplier choice at these sites.
Which country CAGRs are profiled in the membrane chemicals market?
Table 6: Country CAGR Comparison for the Membrane Chemicals Market (CAGR percentage), 2026 to 2036
| Country | CAGR (2026 to 2036) |
|---|---|
| China | 8.2% |
| India | 7.6% |
| Germany | 7% |
| Brazil | 6.4% |
| United States | 5.8% |
| United Kingdom | 5.2% |
How do country-level CAGRs compare in the membrane chemicals market?
Coastal provinces in China are pairing seawater desalination with industrial parks, and a single project in the Tianjin Nangang Industrial Zone is rated at 150,000 tonnes per day.[3] FMI's forecast puts China at 8.2%, the quickest pace in the country table. India follows on 7.6%, 1.5 points over the market rate of 6.1%, as Chennai adds municipal desalination. Industrial reuse keeps Germany at 7%, and Brazil is close to the average at 6.4%. American utilities mostly re-dose an existing fleet, which holds the United States to 5.8%. Seawater plants in eastern England are still in design, and the United Kingdom is projected at 5.2%.
- Seawater plants at coastal industrial parks carry demand in China.
- Chennai desalination expansion leads new municipal orders in India.
- In Germany, waste-to-energy and power sites are recycling cooling tower blowdown.
- Fortaleza moves the Brazilian northeast toward large seawater plants.
- PFAS limits on drinking water keep American utilities reviewing treatment trains.
- Anglian Water plans the first North Sea desalination plants for eastern England.
Full report country CAGRs cover: China at the top on 8.2%, India and Germany next, Brazil just above the 6.1% global CAGR, the United States and the United Kingdom below the global figure, and every other standard country by region.
Country-wise Analysis
China Membrane Chemicals Market Outlook (2026 to 2036)
Daily seawater desalination capacity in China has passed 3 million tonnes, the Ministry of Natural Resources said in June 2026, and the Tianjin project runs a fully domestic production line able to produce 30,000 tonnes of desalinated water per day.[3] Industrial zones such as Nangang in Tianjin and the Cangzhou integrated project host several of these units, so antiscalant and cleaning chemicals move in bulk volumes. FMI projects an 8.2% CAGR for China, with local blenders competing hard on price against global groups.
Key takeaway: Industrial park desalination gives China the top rate on the list.
India Membrane Chemicals Market Outlook (2026 to 2036)
Desalination tenders in Chennai and boiler feed projects at refineries point to a 7.6% CAGR for India. Chennai Metro Water operates 360 MLD of desalination, and a new 400 MLD plant at Minjur plus the Perur plant near Nemmeli would take city capacity to 1,160 MLD, DT Next reported.[4] Thermal power stations add further reverse osmosis units for boiler make-up water.
Key takeaway: Municipal desalination and boiler feed water carry growth in India.
Germany Membrane Chemicals Market Outlook (2026 to 2036)
EEW Energy from Waste now recycles cooling tower blowdown at Helmstedt through ultrafiltration and reverse osmosis, one of the first such plants at a German thermal power station, Alma Watech said in January 2026.[8] Each reuse plant of this kind adds a cleaning and antiscalant programme. A 7% CAGR, in FMI's outlook, keeps Germany 0.9 points ahead of the global rate.
Key takeaway: Industrial water reuse at power and waste-to-energy sites sets the pace in Germany.
Brazil Membrane Chemicals Market Outlook (2026 to 2036)
Fortaleza is preparing a large seawater plant, and construction of the 1,000 litre per second reverse osmosis unit was due to begin within 60 days of the July 2026 report in O Povo, with operation expected in the second half of 2028.[5] Utilities in the dry northeast will follow with brackish and seawater projects. A 6.4% rate is likely for Brazil, near the global figure, as new plants add to a small installed base.
Key takeaway: The Fortaleza plant opens the first large seawater account in Brazil.
United States Membrane Chemicals Market Outlook (2026 to 2036)
EPA said on 14 May 2025 that the agency would keep the PFOA and PFOS drinking water limits and propose moving the compliance date from 2029 to 2031.[9] Membrane treatment is one of the options utilities will weigh for those limits. Kemira bought the business and assets of Clear Water Technologies in the US during Q2 2026.[1] Most growth comes from replacing chemistry on a large installed fleet, so the United States is forecast at 5.8%, 0.3 points behind the global rate for membrane chemicals.
Key takeaway: Replacement chemistry on existing plants decides the American pace.
United Kingdom Membrane Chemicals Market Outlook (2026 to 2036)
Anglian Water named a TYPSA and Stantec joint venture as primary technical partner for planned seawater plants in Lincolnshire and Norfolk in February 2026, and a second team of RSK and GHD, supported by Veolia, as secondary partner.[6] Those plants are still in design, so near-term orders come from existing reuse and industrial units. FMI sees the United Kingdom closing the table at 5.2%.
Key takeaway: New seawater plants are a later-decade boost for the United Kingdom.
Who are the notable companies in the membrane chemicals market?
Ecolab, Kemira, Veolia, Kurita Water Industries, BWA Water Additives, Genesys International, King Lee Technologies and Lenntech are the profiled companies.
The profiled companies in FMI's coverage range from water treatment groups with field service teams to specialist formulators that sell through membrane system builders. Net sales of USD 4,415.4 million, 10% higher, came from Ecolab in Q2 2026.[2] Kemira held quarterly revenue at EUR 693.0 million, mainly on acquisitions.[1] For Veolia, Water Technologies brought in EUR 2,213 million over January to June 2026.[7] Kurita Water Industries, BWA Water Additives, Genesys International, King Lee Technologies and Lenntech complete the group.
- Water treatment groups: Ecolab, Kemira, Veolia and Kurita Water Industries.
- Membrane chemical specialists: BWA Water Additives, Genesys International and King Lee Technologies.
- Distributors and system suppliers: Lenntech.
Competitive Benchmarking: Membrane Chemicals Market
Table 7: Competitive Benchmarking for the Membrane Chemicals Market (qualitative documentation ratings), 2026
| Company | Antiscalant Range | Field Service | Reuse and High-Tech | Recency |
|---|---|---|---|---|
| Ecolab | High | High | High | High |
| Kemira | Medium | Medium | Medium | High |
| Veolia | Medium | High | Medium | High |
| BWA Water Additives | High | Low | Medium | Medium |
| Genesys International | High | Medium | Medium | Medium |
Each rating reflects the amount of dated 2025 and 2026 company material behind that column and carries no market-share meaning.
Key Developments in the Membrane Chemicals Market
- September 2026: DT Next reported plans for a second 400 MLD desalination plant at Minjur in Chennai.[4]
- 30 July 2026: Veolia half-year results showed Water Technologies up 0.6% excluding projects.[7]
- On 28 July 2026, Ecolab said the Ovivo Electronics acquisition added 6% to Global Water fixed currency growth.[2]
- On 17 July 2026, Kemira reported the purchase of the business and assets of Clear Water Technologies in the US.[1]
- 17 July 2026: O Povo reported that building work on the Fortaleza reverse osmosis plant would start within 60 days.[5]
- In June 2026, China said daily seawater desalination capacity had surpassed 3 million tonnes.[3]
- On 16 February 2026, Anglian Water named a TYPSA and Stantec joint venture as primary desalination technical partner.[6]
- On 18 January 2026, Alma Watech announced commissioning of a blowdown recycling plant for EEW in Helmstedt.[8]
- On 14 May 2025, EPA confirmed plans to keep the PFOA and PFOS limits and propose a 2031 compliance date.[9]
Key Players in the Membrane Chemicals Market
Water Treatment Groups
- Ecolab
- Kemira
- Veolia
- Kurita Water Industries
Membrane Chemical Specialists
- BWA Water Additives
- Genesys International
- King Lee Technologies
Distributors and System Suppliers
- Lenntech
Membrane Chemicals Market - Report Scope
Table 8: Report Scope for the Membrane Chemicals Market (coverage fields and definitions), 2026 to 2036
| Coverage field | Report scope |
|---|---|
| Market breakdown | Chemical type; end use; region |
| Quantitative units | USD billion |
| Market definition | Antiscalants, antifoulants, biocides, pH adjusters, dechlorinants, cleaners and preservatives dosed into reverse osmosis, nanofiltration and other membrane systems to control scaling, fouling and oxidation damage. |
| Regions covered | North America; Latin America; Western Europe; Eastern Europe; East Asia; South Asia and Pacific; Middle East and Africa |
| Countries covered | United States; Canada; Brazil; Mexico; Argentina; Chile; Germany; France; United Kingdom; Italy; Spain; Benelux; Nordics; Poland; Czech Republic; Romania; Hungary; China; Japan; South Korea; India; ASEAN; Australia and New Zealand; GCC Countries; South Africa; Türkiye; Israel |
| Key companies profiled | Ecolab, Kemira, Veolia, Kurita Water Industries, BWA Water Additives, Genesys International, King Lee Technologies, Lenntech |
| Forecast period | 2026 to 2036 |
Membrane Chemicals Market - Research Methodology
Table 9: Research Methodology for the Membrane Chemicals Market (research methods and approach), 2026 edition
| Method | Approach |
|---|---|
| Data Sources | Water treatment company results, desalination project news, a US drinking water regulator release and trade press from May 2025 onward. |
| Desk Research | Desk research covers seawater desalination, industrial reuse, ultrapure water, chemical pricing and drinking water rules. |
| Market Sizing and Forecasting | Sizing starts from the 2026 base of USD 2.5 billion and the 6.1% CAGR for 2026 to 2036. |
| Data Validation | Capacity, sales and price figures were matched to the release or article that first carried them. |
Membrane Chemicals Market by Segments
Membrane Chemicals Market segmented by Chemical Type:
- Antiscalants and Antifoulants
- Biocides
- pH Adjusters
- Dechlorinants
- Others
Membrane Chemicals Market segmented by End Use:
- Industrial
- Waste Water Treatment
- Municipal
- Others
Membrane Chemicals Market by Region
- North America
- United States
- Canada
- Latin America
- Brazil
- Mexico
- Argentina
- Chile
- Western Europe
- Germany
- France
- United Kingdom
- Italy
- Spain
- Benelux
- Nordics
- Eastern Europe
- Poland
- Czech Republic
- Romania
- Hungary
- East Asia
- China
- Japan
- South Korea
- South Asia and Pacific
- India
- ASEAN
- Australia and New Zealand
- Middle East and Africa
- GCC Countries
- South Africa
- Türkiye
- Israel
Research Sources and Bibliography
- [1] Kemira Oyj. (2026, July 17). Kemira Oyj's half-year financial report 2026: Profitability weakened by cost inflation, performance improvement measures continue. https://news.cision.com/kemira-oyj/r/kemira-oyj-s-half-year-financial-report-2026--profitability-weakened-by-cost-inflation--performance-,c4375563
- [2] Ecolab Inc. (2026, July 28). Ecolab Delivers Accelerated Sales Growth and Double-Digit EPS Growth (Form 8-K, Exhibit 99.1). https://www.sec.gov/Archives/edgar/data/0000031462/000162828026049933/ecl_ex99x1.htm
- [3] CGTN. (2026, June 2). China's desalination tech makes strides, topping 3 million tonnes daily. https://news.cgtn.com/news/2026-06-02/China-s-desalination-tech-makes-strides-topping-3-million-tonnes-daily-1NE4nTWPHQk/share_amp.html
- [4] DT Next. (2026, September 3). New desal plant to reduce Chennai's dependence on monsoon. https://www.dtnext.in/news/chennai/new-desal-plant-to-reduce-chennais-dependence-on-monsoon
- [5] O Povo. (2026, July 17). Obras da usina de dessalinização na Praia do Futuro começam em 60 dias. https://mais.opovo.com.br/jornal/economia/2026/07/17/obras-da-usina-de-dessalinizacao-na-praia-do-futuro-comecam-em-60-dias.html
- [6] Water Magazine. (2026, February 16). Desalination plans take another step forward as Anglian awards technical contract to TYPSA and Stantec. https://www.watermagazine.co.uk/2026/02/16/desalination-plans-take-another-step-forward-as-anglian-awards-technical-contract-to-typsa-and-stantec/
- [7] Veolia. (2026, July 30). 2026 first half results. https://www.veolia.com/en/our-media/press-releases/2026-first-half-results
- [8] Alma Watech. (2026, January 18). Successful commissioning of a cooling tower blowdown water recycling plant for EEW in Germany. https://www.almawatech.com/en/plant_engineering_and_plant_optimization/erfolgreiche-inbetriebnahme-kuehlturmabschlaemmwasser-recyclinganlage-fuer-eew-in-deutschland/
- [9] U.S. Environmental Protection Agency. (2025, May 14). EPA Announces It Will Keep Maximum Contaminant Levels for PFOA, PFOS. https://www.epa.gov/newsreleases/epa-announces-it-will-keep-maximum-contaminant-levels-pfoa-pfos
This bibliography is provided for reader reference. The full report contains the complete reference list and detailed citations.
This Report Answers
- How big is the membrane chemicals market during 2026?
- What market size is projected by 2036?
- Which chemical type holds notable share?
- Which end use holds notable share?
- Which countries have notable growth?
- Which companies are notable in the market?
Frequently Asked Questions
How large is the membrane chemicals market expected in 2026?
In FMI's base case, the membrane chemicals market is estimated at USD 2.5 billion in 2026, against USD 2.4 billion in 2025. Sales of membrane chemicals are projected to reach USD 4.6 billion by 2036.
What CAGR is projected for the membrane chemicals market through 2036?
A 6.1% CAGR from 2026 to 2036 is expected for the membrane chemicals market. New desalination, reuse and ultrapure water trains, each needing a dosing programme for life, carry that growth.
Which chemical type holds a notable market share in 2026?
Antiscalants and antifoulants are expected to lead with 35% share in 2026. Biocides follow at an estimated 24%.
Which end use holds a notable market share in 2026?
Industrial users are likely to lead with an estimated 40% share. Waste water treatment follows at 25%.
Which country has a notable expansion outlook through 2036?
China is projected to grow at 8.2%, the highest rate in FMI's country table. India follows at 7.6%.
Who are the key companies in the membrane chemicals market?
Ecolab, Kemira, Veolia and Kurita Water Industries form the water treatment group. BWA Water Additives, Genesys International, King Lee Technologies and Lenntech complete the profiled companies.
Preview the report firsthand - request a free sample
Get SampleGet the brochure for pricing and purchase details.
Get PDFTable of Content
- Key Takeaways
- Market Size and CAGR
- Top Growth Driver
- Fastest Growing Segment
- Leading Region
- Key Companies
- Emerging Opportunities
- Executive Summary
- Global Market Outlook
- Demand-side Trends
- Supply-side Trends
- Technology Roadmap Analysis
- Analysis and Recommendations
- Analyst Perspective (What is happening? Why now? What should investors know?)
- Key Questions Answered
- How large is the market?
- What is the CAGR?
- What are key trends?
- Which region dominates?
- Who are the leaders?
- Market Overview
- Market Coverage / Taxonomy
- Market Definition / Scope / Limitations
- Research Methodology
- Chapter Orientation
- Analytical Lens and Working Hypotheses
- Market Structure, Signals, and Trend Drivers
- Benchmarking and Cross-market Comparability
- Market Sizing, Forecasting, and Opportunity Mapping
- Research Design and Evidence Framework
- Desk Research Programme (Secondary Evidence)
- Expert Input and Fieldwork (Primary Evidence)
- Tooling, Models, and Reference Databases
- Data Engineering and Model Build
- Quality Assurance and Audit Trail
- Market Background
- Market Dynamics (Drivers, Restraints, Opportunity, Trends)
- Scenario Forecast (Optimistic, Likely, Conservative)
- Impact Analysis
- AI Impact
- Sustainability Impact
- Regulatory Impact
- Technology Impact
- Consumer / Buyer Analysis
- Purchase Drivers
- Adoption Barriers
- Buyer Journey
- Opportunity Map Analysis
- Product Life Cycle Analysis
- Supply Chain Analysis
- Investment Feasibility Matrix
- Value Chain Analysis
- PESTLE and Porter's Analysis
- Regulatory Landscape
- Regional Parent Market Outlook
- Production and Consumption Statistics
- Import and Export Statistics
- Global Market Analysis and Forecast, 2021 to 2036
- Historical Market Size Value (USD Billion) Analysis, 2021 to 2025
- Current and Future Market Size Value (USD Billion) Projections, 2026 to 2036
- Y-o-Y Growth Trend Analysis
- Absolute $ Opportunity Analysis
- Global Market Pricing Analysis, 2021 to 2036
- Global Market Analysis and Forecast, By Chemical Type, 2021 to 2036
- Introduction / Key Findings
- Historical Market Size Value (USD Billion) Analysis By Chemical Type, 2021 to 2025
- Current and Future Market Size Value (USD Billion) Analysis and Forecast By Chemical Type, 2026 to 2036
- Antiscalants and Antifoulants
- Biocides
- pH Adjusters
- Dechlorinants
- Others
- Y-o-Y Growth Trend Analysis By Chemical Type, 2021 to 2025
- Absolute $ Opportunity Analysis By Chemical Type, 2026 to 2036
- Global Market Analysis and Forecast, By End Use, 2021 to 2036
- Introduction / Key Findings
- Historical Market Size Value (USD Billion) Analysis By End Use, 2021 to 2025
- Current and Future Market Size Value (USD Billion) Analysis and Forecast By End Use, 2026 to 2036
- Industrial
- Waste Water Treatment
- Municipal
- Others
- Y-o-Y Growth Trend Analysis By End Use, 2021 to 2025
- Absolute $ Opportunity Analysis By End Use, 2026 to 2036
- Global Market Analysis and Forecast, By Region, 2021 to 2036
- Introduction
- Historical Market Size Value (USD Billion) Analysis By Region, 2021 to 2025
- Current Market Size Value (USD Billion) Analysis and Forecast By Region, 2026 to 2036
- North America
- Latin America
- Western Europe
- Eastern Europe
- East Asia
- South Asia and Pacific
- Middle East and Africa
- Market Attractiveness Analysis By Region
- North America Market Analysis and Forecast, By Country, 2021 to 2036
- Historical Market Size Value (USD Billion) Trend Analysis By Market Taxonomy, 2021 to 2025
- Market Size Value (USD Billion) Forecast By Market Taxonomy, 2026 to 2036
- By Country
- United States
- Canada
- By Chemical Type
- By End Use
- By Country
- Market Attractiveness Analysis
- By Country
- By Chemical Type
- By End Use
- Key Takeaways
- Latin America Market Analysis and Forecast, By Country
- Historical Market Size Value (USD Billion) Trend Analysis By Market Taxonomy, 2021 to 2025
- Market Size Value (USD Billion) Forecast By Market Taxonomy, 2026 to 2036
- By Country
- Brazil
- Mexico
- Argentina
- Chile
- By Chemical Type
- By End Use
- By Country
- Market Attractiveness Analysis
- By Country
- By Chemical Type
- By End Use
- Key Takeaways
- Western Europe Market Analysis and Forecast, By Country
- Historical Market Size Value (USD Billion) Trend Analysis By Market Taxonomy, 2021 to 2025
- Market Size Value (USD Billion) Forecast By Market Taxonomy, 2026 to 2036
- By Country
- Germany
- France
- United Kingdom
- Italy
- Spain
- Benelux
- Nordics
- By Chemical Type
- By End Use
- By Country
- Market Attractiveness Analysis
- By Country
- By Chemical Type
- By End Use
- Key Takeaways
- Eastern Europe Market Analysis and Forecast, By Country
- Historical Market Size Value (USD Billion) Trend Analysis By Market Taxonomy, 2021 to 2025
- Market Size Value (USD Billion) Forecast By Market Taxonomy, 2026 to 2036
- By Country
- Poland
- Czech Republic
- Romania
- Hungary
- By Chemical Type
- By End Use
- By Country
- Market Attractiveness Analysis
- By Country
- By Chemical Type
- By End Use
- Key Takeaways
- East Asia Market Analysis and Forecast, By Country
- Historical Market Size Value (USD Billion) Trend Analysis By Market Taxonomy, 2021 to 2025
- Market Size Value (USD Billion) Forecast By Market Taxonomy, 2026 to 2036
- By Country
- China
- Japan
- South Korea
- By Chemical Type
- By End Use
- By Country
- Market Attractiveness Analysis
- By Country
- By Chemical Type
- By End Use
- Key Takeaways
- South Asia and Pacific Market Analysis and Forecast, By Country
- Historical Market Size Value (USD Billion) Trend Analysis By Market Taxonomy, 2021 to 2025
- Market Size Value (USD Billion) Forecast By Market Taxonomy, 2026 to 2036
- By Country
- India
- ASEAN
- Australia and New Zealand
- By Chemical Type
- By End Use
- By Country
- Market Attractiveness Analysis
- By Country
- By Chemical Type
- By End Use
- Key Takeaways
- Middle East and Africa Market Analysis and Forecast, By Country
- Historical Market Size Value (USD Billion) Trend Analysis By Market Taxonomy, 2021 to 2025
- Market Size Value (USD Billion) Forecast By Market Taxonomy, 2026 to 2036
- By Country
- GCC Countries
- South Africa
- Türkiye
- Israel
- By Chemical Type
- By End Use
- By Country
- Market Attractiveness Analysis
- By Country
- By Chemical Type
- By End Use
- Key Takeaways
- Key Countries Market Analysis
- United States
- Pricing Analysis
- Market Share Analysis, 2025
- By Chemical Type
- By End Use
- Canada
- Pricing Analysis
- Market Share Analysis, 2025
- By Chemical Type
- By End Use
- Mexico
- Pricing Analysis
- Market Share Analysis, 2025
- By Chemical Type
- By End Use
- Brazil
- Pricing Analysis
- Market Share Analysis, 2025
- By Chemical Type
- By End Use
- Chile
- Pricing Analysis
- Market Share Analysis, 2025
- By Chemical Type
- By End Use
- Germany
- Pricing Analysis
- Market Share Analysis, 2025
- By Chemical Type
- By End Use
- United Kingdom
- Pricing Analysis
- Market Share Analysis, 2025
- By Chemical Type
- By End Use
- Italy
- Pricing Analysis
- Market Share Analysis, 2025
- By Chemical Type
- By End Use
- Spain
- Pricing Analysis
- Market Share Analysis, 2025
- By Chemical Type
- By End Use
- France
- Pricing Analysis
- Market Share Analysis, 2025
- By Chemical Type
- By End Use
- India
- Pricing Analysis
- Market Share Analysis, 2025
- By Chemical Type
- By End Use
- ASEAN
- Pricing Analysis
- Market Share Analysis, 2025
- By Chemical Type
- By End Use
- Australia and New Zealand
- Pricing Analysis
- Market Share Analysis, 2025
- By Chemical Type
- By End Use
- China
- Pricing Analysis
- Market Share Analysis, 2025
- By Chemical Type
- By End Use
- Japan
- Pricing Analysis
- Market Share Analysis, 2025
- By Chemical Type
- By End Use
- South Korea
- Pricing Analysis
- Market Share Analysis, 2025
- By Chemical Type
- By End Use
- Poland
- Pricing Analysis
- Market Share Analysis, 2025
- By Chemical Type
- By End Use
- Hungary
- Pricing Analysis
- Market Share Analysis, 2025
- By Chemical Type
- By End Use
- Türkiye
- Pricing Analysis
- Market Share Analysis, 2025
- By Chemical Type
- By End Use
- South Africa
- Pricing Analysis
- Market Share Analysis, 2025
- By Chemical Type
- By End Use
- United States
- Market Structure Analysis
- Competition Dashboard
- Competition Benchmarking
- Market Share Analysis of Top Players
- By Regional
- By Chemical Type
- By End Use
- Emerging Startups
- Innovation Benchmarking
- Competition Analysis
- Competition Deep Dive
- Ecolab
- Overview
- Product Portfolio
- Profitability by Market Segments
- Sales Footprint
- Strategy Overview
- Marketing Strategy
- Product Strategy
- Channel Strategy
- Kemira
- Veolia
- BWA Water Additives
- Genesys International
- Kurita Water Industries
- King Lee Technologies
- Lenntech
- Ecolab
- Case Studies
- Success Stories
- Recent Developments
- Competition Deep Dive
- Assumptions & Acronyms Used


