

- Market Size (2026)
- USD 382.4 Mn
- Forecast (2036)
- USD 1405.3 Mn
- CAGR (2026 to 2036)
- 13.9%
How big is Mixed-Density Data Center Cooling Control Software Market in 2026?
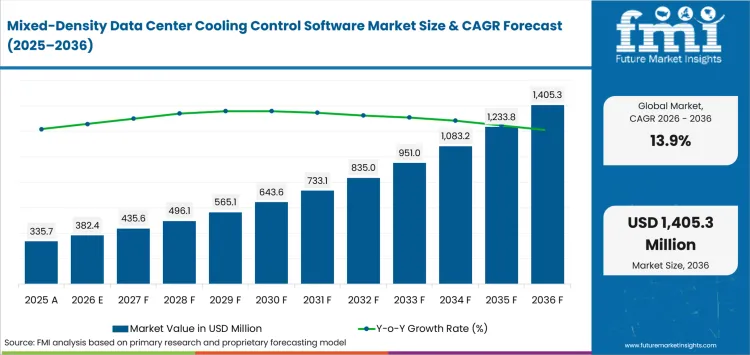
USD 382.4 million in 2026 and USD 1,405.3 million by 2036 at a 13.9% CAGR.
Demand for mixed-density data center cooling control software is projected to expand at 13.9% CAGR between 2026 and 2036, increasing valuation from USD 382.4 million in 2026 to USD 1405.3 million by 2036. AI and HPC deployments are placing high-density liquid-cooled racks inside facilities that still retain air-cooled capacity, creating a need to coordinate thermal conditions from the rack to plant-side cooling equipment.
The International Energy Agency reported in 2025 that data centers consumed about 415 TWh of electricity worldwide in 2024 and could reach around 945 TWh by 2030 in its base case. Cooling accounts for about 7% of electricity use in efficient hyperscale facilities and more than 30% in less-efficient enterprise data centers. As accelerated servers increase power density, operators have a financial reason to expose cooling headroom before adding equipment or accepting another high-density compute block.
Key Takeaways of Mixed-Density Data Center Cooling Control Software Market
- Mixed-density facilities need one operational view of air cooling and liquid loops before software can influence setpoints safely.
- Optimization & control is projected at 29.0% share of Software Function in 2026 because telemetry has more value when it changes an operating decision.
- Dry coolers are estimated at 29.0% of Heat Rejection / Secondary Loop demand in 2026 as warmer liquid loops increase the usefulness of economized heat rejection.
- The 251-500 kW rack-density band is forecast at 34.0%, while Hyperscale AI is expected at 48.0% by Data Center Type.
- Cooling OEM direct is projected at 36.0% of Route to Market, reflecting the role of equipment telemetry and commissioning responsibility in control deployment.
- Daikin Applied, Schneider Electric, LG Electronics and EkkoSense participate through cooling equipment integration or software-led thermal optimization.
Analyst Perspective
"Cooling-control software becomes commercially useful when it can show operators how rack conditions affect secondary loops and plant capacity before a setpoint is changed. Buyers should test protocol coverage and fallback behavior during commissioning, then measure whether the platform recovers usable capacity or reduces unnecessary cooling effort."
- Sudip Saha, Principal Consultant, Future Market Insights
How is the Mixed-Density Data Center Cooling Control Software Market segmented?
The market is segmented by Software Function, Heat Rejection / Secondary Loop, Rack Density, Data Center Type, Route to Market and Region.
Mixed-density data center cooling control software is segmented across five operating and commercial axes. Software Function separates monitoring from simulation and active control. Heat Rejection / Secondary Loop identifies the plant-side environment that software must coordinate, while Rack Density captures changes in thermal duty as compute concentration rises. Data Center Type reflects different standardization and risk profiles, and Route to Market identifies who owns the commercial relationship plus commissioning. Unlike the broader DCIM market, this category is defined by software that monitors, simulates, optimizes or controls cooling across mixed-density environments.
Why does optimization & control lead the software function category?
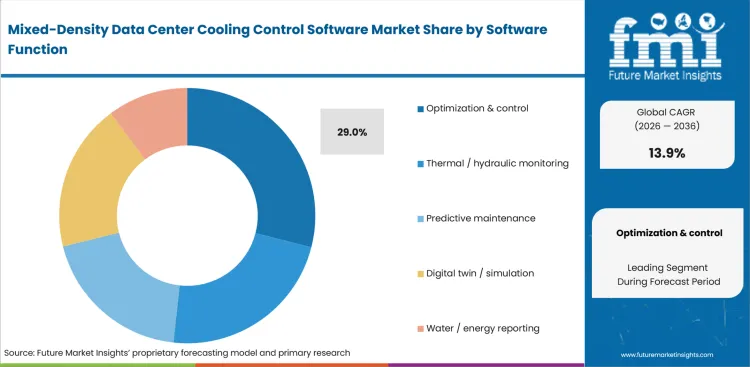
Optimization & control sits closest to the operating decision that creates value. Air-cooled rows and liquid-cooled AI racks can share power capacity and plant infrastructure while reacting differently to workload changes. Monitoring identifies a deviation, but control software can recommend or execute changes to airflow, coolant supply or equipment staging. Buyers therefore focus on whether algorithms preserve thermal margin while reducing cooling effort. Transparent override and fallback behavior remain necessary before operators permit automated intervention.
- Based on Software Function, Optimization & control is projected to account for 29.0% in 2026 because it converts cooling telemetry into decisions that can affect capacity utilization and energy use.
- EkkoSense launched EkkoSoft Critical 9.0 in May 2025 with support for optimizing hybrid liquid and air cooling within the same room, showing how thermal software is moving beyond visibility toward operational optimization.
Why do dry coolers lead the heat rejection / secondary loop category?
Dry coolers fit facilities that can reject heat without evaporative consumption at the rejection stage, especially when warmer liquid loops increase the number of hours suited to ambient heat rejection. Mixed-density plants still need coordinated staging because liquid loops and legacy air cooling respond differently to IT load. In hybrid designs, software may stage dry cooling against data center chillers as outdoor conditions change, while preserving approach temperature and redundancy.
- Dry coolers are forecast to hold 29.0% share in 2026 because water-lean heat rejection can pair with warmer secondary loops and software-controlled economizer strategies.
- EkkoSense has described hybrid cooling management that keeps air and liquid environments visible within the same operating model, reinforcing the need for plant-side coordination as facilities add liquid-cooled compute.
Why does the 251-500 kW band lead the rack density category?
The 251-500 kW band combines high thermal duty with a deployment scale that can be repeated across several halls. Direct-to-chip systems and centralized coolant distribution become difficult to manage as isolated equipment at this level. Transient load changes can move through cold plates and CDUs into chilled-water or secondary loops, so operators need software that can identify interactions before a physical change is made. This density band therefore creates a practical use case for rack-to-plant orchestration and simulation during commissioning.
- The 251-500 kW band is expected to account for 34.0% of Rack Density demand in 2026 because hundreds-of-kilowatts cooling circuits require structured control and repeatable commissioning.
- LG Electronics reported NVIDIA validation for its 600kW coolant distribution unit in July 2026 and paired the system with Data Center Cooling Control Manager for predictive control plus centralized monitoring through standard communication protocols.
Why does hyperscale AI lead the data center type category?
Hyperscale AI facilities concentrate accelerated servers that create steep and variable thermal loads. Operators also need repeatable designs so each new hall enters service with usable compute capacity without a long tuning cycle. Cooling-control software supports that requirement by validating operating envelopes before deployment and standardizing how alarms or capacity margins are handled across sites. These facilities increasingly depend on liquid cooling where rack-scale systems exceed practical air-cooling limits, which increases the need to coordinate CDU behavior with plant-side systems.
- Hyperscale AI is projected to account for 48.0% of Data Center Type demand in 2026 because concentrated GPU density and repeatable site design support standardized thermal orchestration.
- Schneider Electric announced a Vera Rubin reference design with NVIDIA in March 2026 that validates power and cooling for rack-scale AI systems and connects the design process with digital-twin capabilities for large AI facilities.
Why does Cooling OEM direct lead the Route to Market category?
Cooling OEM direct has an advantage when control logic is tightly coupled to equipment behavior. Chillers and CDUs expose operating data that a third party may struggle to normalize without engineering support, while OEMs already participate in commissioning and service. This creates a natural path for software to arrive as part of a wider cooling management system. MEP or EPC integrators remain relevant when several vendors must be coordinated, and retrofit channels matter where operators want a neutral software layer without replacing installed equipment.
- Cooling OEM direct is likely to account for 36.0% of Route to Market demand in 2026 because equipment vendors can combine controls with proprietary telemetry and commissioning responsibility.
- Daikin Applied acquired Chilldyne in November 2025 and added negative-pressure direct-to-chip liquid cooling to its data-center portfolio, strengthening the connection between physical cooling systems and OEM-led operating integration.
What are the drivers, restraints and opportunities in the Mixed-Density Data Center Cooling Control Software Market?
AI/HPC density increases the need for coordinated cooling control, while integration and commissioning risk slow closed-loop automation. Vendor-agnostic digital twins create a retrofit path by connecting existing telemetry with rack-to-plant operating decisions.
- Driver: AI/HPC density is forcing operators to coordinate air cooling with liquid loops and plant-side equipment as one operating system.
- Restraint: Legacy protocols and fail-safe commissioning make cross-vendor closed-loop control difficult to qualify.
- Opportunity: Vendor-agnostic digital twins can turn existing thermal telemetry into auditable energy or capacity gains without replacing the installed cooling estate.
AI changes the cooling-control problem because accelerated servers raise load density and increase the speed at which thermal conditions can change. The IEA reported that electricity consumption from accelerated servers is projected to grow 30% annually in its base case through 2030, compared with slower growth for conventional servers. That shift increases the number of liquid-cooling circuits inside facilities that still retain air-cooled loads. The commercial driver is the need to keep high-value compute inside a stable thermal envelope while using constrained cooling capacity efficiently.
Integration friction appears before an operator grants software authority over control loops. Existing facilities often combine BMS or DCIM platforms with equipment from several cooling vendors, leaving protocol mappings and sensor quality uneven across the site. A platform must prove what happens when data is missing or a network path fails. This extends qualification and can keep deployments in advisory mode until change-control procedures are accepted. Open interfaces and documented fallback logic therefore influence purchasing as much as the optimization algorithm itself.
The retrofit opportunity is a neutral control layer that links simulation with live white-space conditions and hydraulic data. EkkoSense has expanded hybrid air and liquid cooling optimization, while Schneider Electric has described lifecycle digital twins for thermal dynamics and controls in AI facilities. A buyer can use that approach to model the installed estate before allowing automation. Software gains commercial value when assumptions are visible, operating headroom is quantified and operator override remains available.
Which country CAGRs are assessed in the Mixed-Density Data Center Cooling Control Software Market?
| Country | CAGR |
|---|---|
| South Korea | 15.1% |
| France | 14.8% |
| UAE | 14.5% |
| Japan | 14.2% |
| Germany | 13.8% |
| USA | 13.5% |
How do country-level CAGRs compare in the Mixed-Density Data Center Cooling Control Software Market?
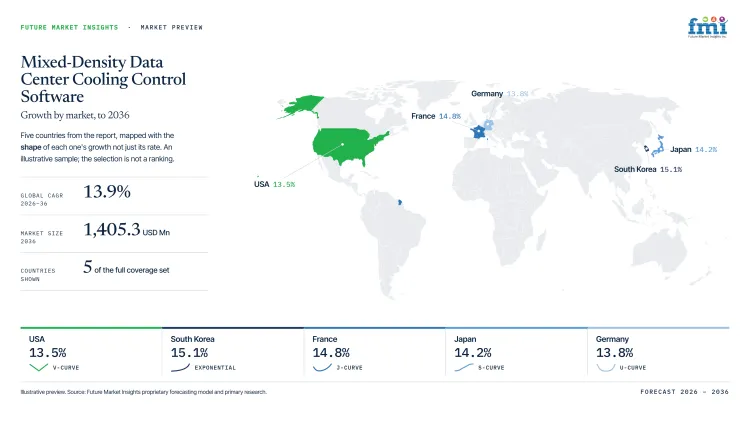
The six assessed country CAGRs span 1.6 percentage points from 2026 to 2036. South Korea and France sit above the other four at 15.1% and 14.8%. UAE is set at 14.5%, followed by Japan at 14.2%. Germany and USA are projected at 13.8% and 13.5%. The narrow range means commercial entry depends more on regulation, project concentration and channel access than on CAGR ranking alone.
- South Korea is 0.3 percentage points above France. Government support for AI computing infrastructure can bring cooling-control requirements into greenfield project design earlier.
- France is 0.3 percentage points above UAE. French opportunities are tied to grid-aware engineering, while UAE demand is concentrated around planned AI infrastructure with high thermal duty.
- UAE is 0.3 percentage points above Japan. Greenfield design-in can shorten some integration steps, while Japanese projects place more emphasis on coordination with power and communications infrastructure.
- Japan is 0.4 percentage points above Germany. Both markets reward predictable controls, though Germany adds explicit energy-efficiency obligations for covered data centers.
- Germany is 0.3 percentage points above USA. German compliance requirements can make auditable cooling performance a purchase trigger, while USA buyers often tie software decisions to capacity constraints and electricity availability.
CAGR measures the pace of expansion rather than the starting size of a national market. Supplier planning should combine growth rate with the project pipeline and commissioning requirements, then account for how procurement is structured in each country. The full report extends the comparison across North America, Latin America, Western Europe, Eastern Europe, East Asia, South Asia and Pacific, and the Middle East and Africa.
Country-wise Analysis
- USA data-center operators often evaluate cooling-control software against uptime risk and the cost of incremental capacity. Demand in the USA is forecast to expand at 13.5% CAGR from 2026 to 2036. The USA Department of Energy reported in December 2024 that data centers consumed about 4.4% of national electricity in 2023 and could use 6.7% to 12.0% by 2028. Grid constraints increase the value of efficiency but can also slow new capacity. Suppliers need quantified capacity gains and a commissioning path that protects operational resilience.
- Germany is expected to grow at 13.8% CAGR through 2036 as cooling performance becomes part of a wider efficiency and heat-reuse framework. Germany's Energy Efficiency Act sets PUE requirements for data centers and establishes energy-reuse thresholds for facilities entering operation from July 2026, with tighter reuse requirements for later commissioning dates. Buyers therefore need traceable measurement and control logic that can support regulated operating targets without obscuring operator accountability.
- France is likely to expand at 14.8% CAGR during the forecast period as data-center growth is increasingly coordinated with transmission-system requirements. RTE reported in June 2025 that more than 6 GW of data-center connections had already been committed to the French transmission network. Its DCFLEX work with Data4 and Schneider Electric includes common protocols plus digital twins for system-response testing. Cooling-control suppliers need simulation and event logging that can coexist with facility resilience rules.
- South Korea is set to grow at 15.1% CAGR from 2026 to 2036 as national AI infrastructure expands. The Ministry of Science and ICT said in February 2025 that the government aimed to secure 18,000 advanced GPUs by the first half of 2026 and would support private AI data-center investment through measures covering electricity supply and site allocation. New-build projects create opportunities to specify cooling controls during design, but suppliers still need MEP integration and commissioning support.
- Japan is anticipated to advance at 14.2% CAGR through 2036 as data-center planning becomes more closely tied to power and communications availability. METI published Report 1.0 of the Public-Private Advisory Council on Watt-Bit Collaboration in June 2025 to address coordinated development of data centers with electricity and communications infrastructure as AI use expands. Suppliers need reliable controls that support staged capacity growth without creating a separate operating layer.
- UAE is projected to expand at 14.5% CAGR over the assessment period as planned AI campuses create high thermal-rejection requirements. Abu Dhabi Media Office announced Stargate UAE in May 2025 within a planned 5-gigawatt UAE-US AI campus, while DEWA highlighted Moro Hub's solar-powered green data center in January 2025. Greenfield projects allow cooling-control requirements to be designed into the infrastructure earlier, increasing the value of plant-to-rack optimization and energy reporting.
Who are the notable companies in the Mixed-Density Data Center Cooling Control Software Market?
Daikin Applied, Schneider Electric, LG Electronics and EkkoSense are the notable companies serving the mixed-density data center cooling control software market.
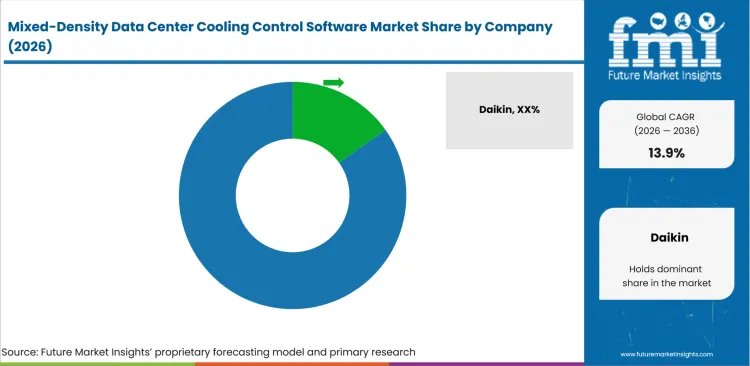
Competition depends on how far each supplier can connect cooling equipment with an operational software layer. Schneider Electric and LG Electronics combine digital controls with wider data-center infrastructure or thermal-management portfolios. Daikin Applied approaches the market from the cooling-OEM side, where equipment knowledge and service access can support deeper control integration. EkkoSense is software native and emphasizes vendor-neutral thermal analytics across existing estates. These positions create different customer entry points for new builds and retrofits.
- Integrated infrastructure and digital-control platforms: Schneider Electric and LG Electronics connect cooling control with wider data-center design and lifecycle workflows.
- Cooling-OEM control ecosystem: Daikin Applied combines equipment-level expertise with direct access to cooling projects and service relationships.
- Software-native thermal optimization: EkkoSense focuses on multi-vendor visibility and modelling for air-cooled or liquid-cooled environments.
Competitive Benchmarking: Mixed-Density Data Center Cooling Control Software Market
| Company | Cross-Layer Cooling Orchestration | Thermal Digital Twin & Predictive Analytics | Open Controls & Telemetry Integration | Geographic Reach |
|---|---|---|---|---|
| Daikin Applied | Medium | Unscored | High | North America and other international data-center markets |
| Schneider Electric | High | High | High | Global data-center markets |
| LG Electronics | High | Medium | High | Asia-Pacific and selected international data-center markets |
| EkkoSense | High | High | High | Americas, EMEA and Asia-Pacific partner markets |
Key Developments in the Mixed-Density Data Center Cooling Control Software Market
- In May 2025, EkkoSense launched EkkoSoft Critical 9.0 with hybrid liquid and air cooling optimization inside the same data-center room.
- In November 2025, Daikin Applied acquired Chilldyne and added negative-pressure direct-to-chip liquid cooling to its data-center portfolio.
- In March 2026, Schneider Electric announced with NVIDIA a Vera Rubin reference design covering power and cooling, alongside lifecycle digital-twin capabilities for AI facilities.
- In July 2026, LG Electronics reported NVIDIA validation for its 600kW CDU and paired the unit with Data Center Cooling Control Manager for predictive control and centralized monitoring.
Key Players in the Mixed-Density Data Center Cooling Control Software Market
Integrated Infrastructure and Digital-Control Platforms
- Schneider Electric
- LG Electronics
Cooling-OEM Control Ecosystem
- Daikin Applied
Software-Native Thermal Optimization
- EkkoSense
Mixed-Density Data Center Cooling Control Software Market - Report Scope
| Coverage field | Report scope |
|---|---|
| Market breakdown | By Software Function, Heat Rejection / Secondary Loop, Rack Density, Data Center Type, Route to Market and Region. |
| Quantitative Units | Revenue in USD million and CAGR in %. |
| Market Definition | Software licenses, SaaS subscriptions, embedded software value and related recurring fees for platforms that monitor, simulate, optimize or control data-center cooling across mixed rack densities and cooling architectures. Physical cooling equipment and unrelated facility-management software are excluded. |
| Regions Covered | North America, Latin America, Western Europe, Eastern Europe, East Asia, South Asia and Pacific, and Middle East and Africa. |
| Countries Covered | USA, Germany, France, South Korea, Japan, UAE and 25+ additional countries included in the full report. |
| Key Companies | Daikin Applied, Schneider Electric, LG Electronics and EkkoSense. |
| Forecast Period | 2026 to 2036. |
| Approach | Primary and secondary research with market triangulation. |
Mixed-Density Data Center Cooling Control Software Market - Research Methodology
| Method | Approach |
|---|---|
| Primary Research | FMI analysts gathered input from data-center owners, cooling OEMs, MEP/EPC integrators, controls specialists, procurement teams and end users. Interviews examined deployment triggers, interoperability, commissioning requirements, commercial models and renewal behavior. Respondents were also asked what evidence is required before advisory software is permitted to influence cooling setpoints. |
| Desk Research | Desk research covered government statistics, legislation, utility publications, technical literature and official company announcements. Sources were reviewed for relevance, publication date and consistency with the defined market scope. Claims about deployments or product capabilities were retained only when supported by credible public evidence. |
| Market Sizing and Forecasting | The market model combined the baseline value with software attach points, deployment volumes, pricing structures, rack-density trends and cooling-architecture adoption. Forecast assumptions considered AI/HPC deployment, cooling-system transition, regulation, energy constraints and retrofit adoption. Segment and regional estimates were reconciled before the final market total was calculated. |
| Data Validation | Estimates were checked against multiple independent indicators, including public data, company activity and findings from primary interviews. Validation also tested whether software revenue fell within the stated market boundary. Physical cooling-hardware revenue, unrelated software and overlapping activities were excluded to reduce double counting. |
Mixed-Density Data Center Cooling Control Software Market by Segments
Mixed-Density Data Center Cooling Control Software Market segmented by Software Function:
- Optimization & control
- Thermal / hydraulic monitoring
- Predictive maintenance
- Digital twin / simulation
- Water / energy reporting
Mixed-Density Data Center Cooling Control Software Market segmented by Heat Rejection / Secondary Loop:
- Dry coolers
- Chillers
- Cooling towers / evaporative
- Facility water loop / district interface
- Hybrid systems
Mixed-Density Data Center Cooling Control Software Market segmented by Rack Density:
- 251-500 kW
- 100-250 kW
- Below 100 kW
- Above 500 kW
Mixed-Density Data Center Cooling Control Software Market segmented by Data Center Type:
- Hyperscale AI
- Colocation AI
- Enterprise AI/HPC
- Research / sovereign compute
Mixed-Density Data Center Cooling Control Software Market segmented by Route to Market:
- Cooling OEM direct
- MEP / EPC integrator
- Server / rack OEM bundle
- Service & retrofit channel
Mixed-Density Data Center Cooling Control Software Market by Region:
- North America
- United States
- Canada
- Latin America
- Brazil
- Mexico
- Argentina
- Chile
- Western Europe
- Germany
- France
- United Kingdom
- Italy
- Spain
- Benelux
- Nordics
- Eastern Europe
- Poland
- Czech Republic
- Romania
- Hungary
- East Asia
- China
- Japan
- South Korea
- South Asia and Pacific
- India
- ASEAN
- Australia and New Zealand
- Middle East and Africa
- GCC Countries
- South Africa
- Türkiye
- Israel
Research Sources and Bibliography
- International Energy Agency. (2025, April 10). Energy and AI.
- USA Department of Energy. (2024, December 20). DOE Releases New Report Evaluating Increase in Electricity Demand from Data Centers.
- Federal Republic of Germany. Gesetz zur Steigerung der Energieeffizienz in Deutschland (Energieeffizienzgesetz - EnEfG), Section 11.
- RTE. (2025, June 16). Lancement du 1er démonstrateur européen dédié à l’interaction entre data centers et système électrique.
- Ministry of Science and ICT, Republic of Korea. (2025, February 20). Korea to Expand AI Computing Infrastructure to Strengthen National AI Capabilities and Achieve Global Leadership.
- Ministry of Economy, Trade and Industry, Japan. (2025, June 12). Report 1.0 of the Public-Private Advisory Council on Watt-Bit Collaboration Published.
- Abu Dhabi Media Office. (2025, May 22). Global tech alliance launches Stargate UAE.
- Dubai Electricity and Water Authority. (2025, January 28). Moro’s Green Data Center Receives Future Readiness Certification.
- EkkoSense. (2025, May 22). EkkoSoft Critical 9.0 unlocks next level data center capacity, power management and cooling optimization performance.
- Daikin Applied. (2025, November 4). Daikin Applied Expands Data Center Offering with Acquisition of Chilldyne.
- Schneider Electric. (2026, March 16). Schneider Electric teams with NVIDIA to develop validated blueprints to design, simulate, build, operate and maintain gigawatt-scale AI Factories.
- LG Electronics. (2026, July 27). LG Electronics Earns NVIDIA AI Factory Validation for Its 600kW Coolant Distribution Unit.
This bibliography is provided for reader reference and is not exhaustive. The full report contains the complete reference list and detailed citations.
This Report Answers
- How large is the Mixed-Density Data Center Cooling Control Software Market in 2026 and 2036?
- Which operating conditions support demand for mixed-density cooling control?
- Why does Optimization & control hold 29.0% of Software Function demand in 2026?
- How do Dry coolers influence software requirements across the Heat Rejection / Secondary Loop axis?
- Why does the 251-500 kW rack-density band account for 34.0% in 2026?
- How do assessed country growth rates affect commercial entry conditions?
- Which companies serve cooling-OEM and software-native thermal optimization routes?
- Which integration and commissioning issues limit closed-loop cooling automation?
Frequently Asked Questions
How big is the Mixed-Density Data Center Cooling Control Software Market in 2026?
USD 382.4 million represents the mixed-density data center cooling control software market value in 2026. Demand is expected to increase as AI and HPC facilities coordinate liquid-cooled racks with retained air-cooled capacity, taking the market toward USD 1,405.3 million by 2036.
What is the CAGR of the Mixed-Density Data Center Cooling Control Software Market from 2026 to 2036?
A 13.9% CAGR is projected for the mixed-density data center cooling control software market between 2026 and 2036. Growth depends on higher rack density and wider liquid-cooling deployment, while integration quality determines how quickly software moves from monitoring into active control.
Which Software Function segment is projected to account for 29.0% of the market?
Optimization & control is projected to account for 29.0% of Software Function demand in 2026. The segment is tied to software that turns thermal telemetry into operating decisions that can change cooling effort or expose usable capacity headroom.
How much will the Mixed-Density Data Center Cooling Control Software Market add between 2026 and 2036?
USD 1,022.9 million is expected to be added to the market between 2026 and 2036. The increase is associated with AI infrastructure build-out and the need to coordinate air cooling with liquid loops across new facilities and retrofit environments.
Which companies are active in the Mixed-Density Data Center Cooling Control Software Market?
Daikin Applied, Schneider Electric, LG Electronics and EkkoSense are active in the market. They participate through cooling-OEM integration, infrastructure control platforms or vendor-neutral thermal optimization for mixed air and liquid cooling environments.
Preview the report firsthand - request a free sample
Get SampleGet the brochure for pricing and purchase details.
Get PDFTable of Content
- Key Takeaways
- Market Size and CAGR
- Top Growth Driver
- Fastest Growing Segment
- Leading Region
- Key Companies
- Emerging Opportunities
- Executive Summary
- Global Market Outlook
- Demand-side Trends
- Supply-side Trends
- Technology Roadmap Analysis
- Analysis and Recommendations
- Analyst Perspective (What is happening? Why now? What should investors know?)
- Key Questions Answered
- How large is the market?
- What is the CAGR?
- What are key trends?
- Which region dominates?
- Who are the leaders?
- Market Overview
- Market Coverage / Taxonomy
- Market Definition / Scope / Limitations
- Research Methodology
- Chapter Orientation
- Analytical Lens and Working Hypotheses
- Market Structure, Signals, and Trend Drivers
- Benchmarking and Cross-market Comparability
- Market Sizing, Forecasting, and Opportunity Mapping
- Research Design and Evidence Framework
- Desk Research Programme (Secondary Evidence)
- Expert Input and Fieldwork (Primary Evidence)
- Tooling, Models, and Reference Databases
- Data Engineering and Model Build
- Quality Assurance and Audit Trail
- Market Background
- Market Dynamics (Drivers, Restraints, Opportunity, Trends)
- Scenario Forecast (Optimistic, Likely, Conservative)
- Impact Analysis
- AI Impact
- Sustainability Impact
- Regulatory Impact
- Technology Impact
- Consumer / Buyer Analysis
- Purchase Drivers
- Adoption Barriers
- Buyer Journey
- Opportunity Map Analysis
- Product Life Cycle Analysis
- Supply Chain Analysis
- Investment Feasibility Matrix
- Value Chain Analysis
- PESTLE and Porter's Analysis
- Regulatory Landscape
- Regional Parent Market Outlook
- Production and Consumption Statistics
- Import and Export Statistics
- Global Market Analysis and Forecast, 2021 to 2036
- Historical Market Size Value (USD Million) Analysis, 2021 to 2025
- Current and Future Market Size Value (USD Million) Projections, 2026 to 2036
- Y-o-Y Growth Trend Analysis
- Absolute $ Opportunity Analysis
- Global Market Pricing Analysis, 2021 to 2036
- Global Market Analysis and Forecast, By Software Function, 2021 to 2036
- Introduction / Key Findings
- Historical Market Size Value (USD Million) Analysis By Software Function, 2021 to 2025
- Current and Future Market Size Value (USD Million) Analysis and Forecast By Software Function, 2026 to 2036
- Optimization & control
- Thermal / hydraulic monitoring
- Predictive maintenance
- Digital twin / simulation
- Water / energy reporting
- Optimization & control
- Y-o-Y Growth Trend Analysis By Software Function, 2021 to 2025
- Absolute $ Opportunity Analysis By Software Function, 2026 to 2036
- Global Market Analysis and Forecast, By Heat Rejection / Secondary Loop, 2021 to 2036
- Introduction / Key Findings
- Historical Market Size Value (USD Million) Analysis By Heat Rejection / Secondary Loop, 2021 to 2025
- Current and Future Market Size Value (USD Million) Analysis and Forecast By Heat Rejection / Secondary Loop, 2026 to 2036
- Dry coolers
- Chillers
- Cooling towers / evaporative
- Facility water loop / district interface
- Hybrid systems
- Dry coolers
- Y-o-Y Growth Trend Analysis By Heat Rejection / Secondary Loop, 2021 to 2025
- Absolute $ Opportunity Analysis By Heat Rejection / Secondary Loop, 2026 to 2036
- Global Market Analysis and Forecast, By Rack Density, 2021 to 2036
- Introduction / Key Findings
- Historical Market Size Value (USD Million) Analysis By Rack Density, 2021 to 2025
- Current and Future Market Size Value (USD Million) Analysis and Forecast By Rack Density, 2026 to 2036
- 251-500 kW
- 100-250 kW
- Below 100 kW
- Above 500 kW
- 251-500 kW
- Y-o-Y Growth Trend Analysis By Rack Density, 2021 to 2025
- Absolute $ Opportunity Analysis By Rack Density, 2026 to 2036
- Global Market Analysis and Forecast, By Data Center Type, 2021 to 2036
- Introduction / Key Findings
- Historical Market Size Value (USD Million) Analysis By Data Center Type, 2021 to 2025
- Current and Future Market Size Value (USD Million) Analysis and Forecast By Data Center Type, 2026 to 2036
- Hyperscale AI
- Colocation AI
- Enterprise AI/HPC
- Research / sovereign compute
- Hyperscale AI
- Y-o-Y Growth Trend Analysis By Data Center Type, 2021 to 2025
- Absolute $ Opportunity Analysis By Data Center Type, 2026 to 2036
- Global Market Analysis and Forecast, By Route to Market, 2021 to 2036
- Introduction / Key Findings
- Historical Market Size Value (USD Million) Analysis By Route to Market, 2021 to 2025
- Current and Future Market Size Value (USD Million) Analysis and Forecast By Route to Market, 2026 to 2036
- Cooling OEM direct
- MEP / EPC integrator
- Server / rack OEM bundle
- Service & retrofit channel
- Cooling OEM direct
- Y-o-Y Growth Trend Analysis By Route to Market, 2021 to 2025
- Absolute $ Opportunity Analysis By Route to Market, 2026 to 2036
- Global Market Analysis and Forecast, By Region, 2021 to 2036
- Introduction
- Historical Market Size Value (USD Million) Analysis By Region, 2021 to 2025
- Current Market Size Value (USD Million) Analysis and Forecast By Region, 2026 to 2036
- North America
- Latin America
- Western Europe
- Eastern Europe
- East Asia
- South Asia and Pacific
- Middle East & Africa
- Market Attractiveness Analysis By Region
- North America Market Analysis and Forecast, By Country, 2021 to 2036
- Historical Market Size Value (USD Million) Trend Analysis By Market Taxonomy, 2021 to 2025
- Market Size Value (USD Million) Forecast By Market Taxonomy, 2026 to 2036
- By Country
- USA
- Canada
- By Software Function
- By Heat Rejection / Secondary Loop
- By Rack Density
- By Data Center Type
- By Route to Market
- By Country
- Market Attractiveness Analysis
- By Country
- By Software Function
- By Heat Rejection / Secondary Loop
- By Rack Density
- By Data Center Type
- By Route to Market
- Key Takeaways
- Latin America Market Analysis and Forecast, By Country
- Historical Market Size Value (USD Million) Trend Analysis By Market Taxonomy, 2021 to 2025
- Market Size Value (USD Million) Forecast By Market Taxonomy, 2026 to 2036
- By Country
- Brazil
- Mexico
- Chile
- Rest of Latin America
- By Software Function
- By Heat Rejection / Secondary Loop
- By Rack Density
- By Data Center Type
- By Route to Market
- By Country
- Market Attractiveness Analysis
- By Country
- By Software Function
- By Heat Rejection / Secondary Loop
- By Rack Density
- By Data Center Type
- By Route to Market
- Key Takeaways
- Western Europe Market Analysis and Forecast, By Country
- Historical Market Size Value (USD Million) Trend Analysis By Market Taxonomy, 2021 to 2025
- Market Size Value (USD Million) Forecast By Market Taxonomy, 2026 to 2036
- By Country
- Germany
- UK
- Italy
- Spain
- France
- Nordic
- BENELUX
- Rest of Western Europe
- By Software Function
- By Heat Rejection / Secondary Loop
- By Rack Density
- By Data Center Type
- By Route to Market
- By Country
- Market Attractiveness Analysis
- By Country
- By Software Function
- By Heat Rejection / Secondary Loop
- By Rack Density
- By Data Center Type
- By Route to Market
- Key Takeaways
- Eastern Europe Market Analysis and Forecast, By Country
- Historical Market Size Value (USD Million) Trend Analysis By Market Taxonomy, 2021 to 2025
- Market Size Value (USD Million) Forecast By Market Taxonomy, 2026 to 2036
- By Country
- Russia
- Poland
- Hungary
- Balkan & Baltic
- Rest of Eastern Europe
- By Software Function
- By Heat Rejection / Secondary Loop
- By Rack Density
- By Data Center Type
- By Route to Market
- By Country
- Market Attractiveness Analysis
- By Country
- By Software Function
- By Heat Rejection / Secondary Loop
- By Rack Density
- By Data Center Type
- By Route to Market
- Key Takeaways
- East Asia Market Analysis and Forecast, By Country
- Historical Market Size Value (USD Million) Trend Analysis By Market Taxonomy, 2021 to 2025
- Market Size Value (USD Million) Forecast By Market Taxonomy, 2026 to 2036
- By Country
- China
- Japan
- South Korea
- By Software Function
- By Heat Rejection / Secondary Loop
- By Rack Density
- By Data Center Type
- By Route to Market
- By Country
- Market Attractiveness Analysis
- By Country
- By Software Function
- By Heat Rejection / Secondary Loop
- By Rack Density
- By Data Center Type
- By Route to Market
- Key Takeaways
- South Asia and Pacific Market Analysis and Forecast, By Country
- Historical Market Size Value (USD Million) Trend Analysis By Market Taxonomy, 2021 to 2025
- Market Size Value (USD Million) Forecast By Market Taxonomy, 2026 to 2036
- By Country
- India
- ASEAN
- Australia & New Zealand
- Rest of South Asia and Pacific
- By Software Function
- By Heat Rejection / Secondary Loop
- By Rack Density
- By Data Center Type
- By Route to Market
- By Country
- Market Attractiveness Analysis
- By Country
- By Software Function
- By Heat Rejection / Secondary Loop
- By Rack Density
- By Data Center Type
- By Route to Market
- Key Takeaways
- Middle East & Africa Market Analysis and Forecast, By Country
- Historical Market Size Value (USD Million) Trend Analysis By Market Taxonomy, 2021 to 2025
- Market Size Value (USD Million) Forecast By Market Taxonomy, 2026 to 2036
- By Country
- Kingdom of Saudi Arabia
- Other GCC Countries
- Türkiye
- South Africa
- Other African Union
- Rest of Middle East & Africa
- By Software Function
- By Heat Rejection / Secondary Loop
- By Rack Density
- By Data Center Type
- By Route to Market
- By Country
- Market Attractiveness Analysis
- By Country
- By Software Function
- By Heat Rejection / Secondary Loop
- By Rack Density
- By Data Center Type
- By Route to Market
- Key Takeaways
- Key Countries Market Analysis
- USA
- Pricing Analysis
- Market Share Analysis, 2025
- By Software Function
- By Heat Rejection / Secondary Loop
- By Rack Density
- By Data Center Type
- By Route to Market
- Canada
- Pricing Analysis
- Market Share Analysis, 2025
- By Software Function
- By Heat Rejection / Secondary Loop
- By Rack Density
- By Data Center Type
- By Route to Market
- Mexico
- Pricing Analysis
- Market Share Analysis, 2025
- By Software Function
- By Heat Rejection / Secondary Loop
- By Rack Density
- By Data Center Type
- By Route to Market
- Brazil
- Pricing Analysis
- Market Share Analysis, 2025
- By Software Function
- By Heat Rejection / Secondary Loop
- By Rack Density
- By Data Center Type
- By Route to Market
- Chile
- Pricing Analysis
- Market Share Analysis, 2025
- By Software Function
- By Heat Rejection / Secondary Loop
- By Rack Density
- By Data Center Type
- By Route to Market
- Germany
- Pricing Analysis
- Market Share Analysis, 2025
- By Software Function
- By Heat Rejection / Secondary Loop
- By Rack Density
- By Data Center Type
- By Route to Market
- UK
- Pricing Analysis
- Market Share Analysis, 2025
- By Software Function
- By Heat Rejection / Secondary Loop
- By Rack Density
- By Data Center Type
- By Route to Market
- Italy
- Pricing Analysis
- Market Share Analysis, 2025
- By Software Function
- By Heat Rejection / Secondary Loop
- By Rack Density
- By Data Center Type
- By Route to Market
- Spain
- Pricing Analysis
- Market Share Analysis, 2025
- By Software Function
- By Heat Rejection / Secondary Loop
- By Rack Density
- By Data Center Type
- By Route to Market
- France
- Pricing Analysis
- Market Share Analysis, 2025
- By Software Function
- By Heat Rejection / Secondary Loop
- By Rack Density
- By Data Center Type
- By Route to Market
- India
- Pricing Analysis
- Market Share Analysis, 2025
- By Software Function
- By Heat Rejection / Secondary Loop
- By Rack Density
- By Data Center Type
- By Route to Market
- ASEAN
- Pricing Analysis
- Market Share Analysis, 2025
- By Software Function
- By Heat Rejection / Secondary Loop
- By Rack Density
- By Data Center Type
- By Route to Market
- Australia & New Zealand
- Pricing Analysis
- Market Share Analysis, 2025
- By Software Function
- By Heat Rejection / Secondary Loop
- By Rack Density
- By Data Center Type
- By Route to Market
- China
- Pricing Analysis
- Market Share Analysis, 2025
- By Software Function
- By Heat Rejection / Secondary Loop
- By Rack Density
- By Data Center Type
- By Route to Market
- Japan
- Pricing Analysis
- Market Share Analysis, 2025
- By Software Function
- By Heat Rejection / Secondary Loop
- By Rack Density
- By Data Center Type
- By Route to Market
- South Korea
- Pricing Analysis
- Market Share Analysis, 2025
- By Software Function
- By Heat Rejection / Secondary Loop
- By Rack Density
- By Data Center Type
- By Route to Market
- Russia
- Pricing Analysis
- Market Share Analysis, 2025
- By Software Function
- By Heat Rejection / Secondary Loop
- By Rack Density
- By Data Center Type
- By Route to Market
- Poland
- Pricing Analysis
- Market Share Analysis, 2025
- By Software Function
- By Heat Rejection / Secondary Loop
- By Rack Density
- By Data Center Type
- By Route to Market
- Hungary
- Pricing Analysis
- Market Share Analysis, 2025
- By Software Function
- By Heat Rejection / Secondary Loop
- By Rack Density
- By Data Center Type
- By Route to Market
- Kingdom of Saudi Arabia
- Pricing Analysis
- Market Share Analysis, 2025
- By Software Function
- By Heat Rejection / Secondary Loop
- By Rack Density
- By Data Center Type
- By Route to Market
- Türkiye
- Pricing Analysis
- Market Share Analysis, 2025
- By Software Function
- By Heat Rejection / Secondary Loop
- By Rack Density
- By Data Center Type
- By Route to Market
- South Africa
- Pricing Analysis
- Market Share Analysis, 2025
- By Software Function
- By Heat Rejection / Secondary Loop
- By Rack Density
- By Data Center Type
- By Route to Market
- USA
- Market Structure Analysis
- Competition Dashboard
- Competition Benchmarking
- Market Share Analysis of Top Players
- By Regional
- By Software Function
- By Heat Rejection / Secondary Loop
- By Rack Density
- By Data Center Type
- By Route to Market
- Emerging Startups
- Innovation Benchmarking
- Competition Analysis
- Competition Deep Dive
- Daikin
- Overview
- Product Portfolio
- Profitability by Market Segments
- Sales Footprint
- Strategy Overview
- Marketing Strategy
- Product Strategy
- Channel Strategy
- Schneider Electric
- LG Electronics
- EkkoSense
- Daikin
- Case Studies
- Success Stories
- Recent Developments
- Competition Deep Dive
- Assumptions & Acronyms Used


