Mobile Grooming Services Market Size and Share Forecast Outlook 2025 to 2035

The Mobile Grooming Services Market is expected to record a valuation of USD 2,376.0 Million in 2025 and USD 7,577.5 Million in 2035, with an increase of USD 5,201.5 Million, which equals a growth of 219% over the decade. The overall expansion represents a CAGR of 12.3% and a 3.2X increase in market size.
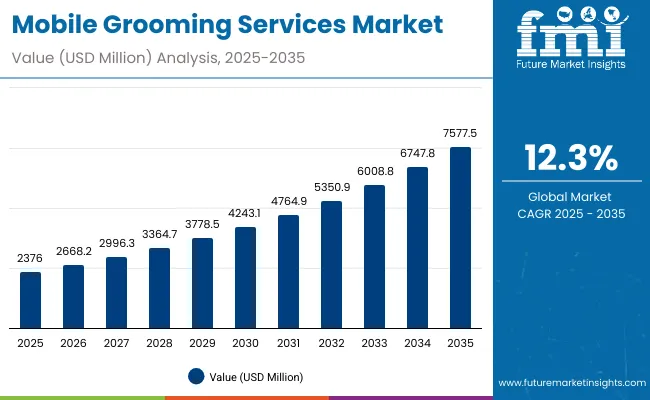
Quick Stats for Mobile Grooming Services Market

  • Market Value (2025): USD 2,376.0 Million
  • Forecast Value (2035): USD 7,577.5 Million
  • Forecast CAGR (2025 to 2035): 12.3%
  • Leading Segment in 2025: Dogs (75.7% / USD 1,798.63 Million)
  • Key Growth Regions: North America, Asia-Pacific, Europe
  • Top Key Players: Aussie Pet Mobile, HydroDog, Furry Land Mobile Grooming, Woofie’s, ZoominGroomin, Flying Fur Mobile Grooming, Pet Love Mobile Grooming, The Pooch Mobile, Dial-a-Dog-Wash, Hollywood Grooming

Mobile Grooming Services Market

Mobile Grooming Services Market Key Takeaways

Metric Value
Estimated Market Value in 2025E USD 2,376.0 Million
Forecast Market Value in 2035F USD 7,577.5 Million
Forecast CAGR (2025 to 2035) 12.3%

During the first five-year period from 2025 to 2030, the market increases from USD 2,376.0 Million to USD 4,243.1 Million, adding USD 1,867.1 Million, which accounts for 36% of the total decade growth. This phase records steady adoption across urban households, driven by rising pet humanization, demand for convenience, and increased spend on premium grooming services. Dogs dominate this period with a 75.7% share, supported by strong demand for full groom/haircut and add-on services such as nail, ear, and dental care.

The second half from 2030 to 2035 contributes USD 3,334.4 Million, equal to 64% of total growth, as the market jumps from USD 4,243.1 Million to USD 7,577.5 Million. This acceleration is powered by the expansion of regional and national franchises, digital booking platforms, and growing penetration in emerging economies such as China and India. Service diversification, including medicated and flea-tick care, enhances revenue streams, while independent operators retain 64.7% share in 2025, highlighting the importance of localized and personalized grooming services.

From 2020 to 2024, the Mobile Grooming Services Market experienced strong momentum, fueled by rising urbanization, pet humanization, and convenience-driven services. During this period, independent owner-operators dominated, capturing nearly 65% of market revenue, while regional and national franchises expanded gradually. Competitive differentiation was driven by service quality, customer convenience, and pricing flexibility, with add-on services such as nail, ear, and dental care gaining popularity.

Demand for mobile grooming services will expand to USD 2,376.0 Million in 2025, and the revenue mix will increasingly shift towards digital booking channels and premium service packages. Traditional van-based service leaders face rising competition from tech-enabled players leveraging apps, subscription-based grooming packages, and digital customer engagement platforms. Leading providers are pivoting to hybrid modelscombining in-home services with mobile spa vansto enhance reach and customer stickiness. The competitive advantage is moving away from price and accessibility alone to brand trust, personalized services, and digital convenience.

Why the Mobile Grooming Services Market is growing?

The Mobile Grooming Services Market is expanding as pet ownership increasingly mirrors human lifestyle choices. Owners now treat pets as family members, driving demand for premium services such as medicated baths, flea-tick treatments, and customized grooming packages. Growing awareness of hygiene and preventive care further boosts uptake. With dogs accounting for over 75% of service demand in 2025, households are spending more on routine grooming and add-ons, accelerating market penetration in urban centers and suburban communities.

Growth is also propelled by the convenience-driven shift in consumer behavior. Mobile grooming eliminates the stress of transporting pets to salons, offering door-to-door services through van-based spas and in-home grooming. The rise of digital booking channels apps, websites, and subscription packages is streamlining access and repeat purchases. Independent operators, who command nearly two-thirds of the market, are leveraging technology for scheduling, payments, and personalized reminders. This integration of mobility and digital engagement is reshaping competitive dynamics and fueling sustained growth globally.

Segmental Analysis

The Mobile Grooming Services Market is segmented by pet type, service type, service mode, provider type, booking channel, and region. By pet type, the market covers dogs, cats, and other small pets such as rabbits and guinea pigs. Service type spans full groom/haircut, bath & brush, de-shedding/undercoat, add-ons including nails, ears, and teeth, and specialized services like medicated or flea-tick care. Service modes include van-based mobile spas and in-home grooming. Provider categories are divided into independent owner-operators, regional chains/franchises, and national franchises. Booking channels consist of phone, websites, and apps, with digital platforms gaining rapid traction. Regionally, the market scope covers North America, Europe, Asia-Pacific, and emerging markets such as Latin America and the Middle East & Africa, with the USA, China, India, the UK, Germany, and Japan being key countries driving overall industry growth.
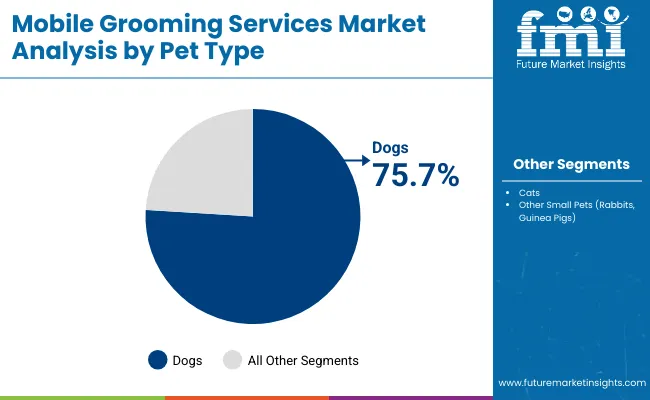
Insights into the Pet Type Segment with Dogs Leading in Market Share

Mobile Grooming Services Market By Pet

Pet Type Value Share% 2025
Dogs 75.7%
Others 24.3%

The dogs segment is projected to contribute 75.7% of the Mobile Grooming Services Market revenue in 2025, maintaining its lead as the dominant pet category. This growth is driven by the strong cultural trend of pet humanization, with dogs regarded as companions requiring regular hygiene, grooming, and premium care. Demand for full grooming and styling services, flea-tick treatments, and add-on hygiene packages is especially pronounced among dog owners, fueling higher spend per visit.

The segment’s strength is further reinforced by urbanization and rising disposable incomes, which make professional grooming more accessible. As mobile grooming expands into suburban and semi-urban regions, dogs remain the primary focus due to their grooming-intensive needs compared to cats and small pets. This ensures that the dogs category continues to anchor overall industry growth through the forecast period.
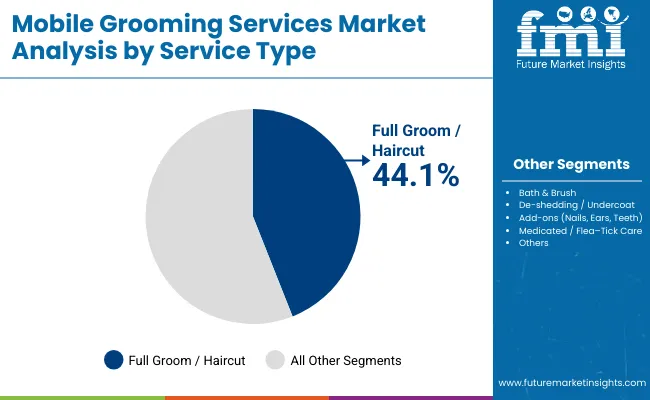
Insights into the Service Type Segment with Full Groom/Haircut Leading in Market Share

Mobile Grooming Services Market By Service

Service Type Value Share% 2025
Full groom / haircut 44.1%
Others 55.9%

The full groom/haircut segment is forecasted to hold 44.1% of the market share in 2025, driven by its central role in comprehensive pet care. Full grooming includes trimming, coat styling, hygiene maintenance, and overall appearance enhancement, making it the most sought-after service among pet owners, particularly dog households.

Its strong adoption is supported by the rising demand for premium grooming packages that combine style and health benefits, addressing both aesthetic appeal and wellness. Mobile grooming providers also integrate full grooming with add-ons such as nail clipping, ear cleaning, and dental care, creating bundled offerings that increase customer spend and loyalty.

As pet owners continue prioritizing convenience and professional grooming standards, the full groom/haircut segment is expected to retain its dominance and remain the anchor revenue driver in the Mobile Grooming Services Market.
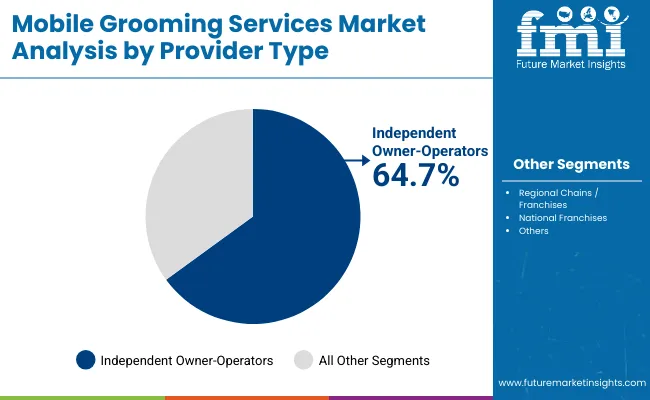
Insights into the Provider Type Segment with Independent Owner-Operators Leading in Market Share

Mobile Grooming Services Market By Provider

Provider Type Value Share% 2025
Independent owner-operators 64.7%
Others 35.3%

The independent owner-operators segment is projected to account for 64.7% of the Mobile Grooming Services Market revenue in 2025, establishing it as the leading provider type. These small-scale operators dominate due to their localized presence, personalized services, and competitive pricing, which strongly appeal to pet owners seeking convenience and trust.

Their flexibility in offering customized packages ranging from full grooms to add-on services like nail, ear, and dental care has further strengthened their position. Many independents also leverage digital booking channels and word-of-mouth referrals, enabling them to build loyal customer bases.

Given their adaptability and cost-effectiveness, independent owner-operators are expected to maintain their dominance, even as regional and national franchises expand and bring greater standardization to the market.

What are the Drivers, Restraints, and Key Trends of the Mobile Grooming Services Market?

Subscription-Based Grooming Packages

The adoption of subscription-based grooming models is a strong driver for market growth. Providers are offering monthly or quarterly packages that include full grooming, medicated baths, and add-ons like nail trimming or dental cleaning. This model ensures recurring revenue streams and builds customer loyalty while providing cost savings for pet owners. With growing demand for predictable, convenient services, subscription models are gaining traction among urban households, making them a cornerstone of sustained revenue expansion in the mobile grooming space.

Expansion into Emerging Pet Markets

Rapid growth in pet adoption across emerging economies such as India and China is creating new opportunities for mobile grooming services. First-time pet owners in these regions are highly receptive to convenience-based services that eliminate the need for travel to salons. The combination of rising disposable incomes, urban apartment living, and greater awareness of pet hygiene is fueling this demand. Providers expanding into these markets can capitalize on untapped segments, particularly among millennial and Gen Z pet owners driving new grooming habits.

Operational Cost Pressures in Van-Based Services

A major restraint lies in the high operational costs of running van-based mobile spas. Fuel, maintenance, and equipment costs continue to rise, eroding margins for independent operators who dominate the market. Unlike in-home grooming, van services also require initial capital investment for customized vehicles and professional setups. For small-scale providers, balancing affordability for customers with rising expenses is a challenge, potentially limiting scalability. These cost pressures may deter new entrants or slow expansion, especially in price-sensitive regions and suburban markets.

Digital Integration of Booking and Loyalty Platforms

A key trend reshaping the industry is the integration of digital booking platforms with loyalty and customer engagement tools. Mobile grooming providers are increasingly using apps and websites not just for scheduling, but also to track grooming history, send personalized reminders, and reward repeat clients with discounts or add-ons. This digital engagement builds stronger relationships and encourages repeat purchases, while also generating valuable customer data for service customization. As digital adoption accelerates, tech-enabled grooming is setting the benchmark for future growth.
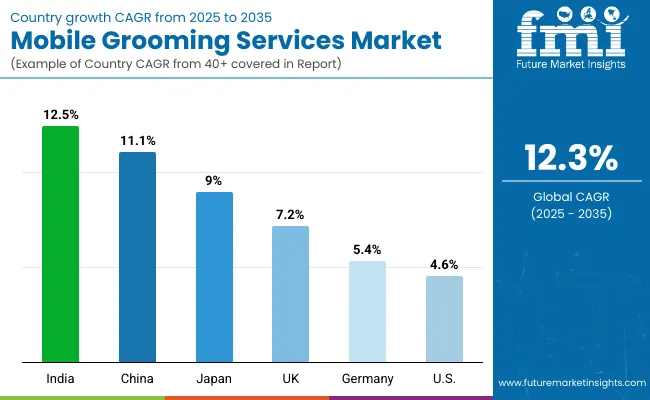
Analysis of Mobile Grooming Services Market By Key Countries

Mobile Grooming Services Market By Country

Countries Estimated CAGR (2025 to 2035)
China 11.1%
USA 4.6%
India 12.5%
UK 7.2%
Germany 5.4%
Japan 9.0%

The global Mobile Grooming Services Market shows varied growth dynamics, shaped by pet ownership trends, disposable incomes, and digital service adoption. Asia-Pacific is emerging as the fastest-growing region, anchored by China (11.1%) and India (12.5%). China’s expansion is driven by a surge in pet humanization and growing demand for professional grooming among urban households, while India’s rapid growth reflects first-time pet ownership, rising middle-class incomes, and adoption of convenient mobile services in metro and tier-2 cities.

Europe maintains strong momentum, with the UK (7.2%) and Germany (5.4%) advancing on the back of well-established pet care cultures and demand for premium grooming. Japan (9.0%) is witnessing rapid adoption of grooming-on-demand services, supported by high pet care expenditure and a growing elderly population seeking convenient pet services. The USA (4.6%) shows steady but slower expansion, reflecting a mature pet care market where growth is now being driven more by premiumization and digital booking platforms than by basic service penetration.
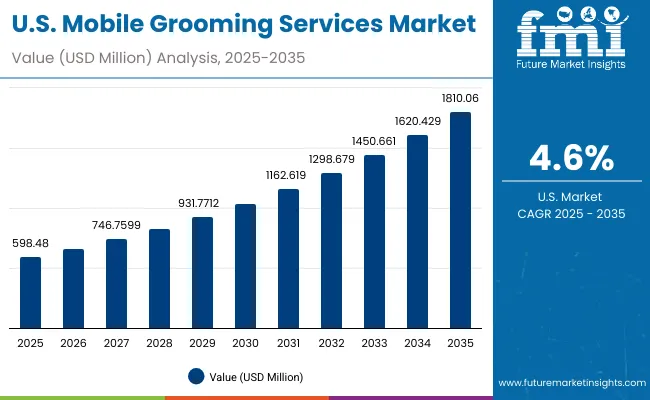
Sales Outlook for 3D Scanning in the United States

Mobile Grooming Services Market Usa

Year USA Mobile Grooming Services Market
2025 598.48
2026 668.52
2027 746.75
2028 834.15
2029 931.77
2030 1040.81
2031 1162.61
2032 1298.67
2033 1450.66
2034 1620.42
2035 1810.06

The USA Mobile Grooming Services Market is projected to grow steadily at a CAGR of 4.6%, reflecting the maturity of the country’s pet care sector. Growth is led by rising demand for premium grooming services and the shift toward subscription-based grooming packages that include add-ons such as medicated baths and dental care. Digital booking platforms are reshaping customer engagement, making app- and web-based reservations the preferred mode. Independent operators dominate service delivery, while national franchises are scaling operations to capture suburban markets and enhance brand visibility.

  • Premiumization is driving higher average spend per grooming session.
  • Digital booking platforms are fueling customer convenience and loyalty.
  • Independent operators remain the backbone of the market, though franchises are expanding footprint.

Growth and Expansion Outlook for Mobile Grooming Services in the United Kingdom

The UK Mobile Grooming Services Market is projected to grow at a CAGR of 7.2%, driven by rising urban pet ownership and the growing preference for doorstep grooming convenience among busy households. Premium full-groom and styling packages are witnessing strong uptake, particularly in metropolitan areas such as London, Manchester, and Birmingham. Partnerships between grooming startups and pet retail chains are expanding service reach, while eco-friendly mobile grooming vans and water-saving technologies are gaining traction. The market is further supported by government incentives around small-business growth and an increasing cultural focus on pet wellness.

  • Pet parents in metro areas prefer mobile grooming for time-saving and convenience.
  • Startups and franchises are collaborating with retail chains to expand reach.
  • Eco-friendly vans & sustainable practices are becoming a brand differentiator.

Growth and Expansion Outlook for Mobile Grooming Services in India

The India Mobile Grooming Services Market is set to grow at a CAGR of 12.5% through 2035, supported by the rising pet adoption trend in urban and semi-urban households. Demand is particularly strong in tier-1 and tier-2 cities where busy lifestyles drive preference for doorstep grooming solutions. Local startups are expanding aggressively with affordable service packages, while premium grooming vans offering spa-like experiences are emerging in metro regions. Increasing digital adoption, with mobile apps and online booking platforms, is streamlining service accessibility and fueling market expansion.
  • Tier-2 cities are witnessing strong uptake due to affordable and accessible services.
  • Startups and franchises are expanding rapidly with competitive pricing.
  • Digital booking platforms are driving customer convenience and repeat adoption.

Sales Outlook for 3D Scanning in China

Mobile Grooming Services Market China

The China Mobile Grooming Services Market is projected to grow at a CAGR of 11.1%, the highest among leading economies. Growth is supported by the rising pet ownership boom in urban households, especially single professionals and aging populations seeking companionship. Premium grooming vans offering luxury spa treatments, styling, and organic products are gaining traction in tier-1 cities like Shanghai and Beijing. Local service providers are innovating with subscription-based packages and AI-enabled booking apps, making grooming more affordable and accessible. Government push for pet welfare regulations further strengthens organized market expansion.

  • Urbanization & single households are fueling rapid demand for pet grooming.
  • Premium grooming vans in metro cities are attracting affluent pet owners.
  • Subscription & digital booking apps are boosting service affordability and scale.

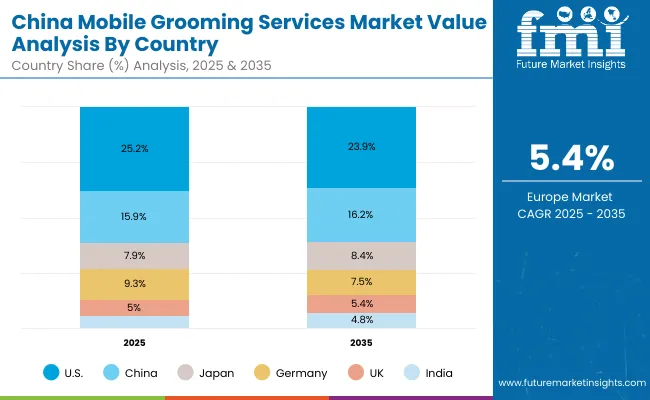
In-depth Analysis of Mobile Grooming Services in Germany

Countries 2025 Share (%)
USA 25.2%
China 15.9%
Japan 7.9%
Germany 9.3%
UK 5.0%
India 3.8%
Countries 2035 Share (%)
USA 23.9%
China 16.2%
Japan 8.4%
Germany 7.5%
UK 5.4%
India 4.8%

The Germany Mobile Grooming Services Market is projected to grow at a CAGR of 5.4%, anchored by the country’s pet-focused consumer culture and premium grooming standards. Urban pet owners are increasingly turning to mobile salons for convenience, stress-free care, and sustainable grooming practices. Groomers are offering organic shampoos, hypoallergenic treatments, and breed-specific styling, aligning with Germany’s strong preference for eco-conscious products. Rising demand from aging pet populations and dual-income households continues to accelerate adoption. Service expansion is further supported by collaborations with veterinary clinics and pet wellness brands.
  • Urban households prefer mobile grooming for stress-free, doorstep pet care.
  • Eco-friendly and hypoallergenic products are a growing demand driver.
  • Aging pets benefit from mobility-friendly at-home services.
  • Vet partnerships enhance service trust and client reach.

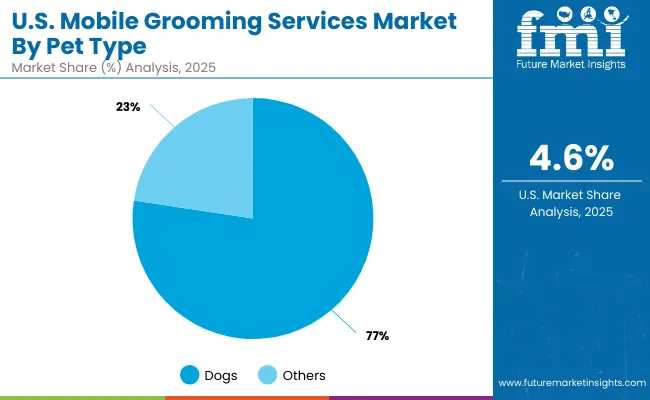
In-depth Analysis of Mobile Grooming Services in the USA

Mobile Grooming Services Market Usa 2

USA By Pet Type Value Share% 2025
Dogs 77.4%
Others 22.6%

The Mobile Grooming Services Market in the United States is projected at USD 598.5 million in 2025. Full grooming and haircut services contribute the largest share at 64.2%, while add-on wellness treatments such as flea control, teeth cleaning, and aromatherapy hold 35.8%, signaling a clear shift toward holistic, wellness-driven grooming packages. This wellness-oriented dominance reflects growing awareness among USA pet owners who prioritize health, safety, and premium care over basic grooming needs.

Demand is particularly fueled by aging pet populations requiring specialized handling, and by dual-income households seeking convenience and time efficiency. Urban markets are seeing rapid uptake, with subscription-based grooming models gaining traction. Furthermore, partnerships between mobile groomers and veterinary clinics are creating hybrid wellness packages that go beyond aesthetic care, driving steady recurring revenue.
  • Market size in 2025 projected at USD 598.5 million
  • Wellness treatments gaining share, complementing core grooming services
  • Aging pet population increases demand for gentle, specialized care
  • Subscription grooming models are expanding in major urban centers

Opportunity Analysis of China Mobile Grooming Services Market

Mobile Grooming Services Market China 2

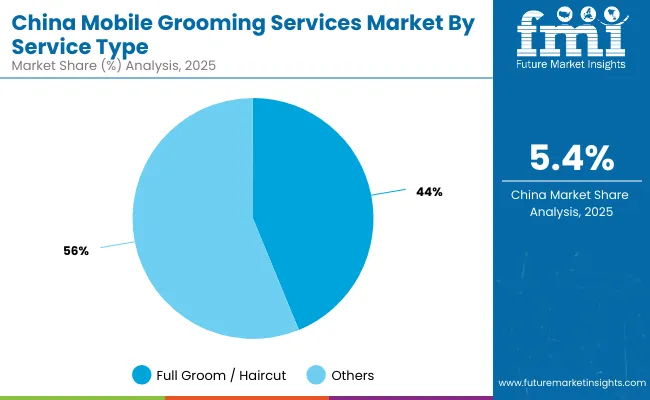
China By Service Type Value Share% 2025
Full groom / haircut 43.8%
Others 56.2%

The Mobile Grooming Services Market in China is projected at USD 1,250.7 million in 2025, with wellness-driven services such as spa treatments, de-shedding, flea/tick control, and styling add-ons leading at 56.2%, followed by full groom and haircut packages at 43.8%. This dominance of non-core grooming stems from rising urban pet ownership and growing influence of premium wellness culture among China’s millennial and Gen-Z pet parents.

Rapid adoption is being accelerated by e-commerce integration (WeChat/Alibaba-linked grooming bookings), increasing demand from luxury pet hotels and boutiques, and rising awareness of preventive pet healthcare. Subscription grooming apps are expanding in Tier-1 cities, while local entrepreneurs are piloting AI-driven scheduling and tracking to improve customer convenience.
  • Market size for China in 2025 is USD 1,250.7 million
  • Wellness-oriented services dominate at 56.2%
  • Millennial & Gen-Z pet parents drive premiumization
  • Digital-first booking platforms expand access in Tier-1 cities

Competitive Landscape of Mobile Grooming Services Market

Mobile Grooming Services Market By Company

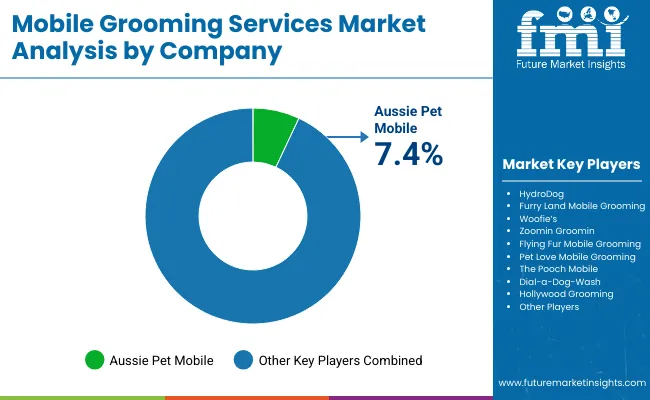
The Mobile Grooming Services Market is highly fragmented, with global leaders, regional franchises, and independent specialists competing across urban and suburban areas. Market leader Aussie Pet Mobile retains visibility with its strong franchise model, eco-friendly grooming vans, and premium service packages, while steadily expanding into newer USA and international territories.

Mid-sized regional players, including Wag’n Tails and local boutique chains, are focusing on fleet expansion and subscription-based offerings. Their strategies emphasize convenience, bundled wellness add-ons, and digital scheduling platforms to attract dual-income households and urban pet parents.

Independent groomers and niche specialists dominate smaller markets, leveraging strong community connections, social media marketing, and customized services like breed-specific styling or aromatherapy grooming. Their adaptability and localized approach allow them to thrive without the scale of larger brands.

Competitive differentiation is shifting toward wellness integration, digital-first booking, and eco-friendly operations rather than just traditional grooming services. Partnerships with veterinary clinics and pet wellness platforms are emerging as a key growth lever for sustained competitive advantage.

Key Developments in Mobile Grooming Services Market

  • Luxury Mobile Grooming Vans with Live Updates (2024): In 2024, premium service providers such as Fur Ever Fresh launched high-end grooming vans equipped with real-time HD video streaming and mobile apps, enabling pet parents to watch live sessions. These vans also provide digital grooming report cards, enhancing transparency, trust, and personalized customer engagement.
  • Rise of AI-Powered and Eco-Friendly Grooming Solutions (2025): By 2025, mobile grooming operators began integrating AI-assisted coat and skin health scanners, eco-conscious zero-waste products, and automated wellness tools. This reflects a strong shift toward sustainable, hygienic, and wellness-focused services, aligning with consumer demand for premium yet environmentally responsible grooming experiences.

Scope of the Report

Item Value
Quantitative Units USD 2,376.0 Million
Pet Type Dogs, Cats, Other small pets (rabbits, guinea pigs)
Service Type Full groom / haircut, Bath & brush, De-shedding / undercoat, Add-ons (nails, ears, teeth), Medicated / flea-tick care
Service Mode Van-based mobile spa, In-home (no van)
Provider Type Independent owner-operators, Regional chains / franchises, National franchises
Booking Channel Phone, Website, App
Regions Covered North America, Europe, Asia-Pacific, Latin America, Middle East & Africa
Country Covered United States, Canada, Germany, France, United Kingdom, China, Japan, India, Brazil, South Africa
Key Companies Profiled Aussie Pet Mobile, Hydro Dog, Furry Land Mobile Grooming, Woofie’s, Zoomin Groomin, Flying Fur Mobile Grooming, Pet Love Mobile Grooming, The Pooch Mobile, Dial-a-Dog-Wash, Hollywood Grooming
Additional Attributes Dollar sales by service type and pet category, Adoption trends in wellness-oriented add-ons (teeth cleaning, flea-tick care, aromatherapy), Rising demand for subscription-based grooming packages, Sector-specific growth in urban households, senior pet care, and premium services, Revenue segmentation by independent operators vs. franchise chains, Integration with digital booking apps, GPS tracking, and cashless payments, Regional trends influenced by pet ownership density and urbanization, Innovations in eco-friendly vans, portable grooming equipment, and pet-safe product formulations

Key Segments

By Pet Type:

  • Dogs
  • Cats
  • Other small pets (rabbits, guinea pigs)

By Service Type:

  • Full groom / haircut
  • Bath & brush
  • De-shedding / undercoat
  • Add-ons (nails, ears, teeth)
  • Medicated / flea–tick care

By Service Mode:

  • Van-based mobile spa
  • In-home (no van)

By Provider Type:

  • Independent owner-operators
  • Regional chains / franchises
  • National franchises

By Booking Channel:

  • Phone
  • Webiste
  • App

By Region:

  • North America
  • Latin America
  • Europe
  • East Asia
  • South Asia & Pacific
  • Middle East and Africa

Table of Content

  1. Executive Summary
    • Global Market Outlook
    • Demand-side Trends
    • Supply-side Trends
    • Technology Roadmap Analysis
    • Analysis and Recommendations
  2. Market Overview
    • Market Coverage / Taxonomy
    • Market Definition / Scope / Limitations
  3. Market Background
    • Market Dynamics
      • Drivers
      • Restraints
      • Opportunity
      • Trends
    • Scenario Forecast
      • Demand in Optimistic Scenario
      • Demand in Likely Scenario
      • Demand in Conservative Scenario
    • Opportunity Map Analysis
    • Product Life Cycle Analysis
    • Supply Chain Analysis
      • Supply Side Participants and their Roles
        • Producers
        • Mid-Level Participants (Traders/ Agents/ Brokers)
        • Wholesalers and Distributors
      • Value Added and Value Created at Node in the Supply Chain
      • List of Raw Material Suppliers
      • List of Existing and Potential Buyer’s
    • Investment Feasibility Matrix
    • Value Chain Analysis
      • Profit Margin Analysis
      • Wholesalers and Distributors
      • Retailers
    • PESTLE and Porter’s Analysis
    • Regulatory Landscape
      • By Key Regions
      • By Key Countries
    • Regional Parent Market Outlook
    • Production and Consumption Statistics
    • Import and Export Statistics
  4. Global Analysis 2020 to 2024 and Forecast, 2025 to 2035
    • Historical Market Size Value (USD Million) & Volume (Units) Analysis, 2020 to 2024
    • Current and Future Market Size Value (USD Million) & Volume (Units) Projections, 2025 to 2035
      • Y-o-Y Growth Trend Analysis
      • Absolute $ Opportunity Analysis
  5. Global Analysis 2020 to 2024 and Forecast 2025 to 2035, By Pet Type
    • Introduction / Key Findings
    • Historical Market Size Value (USD Million) & Volume (Units) Analysis By Pet Type, 2020 to 2024
    • Current and Future Market Size Value (USD Million) & Volume (Units) Analysis and Forecast By Pet Type, 2025 to 2035
      • Dogs
      • Cats
      • Other small pets (rabbits, guinea pigs)
    • Y-o-Y Growth Trend Analysis By Pet Type, 2020 to 2024
    • Absolute $ Opportunity Analysis By Pet Type, 2025 to 2035
  6. Global Analysis 2020 to 2024 and Forecast 2025 to 2035, By Service Type
    • Introduction / Key Findings
    • Historical Market Size Value (USD Million) & Volume (Units) Analysis By Service Type, 2020 to 2024
    • Current and Future Market Size Value (USD Million) & Volume (Units) Analysis and Forecast By Service Type, 2025 to 2035
      • Full groom / haircut
      • Bath & brush
      • De-shedding / undercoat
      • Add-ons (nails, ears, teeth)
      • Medicated / flea–tick care
    • Y-o-Y Growth Trend Analysis By Service Type, 2020 to 2024
    • Absolute $ Opportunity Analysis By Service Type, 2025 to 2035
  7. Global Analysis 2020 to 2024 and Forecast 2025 to 2035, By Service Mode
    • Introduction / Key Findings
    • Historical Market Size Value (USD Million) & Volume (Units) Analysis By Service Mode, 2020 to 2024
    • Current and Future Market Size Value (USD Million) & Volume (Units) Analysis and Forecast By Service Mode, 2025 to 2035
      • Van-based mobile spa
      • In-home (no van)
    • Y-o-Y Growth Trend Analysis By Service Mode, 2020 to 2024
    • Absolute $ Opportunity Analysis By Service Mode, 2025 to 2035
  8. Global Analysis 2020 to 2024 and Forecast 2025 to 2035, By Provider Type
    • Introduction / Key Findings
    • Historical Market Size Value (USD Million) & Volume (Units) Analysis By Provider Type, 2020 to 2024
    • Current and Future Market Size Value (USD Million) & Volume (Units) Analysis and Forecast By Provider Type, 2025 to 2035
      • Independent owner-operators
      • Regional chains / franchises
      • National franchises
    • Y-o-Y Growth Trend Analysis By Provider Type, 2020 to 2024
    • Absolute $ Opportunity Analysis By Provider Type, 2025 to 2035
  9. Global Analysis 2020 to 2024 and Forecast 2025 to 2035, By Booking Channel
    • Introduction / Key Findings
    • Historical Market Size Value (USD Million) & Volume (Units) Analysis By Booking Channel, 2020 to 2024
    • Current and Future Market Size Value (USD Million) & Volume (Units) Analysis and Forecast By Booking Channel, 2025 to 2035
      • Phone
      • Webiste
      • App
    • Y-o-Y Growth Trend Analysis By Booking Channel, 2020 to 2024
    • Absolute $ Opportunity Analysis By Booking Channel, 2025 to 2035
  10. Global Analysis 2020 to 2024 and Forecast 2025 to 2035, By Region
    • Introduction
    • Historical Market Size Value (USD Million) & Volume (Units) Analysis By Region, 2020 to 2024
    • Current Market Size Value (USD Million) & Volume (Units) Analysis and Forecast By Region, 2025 to 2035
      • North America
      • Latin America
      • Europe
      • East Asia
      • South Asia & Pacific
      • Middle East and Africa
    • Market Attractiveness Analysis By Region
  11. North America Analysis 2020 to 2024 and Forecast 2025 to 2035, By Country
    • Historical Market Size Value (USD Million) & Volume (Units) Trend Analysis By Market Taxonomy, 2020 to 2024
    • Market Size Value (USD Million) & Volume (Units) Forecast By Market Taxonomy, 2025 to 2035
      • By Country
        • USA
        • Canada
      • By Pet Type
      • By Service Type
      • By Service Mode
      • By Provider Type
      • By Booking Channel
    • Market Attractiveness Analysis
      • By Country
      • By Pet Type
      • By Service Type
      • By Service Mode
      • By Provider Type
      • By Booking Channel
    • Key Takeaways
  12. Latin America Analysis 2020 to 2024 and Forecast 2025 to 2035, By Country
    • Historical Market Size Value (USD Million) & Volume (Units) Trend Analysis By Market Taxonomy, 2020 to 2024
    • Market Size Value (USD Million) & Volume (Units) Forecast By Market Taxonomy, 2025 to 2035
      • By Country
        • Brazil
        • Mexico
        • Colombia
        • Rest of Latin America
      • By Pet Type
      • By Service Type
      • By Service Mode
      • By Provider Type
      • By Booking Channel
    • Market Attractiveness Analysis
      • By Country
      • By Pet Type
      • By Service Type
      • By Service Mode
      • By Provider Type
      • By Booking Channel
    • Key Takeaways
  13. Europe Analysis 2020 to 2024 and Forecast 2025 to 2035, By Country
    • Historical Market Size Value (USD Million) & Volume (Units) Trend Analysis By Market Taxonomy, 2020 to 2024
    • Market Size Value (USD Million) & Volume (Units) Forecast By Market Taxonomy, 2025 to 2035
      • By Country
        • Germany
        • UK
        • France
        • Italy
        • Spain
        • Belgium
        • Netherlands
        • Nordic
        • Switzerland
        • Russia
        • Poland
        • Rest of Europe
      • By Pet Type
      • By Service Type
      • By Service Mode
      • By Provider Type
      • By Booking Channel
    • Market Attractiveness Analysis
      • By Country
      • By Pet Type
      • By Service Type
      • By Service Mode
      • By Provider Type
      • By Booking Channel
    • Key Takeaways
  14. East Asia Analysis 2020 to 2024 and Forecast 2025 to 2035, By Country
    • Historical Market Size Value (USD Million) & Volume (Units) Trend Analysis By Market Taxonomy, 2020 to 2024
    • Market Size Value (USD Million) & Volume (Units) Forecast By Market Taxonomy, 2025 to 2035
      • By Country
        • China
        • Japan
        • South Korea
      • By Pet Type
      • By Service Type
      • By Service Mode
      • By Provider Type
      • By Booking Channel
    • Market Attractiveness Analysis
      • By Country
      • By Pet Type
      • By Service Type
      • By Service Mode
      • By Provider Type
      • By Booking Channel
    • Key Takeaways
  15. South Asia & Pacific Analysis 2020 to 2024 and Forecast 2025 to 2035, By Country
    • Historical Market Size Value (USD Million) & Volume (Units) Trend Analysis By Market Taxonomy, 2020 to 2024
    • Market Size Value (USD Million) & Volume (Units) Forecast By Market Taxonomy, 2025 to 2035
      • By Country
        • India
        • Thailand
        • Malaysia
        • Indonesia
        • Singapore
        • Vietnam
        • Australia
        • New Zealand
        • Rest of South Asia
      • By Pet Type
      • By Service Type
      • By Service Mode
      • By Provider Type
      • By Booking Channel
    • Market Attractiveness Analysis
      • By Country
      • By Pet Type
      • By Service Type
      • By Service Mode
      • By Provider Type
      • By Booking Channel
    • Key Takeaways
  16. Middle East and Africa Analysis 2020 to 2024 and Forecast 2025 to 2035, By Country
    • Historical Market Size Value (USD Million) & Volume (Units) Trend Analysis By Market Taxonomy, 2020 to 2024
    • Market Size Value (USD Million) & Volume (Units) Forecast By Market Taxonomy, 2025 to 2035
      • By Country
        • Turkey
        • UAE
        • Saudi Arabia
        • Israel
        • Other GCC Countries
        • North Africa
        • South Africa
      • By Pet Type
      • By Service Type
      • By Service Mode
      • By Provider Type
      • By Booking Channel
    • Market Attractiveness Analysis
      • By Country
      • By Pet Type
      • By Service Type
      • By Service Mode
      • By Provider Type
      • By Booking Channel
    • Key Takeaways
  17. Key Countries Analysis
    • USA
      • Pricing Analysis
      • Market Share Analysis, 2024
        • By Pet Type
        • By Service Type
        • By Service Mode
        • By Provider Type
        • By Booking Channel
    • Canada
      • Pricing Analysis
      • Market Share Analysis, 2024
        • By Pet Type
        • By Service Type
        • By Service Mode
        • By Provider Type
        • By Booking Channel
    • Brazil
      • Pricing Analysis
      • Market Share Analysis, 2024
        • By Pet Type
        • By Service Type
        • By Service Mode
        • By Provider Type
        • By Booking Channel
    • Mexico
      • Pricing Analysis
      • Market Share Analysis, 2024
        • By Pet Type
        • By Service Type
        • By Service Mode
        • By Provider Type
        • By Booking Channel
    • Colombia
      • Pricing Analysis
      • Market Share Analysis, 2024
        • By Pet Type
        • By Service Type
        • By Service Mode
        • By Provider Type
        • By Booking Channel
    • Germany
      • Pricing Analysis
      • Market Share Analysis, 2024
        • By Pet Type
        • By Service Type
        • By Service Mode
        • By Provider Type
        • By Booking Channel
    • UK
      • Pricing Analysis
      • Market Share Analysis, 2024
        • By Pet Type
        • By Service Type
        • By Service Mode
        • By Provider Type
        • By Booking Channel
    • France
      • Pricing Analysis
      • Market Share Analysis, 2024
        • By Pet Type
        • By Service Type
        • By Service Mode
        • By Provider Type
        • By Booking Channel
    • Italy
      • Pricing Analysis
      • Market Share Analysis, 2024
        • By Pet Type
        • By Service Type
        • By Service Mode
        • By Provider Type
        • By Booking Channel
    • Spain
      • Pricing Analysis
      • Market Share Analysis, 2024
        • By Pet Type
        • By Service Type
        • By Service Mode
        • By Provider Type
        • By Booking Channel
    • Belgium
      • Pricing Analysis
      • Market Share Analysis, 2024
        • By Pet Type
        • By Service Type
        • By Service Mode
        • By Provider Type
        • By Booking Channel
    • Netherlands
      • Pricing Analysis
      • Market Share Analysis, 2024
        • By Pet Type
        • By Service Type
        • By Service Mode
        • By Provider Type
        • By Booking Channel
    • Nordic
      • Pricing Analysis
      • Market Share Analysis, 2024
        • By Pet Type
        • By Service Type
        • By Service Mode
        • By Provider Type
        • By Booking Channel
    • Switzerland
      • Pricing Analysis
      • Market Share Analysis, 2024
        • By Pet Type
        • By Service Type
        • By Service Mode
        • By Provider Type
        • By Booking Channel
    • Russia
      • Pricing Analysis
      • Market Share Analysis, 2024
        • By Pet Type
        • By Service Type
        • By Service Mode
        • By Provider Type
        • By Booking Channel
    • Poland
      • Pricing Analysis
      • Market Share Analysis, 2024
        • By Pet Type
        • By Service Type
        • By Service Mode
        • By Provider Type
        • By Booking Channel
    • China
      • Pricing Analysis
      • Market Share Analysis, 2024
        • By Pet Type
        • By Service Type
        • By Service Mode
        • By Provider Type
        • By Booking Channel
    • Japan
      • Pricing Analysis
      • Market Share Analysis, 2024
        • By Pet Type
        • By Service Type
        • By Service Mode
        • By Provider Type
        • By Booking Channel
    • South Korea
      • Pricing Analysis
      • Market Share Analysis, 2024
        • By Pet Type
        • By Service Type
        • By Service Mode
        • By Provider Type
        • By Booking Channel
    • India
      • Pricing Analysis
      • Market Share Analysis, 2024
        • By Pet Type
        • By Service Type
        • By Service Mode
        • By Provider Type
        • By Booking Channel
    • Thailand
      • Pricing Analysis
      • Market Share Analysis, 2024
        • By Pet Type
        • By Service Type
        • By Service Mode
        • By Provider Type
        • By Booking Channel
    • Indonesia
      • Pricing Analysis
      • Market Share Analysis, 2024
        • By Pet Type
        • By Service Type
        • By Service Mode
        • By Provider Type
        • By Booking Channel
    • Australia
      • Pricing Analysis
      • Market Share Analysis, 2024
        • By Pet Type
        • By Service Type
        • By Service Mode
        • By Provider Type
        • By Booking Channel
    • New Zealand
      • Pricing Analysis
      • Market Share Analysis, 2024
        • By Pet Type
        • By Service Type
        • By Service Mode
        • By Provider Type
        • By Booking Channel
    • Turkey
      • Pricing Analysis
      • Market Share Analysis, 2024
        • By Pet Type
        • By Service Type
        • By Service Mode
        • By Provider Type
        • By Booking Channel
    • UAE
      • Pricing Analysis
      • Market Share Analysis, 2024
        • By Pet Type
        • By Service Type
        • By Service Mode
        • By Provider Type
        • By Booking Channel
    • Saudi Arabia
      • Pricing Analysis
      • Market Share Analysis, 2024
        • By Pet Type
        • By Service Type
        • By Service Mode
        • By Provider Type
        • By Booking Channel
    • Israel
      • Pricing Analysis
      • Market Share Analysis, 2024
        • By Pet Type
        • By Service Type
        • By Service Mode
        • By Provider Type
        • By Booking Channel
    • North Africa
      • Pricing Analysis
      • Market Share Analysis, 2024
        • By Pet Type
        • By Service Type
        • By Service Mode
        • By Provider Type
        • By Booking Channel
    • South Africa
      • Pricing Analysis
      • Market Share Analysis, 2024
        • By Pet Type
        • By Service Type
        • By Service Mode
        • By Provider Type
        • By Booking Channel
  18. Market Structure Analysis
    • Competition Dashboard
    • Competition Benchmarking
    • Market Share Analysis of Top Players
      • By Regional
      • By Pet Type
      • By Service Type
      • By Service Mode
      • By Provider Type
      • By Booking Channel
  19. Competition Analysis
    • Competition Deep Dive
      • Aussie Pet Mobile
        • Overview
        • Product Portfolio
        • Profitability by Market Segments (Product/Age /Sales Channel/Region)
        • Sales Footprint
        • Strategy Overview
          • Marketing Strategy
          • Product Strategy
          • Channel Strategy
      • HydroDog
        • Overview
        • Product Portfolio
        • Profitability by Market Segments (Product/Age /Sales Channel/Region)
        • Sales Footprint
        • Strategy Overview
          • Marketing Strategy
          • Product Strategy
          • Channel Strategy
      • Furry Land Mobile Grooming
        • Overview
        • Product Portfolio
        • Profitability by Market Segments (Product/Age /Sales Channel/Region)
        • Sales Footprint
        • Strategy Overview
          • Marketing Strategy
          • Product Strategy
          • Channel Strategy
      • Woofie’s
        • Overview
        • Product Portfolio
        • Profitability by Market Segments (Product/Age /Sales Channel/Region)
        • Sales Footprint
        • Strategy Overview
          • Marketing Strategy
          • Product Strategy
          • Channel Strategy
      • Zoomin Groomin
        • Overview
        • Product Portfolio
        • Profitability by Market Segments (Product/Age /Sales Channel/Region)
        • Sales Footprint
        • Strategy Overview
          • Marketing Strategy
          • Product Strategy
          • Channel Strategy
      • Flying Fur Mobile Grooming
        • Overview
        • Product Portfolio
        • Profitability by Market Segments (Product/Age /Sales Channel/Region)
        • Sales Footprint
        • Strategy Overview
          • Marketing Strategy
          • Product Strategy
          • Channel Strategy
      • Pet Love Mobile Grooming
        • Overview
        • Product Portfolio
        • Profitability by Market Segments (Product/Age /Sales Channel/Region)
        • Sales Footprint
        • Strategy Overview
          • Marketing Strategy
          • Product Strategy
          • Channel Strategy
      • The Pooch Mobile
        • Overview
        • Product Portfolio
        • Profitability by Market Segments (Product/Age /Sales Channel/Region)
        • Sales Footprint
        • Strategy Overview
          • Marketing Strategy
          • Product Strategy
          • Channel Strategy
      • Dial-a-Dog-Wash
        • Overview
        • Product Portfolio
        • Profitability by Market Segments (Product/Age /Sales Channel/Region)
        • Sales Footprint
        • Strategy Overview
          • Marketing Strategy
          • Product Strategy
          • Channel Strategy
      • Hollywood Grooming
        • Overview
        • Product Portfolio
        • Profitability by Market Segments (Product/Age /Sales Channel/Region)
        • Sales Footprint
        • Strategy Overview
          • Marketing Strategy
          • Product Strategy
          • Channel Strategy
      • Others
        • Overview
        • Product Portfolio
        • Profitability by Market Segments (Product/Age /Sales Channel/Region)
        • Sales Footprint
        • Strategy Overview
          • Marketing Strategy
          • Product Strategy
          • Channel Strategy
  20. Assumptions & Acronyms Used
  21. Research Methodology

List of Tables

  • Table 1: Global Value (USD Million) Forecast by Region, 2020-2035
  • Table 2: Global Volume (Units) Forecast by Region, 2020-2035
  • Table 3: Global Value (USD Million) Forecast by Pet Type, 2020-2035
  • Table 4: Global Volume (Units) Forecast by Pet Type, 2020-2035
  • Table 5: Global Value (USD Million) Forecast by Service Type, 2020-2035
  • Table 6: Global Volume (Units) Forecast by Service Type, 2020-2035
  • Table 7: Global Value (USD Million) Forecast by Service Mode, 2020-2035
  • Table 8: Global Volume (Units) Forecast by Service Mode, 2020-2035
  • Table 9: Global Value (USD Million) Forecast by Provider Type, 2020-2035
  • Table 10: Global Volume (Units) Forecast by Provider Type, 2020-2035
  • Table 11: Global Value (USD Million) Forecast by Booking Channel, 2020-2035
  • Table 12: Global Volume (Units) Forecast by Booking Channel, 2020-2035
  • Table 13: North America Value (USD Million) Forecast by Country, 2020-2035
  • Table 14: North America Volume (Units) Forecast by Country, 2020-2035
  • Table 15: North America Value (USD Million) Forecast by Pet Type, 2020-2035
  • Table 16: North America Volume (Units) Forecast by Pet Type, 2020-2035
  • Table 17: North America Value (USD Million) Forecast by Service Type, 2020-2035
  • Table 18: North America Volume (Units) Forecast by Service Type, 2020-2035
  • Table 19: North America Value (USD Million) Forecast by Service Mode, 2020-2035
  • Table 20: North America Volume (Units) Forecast by Service Mode, 2020-2035
  • Table 21: North America Value (USD Million) Forecast by Provider Type, 2020-2035
  • Table 22: North America Volume (Units) Forecast by Provider Type, 2020-2035
  • Table 23: North America Value (USD Million) Forecast by Booking Channel, 2020-2035
  • Table 24: North America Volume (Units) Forecast by Booking Channel, 2020-2035
  • Table 25: Latin America Value (USD Million) Forecast by Country, 2020-2035
  • Table 26: Latin America Volume (Units) Forecast by Country, 2020-2035
  • Table 27: Latin America Value (USD Million) Forecast by Pet Type, 2020-2035
  • Table 28: Latin America Volume (Units) Forecast by Pet Type, 2020-2035
  • Table 29: Latin America Value (USD Million) Forecast by Service Type, 2020-2035
  • Table 30: Latin America Volume (Units) Forecast by Service Type, 2020-2035
  • Table 31: Latin America Value (USD Million) Forecast by Service Mode, 2020-2035
  • Table 32: Latin America Volume (Units) Forecast by Service Mode, 2020-2035
  • Table 33: Latin America Value (USD Million) Forecast by Provider Type, 2020-2035
  • Table 34: Latin America Volume (Units) Forecast by Provider Type, 2020-2035
  • Table 35: Latin America Value (USD Million) Forecast by Booking Channel, 2020-2035
  • Table 36: Latin America Volume (Units) Forecast by Booking Channel, 2020-2035
  • Table 37: Europe Value (USD Million) Forecast by Country, 2020-2035
  • Table 38: Europe Volume (Units) Forecast by Country, 2020-2035
  • Table 39: Europe Value (USD Million) Forecast by Pet Type, 2020-2035
  • Table 40: Europe Volume (Units) Forecast by Pet Type, 2020-2035
  • Table 41: Europe Value (USD Million) Forecast by Service Type, 2020-2035
  • Table 42: Europe Volume (Units) Forecast by Service Type, 2020-2035
  • Table 43: Europe Value (USD Million) Forecast by Service Mode, 2020-2035
  • Table 44: Europe Volume (Units) Forecast by Service Mode, 2020-2035
  • Table 45: Europe Value (USD Million) Forecast by Provider Type, 2020-2035
  • Table 46: Europe Volume (Units) Forecast by Provider Type, 2020-2035
  • Table 47: Europe Value (USD Million) Forecast by Booking Channel, 2020-2035
  • Table 48: Europe Volume (Units) Forecast by Booking Channel, 2020-2035
  • Table 49: East Asia Value (USD Million) Forecast by Country, 2020-2035
  • Table 50: East Asia Volume (Units) Forecast by Country, 2020-2035
  • Table 51: East Asia Value (USD Million) Forecast by Pet Type, 2020-2035
  • Table 52: East Asia Volume (Units) Forecast by Pet Type, 2020-2035
  • Table 53: East Asia Value (USD Million) Forecast by Service Type, 2020-2035
  • Table 54: East Asia Volume (Units) Forecast by Service Type, 2020-2035
  • Table 55: East Asia Value (USD Million) Forecast by Service Mode, 2020-2035
  • Table 56: East Asia Volume (Units) Forecast by Service Mode, 2020-2035
  • Table 57: East Asia Value (USD Million) Forecast by Provider Type, 2020-2035
  • Table 58: East Asia Volume (Units) Forecast by Provider Type, 2020-2035
  • Table 59: East Asia Value (USD Million) Forecast by Booking Channel, 2020-2035
  • Table 60: East Asia Volume (Units) Forecast by Booking Channel, 2020-2035
  • Table 61: South Asia & Pacific Value (USD Million) Forecast by Country, 2020-2035
  • Table 62: South Asia & Pacific Volume (Units) Forecast by Country, 2020-2035
  • Table 63: South Asia & Pacific Value (USD Million) Forecast by Pet Type, 2020-2035
  • Table 64: South Asia & Pacific Volume (Units) Forecast by Pet Type, 2020-2035
  • Table 65: South Asia & Pacific Value (USD Million) Forecast by Service Type, 2020-2035
  • Table 66: South Asia & Pacific Volume (Units) Forecast by Service Type, 2020-2035
  • Table 67: South Asia & Pacific Value (USD Million) Forecast by Service Mode, 2020-2035
  • Table 68: South Asia & Pacific Volume (Units) Forecast by Service Mode, 2020-2035
  • Table 69: South Asia & Pacific Value (USD Million) Forecast by Provider Type, 2020-2035
  • Table 70: South Asia & Pacific Volume (Units) Forecast by Provider Type, 2020-2035
  • Table 71: South Asia & Pacific Value (USD Million) Forecast by Booking Channel, 2020-2035
  • Table 72: South Asia & Pacific Volume (Units) Forecast by Booking Channel, 2020-2035
  • Table 73: Middle East and Africa Value (USD Million) Forecast by Country, 2020-2035
  • Table 74: Middle East and Africa Volume (Units) Forecast by Country, 2020-2035
  • Table 75: Middle East and Africa Value (USD Million) Forecast by Pet Type, 2020-2035
  • Table 76: Middle East and Africa Volume (Units) Forecast by Pet Type, 2020-2035
  • Table 77: Middle East and Africa Value (USD Million) Forecast by Service Type, 2020-2035
  • Table 78: Middle East and Africa Volume (Units) Forecast by Service Type, 2020-2035
  • Table 79: Middle East and Africa Value (USD Million) Forecast by Service Mode, 2020-2035
  • Table 80: Middle East and Africa Volume (Units) Forecast by Service Mode, 2020-2035
  • Table 81: Middle East and Africa Value (USD Million) Forecast by Provider Type, 2020-2035
  • Table 82: Middle East and Africa Volume (Units) Forecast by Provider Type, 2020-2035
  • Table 83: Middle East and Africa Value (USD Million) Forecast by Booking Channel, 2020-2035
  • Table 84: Middle East and Africa Volume (Units) Forecast by Booking Channel, 2020-2035

List of Figures

  • Figure 1: Global Value (USD Million) by Pet Type, 2025-2035
  • Figure 2: Global Value (USD Million) by Service Type, 2025-2035
  • Figure 3: Global Value (USD Million) by Service Mode, 2025-2035
  • Figure 4: Global Value (USD Million) by Provider Type, 2025-2035
  • Figure 5: Global Value (USD Million) by Booking Channel, 2025-2035
  • Figure 6: Global Value (USD Million) by Region, 2025-2035
  • Figure 7: Global Value (USD Million) Analysis by Region, 2020-2035
  • Figure 8: Global Volume (Units) Analysis by Region, 2020-2035
  • Figure 9: Global Value Share (%) and BPS Analysis by Region, 2025-2035
  • Figure 10: Global Y-o-Y Growth (%) Projections by Region, 2025-2035
  • Figure 11: Global Value (USD Million) Analysis by Pet Type, 2020-2035
  • Figure 12: Global Volume (Units) Analysis by Pet Type, 2020-2035
  • Figure 13: Global Value Share (%) and BPS Analysis by Pet Type, 2025-2035
  • Figure 14: Global Y-o-Y Growth (%) Projections by Pet Type, 2025-2035
  • Figure 15: Global Value (USD Million) Analysis by Service Type, 2020-2035
  • Figure 16: Global Volume (Units) Analysis by Service Type, 2020-2035
  • Figure 17: Global Value Share (%) and BPS Analysis by Service Type, 2025-2035
  • Figure 18: Global Y-o-Y Growth (%) Projections by Service Type, 2025-2035
  • Figure 19: Global Value (USD Million) Analysis by Service Mode, 2020-2035
  • Figure 20: Global Volume (Units) Analysis by Service Mode, 2020-2035
  • Figure 21: Global Value Share (%) and BPS Analysis by Service Mode, 2025-2035
  • Figure 22: Global Y-o-Y Growth (%) Projections by Service Mode, 2025-2035
  • Figure 23: Global Value (USD Million) Analysis by Provider Type, 2020-2035
  • Figure 24: Global Volume (Units) Analysis by Provider Type, 2020-2035
  • Figure 25: Global Value Share (%) and BPS Analysis by Provider Type, 2025-2035
  • Figure 26: Global Y-o-Y Growth (%) Projections by Provider Type, 2025-2035
  • Figure 27: Global Value (USD Million) Analysis by Booking Channel, 2020-2035
  • Figure 28: Global Volume (Units) Analysis by Booking Channel, 2020-2035
  • Figure 29: Global Value Share (%) and BPS Analysis by Booking Channel, 2025-2035
  • Figure 30: Global Y-o-Y Growth (%) Projections by Booking Channel, 2025-2035
  • Figure 31: Global Attractiveness by Pet Type, 2025-2035
  • Figure 32: Global Attractiveness by Service Type, 2025-2035
  • Figure 33: Global Attractiveness by Service Mode, 2025-2035
  • Figure 34: Global Attractiveness by Provider Type, 2025-2035
  • Figure 35: Global Attractiveness by Booking Channel, 2025-2035
  • Figure 36: Global Attractiveness by Region, 2025-2035
  • Figure 37: North America Value (USD Million) by Pet Type, 2025-2035
  • Figure 38: North America Value (USD Million) by Service Type, 2025-2035
  • Figure 39: North America Value (USD Million) by Service Mode, 2025-2035
  • Figure 40: North America Value (USD Million) by Provider Type, 2025-2035
  • Figure 41: North America Value (USD Million) by Booking Channel, 2025-2035
  • Figure 42: North America Value (USD Million) by Country, 2025-2035
  • Figure 43: North America Value (USD Million) Analysis by Country, 2020-2035
  • Figure 44: North America Volume (Units) Analysis by Country, 2020-2035
  • Figure 45: North America Value Share (%) and BPS Analysis by Country, 2025-2035
  • Figure 46: North America Y-o-Y Growth (%) Projections by Country, 2025-2035
  • Figure 47: North America Value (USD Million) Analysis by Pet Type, 2020-2035
  • Figure 48: North America Volume (Units) Analysis by Pet Type, 2020-2035
  • Figure 49: North America Value Share (%) and BPS Analysis by Pet Type, 2025-2035
  • Figure 50: North America Y-o-Y Growth (%) Projections by Pet Type, 2025-2035
  • Figure 51: North America Value (USD Million) Analysis by Service Type, 2020-2035
  • Figure 52: North America Volume (Units) Analysis by Service Type, 2020-2035
  • Figure 53: North America Value Share (%) and BPS Analysis by Service Type, 2025-2035
  • Figure 54: North America Y-o-Y Growth (%) Projections by Service Type, 2025-2035
  • Figure 55: North America Value (USD Million) Analysis by Service Mode, 2020-2035
  • Figure 56: North America Volume (Units) Analysis by Service Mode, 2020-2035
  • Figure 57: North America Value Share (%) and BPS Analysis by Service Mode, 2025-2035
  • Figure 58: North America Y-o-Y Growth (%) Projections by Service Mode, 2025-2035
  • Figure 59: North America Value (USD Million) Analysis by Provider Type, 2020-2035
  • Figure 60: North America Volume (Units) Analysis by Provider Type, 2020-2035
  • Figure 61: North America Value Share (%) and BPS Analysis by Provider Type, 2025-2035
  • Figure 62: North America Y-o-Y Growth (%) Projections by Provider Type, 2025-2035
  • Figure 63: North America Value (USD Million) Analysis by Booking Channel, 2020-2035
  • Figure 64: North America Volume (Units) Analysis by Booking Channel, 2020-2035
  • Figure 65: North America Value Share (%) and BPS Analysis by Booking Channel, 2025-2035
  • Figure 66: North America Y-o-Y Growth (%) Projections by Booking Channel, 2025-2035
  • Figure 67: North America Attractiveness by Pet Type, 2025-2035
  • Figure 68: North America Attractiveness by Service Type, 2025-2035
  • Figure 69: North America Attractiveness by Service Mode, 2025-2035
  • Figure 70: North America Attractiveness by Provider Type, 2025-2035
  • Figure 71: North America Attractiveness by Booking Channel, 2025-2035
  • Figure 72: North America Attractiveness by Country, 2025-2035
  • Figure 73: Latin America Value (USD Million) by Pet Type, 2025-2035
  • Figure 74: Latin America Value (USD Million) by Service Type, 2025-2035
  • Figure 75: Latin America Value (USD Million) by Service Mode, 2025-2035
  • Figure 76: Latin America Value (USD Million) by Provider Type, 2025-2035
  • Figure 77: Latin America Value (USD Million) by Booking Channel, 2025-2035
  • Figure 78: Latin America Value (USD Million) by Country, 2025-2035
  • Figure 79: Latin America Value (USD Million) Analysis by Country, 2020-2035
  • Figure 80: Latin America Volume (Units) Analysis by Country, 2020-2035
  • Figure 81: Latin America Value Share (%) and BPS Analysis by Country, 2025-2035
  • Figure 82: Latin America Y-o-Y Growth (%) Projections by Country, 2025-2035
  • Figure 83: Latin America Value (USD Million) Analysis by Pet Type, 2020-2035
  • Figure 84: Latin America Volume (Units) Analysis by Pet Type, 2020-2035
  • Figure 85: Latin America Value Share (%) and BPS Analysis by Pet Type, 2025-2035
  • Figure 86: Latin America Y-o-Y Growth (%) Projections by Pet Type, 2025-2035
  • Figure 87: Latin America Value (USD Million) Analysis by Service Type, 2020-2035
  • Figure 88: Latin America Volume (Units) Analysis by Service Type, 2020-2035
  • Figure 89: Latin America Value Share (%) and BPS Analysis by Service Type, 2025-2035
  • Figure 90: Latin America Y-o-Y Growth (%) Projections by Service Type, 2025-2035
  • Figure 91: Latin America Value (USD Million) Analysis by Service Mode, 2020-2035
  • Figure 92: Latin America Volume (Units) Analysis by Service Mode, 2020-2035
  • Figure 93: Latin America Value Share (%) and BPS Analysis by Service Mode, 2025-2035
  • Figure 94: Latin America Y-o-Y Growth (%) Projections by Service Mode, 2025-2035
  • Figure 95: Latin America Value (USD Million) Analysis by Provider Type, 2020-2035
  • Figure 96: Latin America Volume (Units) Analysis by Provider Type, 2020-2035
  • Figure 97: Latin America Value Share (%) and BPS Analysis by Provider Type, 2025-2035
  • Figure 98: Latin America Y-o-Y Growth (%) Projections by Provider Type, 2025-2035
  • Figure 99: Latin America Value (USD Million) Analysis by Booking Channel, 2020-2035
  • Figure 100: Latin America Volume (Units) Analysis by Booking Channel, 2020-2035
  • Figure 101: Latin America Value Share (%) and BPS Analysis by Booking Channel, 2025-2035
  • Figure 102: Latin America Y-o-Y Growth (%) Projections by Booking Channel, 2025-2035
  • Figure 103: Latin America Attractiveness by Pet Type, 2025-2035
  • Figure 104: Latin America Attractiveness by Service Type, 2025-2035
  • Figure 105: Latin America Attractiveness by Service Mode, 2025-2035
  • Figure 106: Latin America Attractiveness by Provider Type, 2025-2035
  • Figure 107: Latin America Attractiveness by Booking Channel, 2025-2035
  • Figure 108: Latin America Attractiveness by Country, 2025-2035
  • Figure 109: Europe Value (USD Million) by Pet Type, 2025-2035
  • Figure 110: Europe Value (USD Million) by Service Type, 2025-2035
  • Figure 111: Europe Value (USD Million) by Service Mode, 2025-2035
  • Figure 112: Europe Value (USD Million) by Provider Type, 2025-2035
  • Figure 113: Europe Value (USD Million) by Booking Channel, 2025-2035
  • Figure 114: Europe Value (USD Million) by Country, 2025-2035
  • Figure 115: Europe Value (USD Million) Analysis by Country, 2020-2035
  • Figure 116: Europe Volume (Units) Analysis by Country, 2020-2035
  • Figure 117: Europe Value Share (%) and BPS Analysis by Country, 2025-2035
  • Figure 118: Europe Y-o-Y Growth (%) Projections by Country, 2025-2035
  • Figure 119: Europe Value (USD Million) Analysis by Pet Type, 2020-2035
  • Figure 120: Europe Volume (Units) Analysis by Pet Type, 2020-2035
  • Figure 121: Europe Value Share (%) and BPS Analysis by Pet Type, 2025-2035
  • Figure 122: Europe Y-o-Y Growth (%) Projections by Pet Type, 2025-2035
  • Figure 123: Europe Value (USD Million) Analysis by Service Type, 2020-2035
  • Figure 124: Europe Volume (Units) Analysis by Service Type, 2020-2035
  • Figure 125: Europe Value Share (%) and BPS Analysis by Service Type, 2025-2035
  • Figure 126: Europe Y-o-Y Growth (%) Projections by Service Type, 2025-2035
  • Figure 127: Europe Value (USD Million) Analysis by Service Mode, 2020-2035
  • Figure 128: Europe Volume (Units) Analysis by Service Mode, 2020-2035
  • Figure 129: Europe Value Share (%) and BPS Analysis by Service Mode, 2025-2035
  • Figure 130: Europe Y-o-Y Growth (%) Projections by Service Mode, 2025-2035
  • Figure 131: Europe Value (USD Million) Analysis by Provider Type, 2020-2035
  • Figure 132: Europe Volume (Units) Analysis by Provider Type, 2020-2035
  • Figure 133: Europe Value Share (%) and BPS Analysis by Provider Type, 2025-2035
  • Figure 134: Europe Y-o-Y Growth (%) Projections by Provider Type, 2025-2035
  • Figure 135: Europe Value (USD Million) Analysis by Booking Channel, 2020-2035
  • Figure 136: Europe Volume (Units) Analysis by Booking Channel, 2020-2035
  • Figure 137: Europe Value Share (%) and BPS Analysis by Booking Channel, 2025-2035
  • Figure 138: Europe Y-o-Y Growth (%) Projections by Booking Channel, 2025-2035
  • Figure 139: Europe Attractiveness by Pet Type, 2025-2035
  • Figure 140: Europe Attractiveness by Service Type, 2025-2035
  • Figure 141: Europe Attractiveness by Service Mode, 2025-2035
  • Figure 142: Europe Attractiveness by Provider Type, 2025-2035
  • Figure 143: Europe Attractiveness by Booking Channel, 2025-2035
  • Figure 144: Europe Attractiveness by Country, 2025-2035
  • Figure 145: East Asia Value (USD Million) by Pet Type, 2025-2035
  • Figure 146: East Asia Value (USD Million) by Service Type, 2025-2035
  • Figure 147: East Asia Value (USD Million) by Service Mode, 2025-2035
  • Figure 148: East Asia Value (USD Million) by Provider Type, 2025-2035
  • Figure 149: East Asia Value (USD Million) by Booking Channel, 2025-2035
  • Figure 150: East Asia Value (USD Million) by Country, 2025-2035
  • Figure 151: East Asia Value (USD Million) Analysis by Country, 2020-2035
  • Figure 152: East Asia Volume (Units) Analysis by Country, 2020-2035
  • Figure 153: East Asia Value Share (%) and BPS Analysis by Country, 2025-2035
  • Figure 154: East Asia Y-o-Y Growth (%) Projections by Country, 2025-2035
  • Figure 155: East Asia Value (USD Million) Analysis by Pet Type, 2020-2035
  • Figure 156: East Asia Volume (Units) Analysis by Pet Type, 2020-2035
  • Figure 157: East Asia Value Share (%) and BPS Analysis by Pet Type, 2025-2035
  • Figure 158: East Asia Y-o-Y Growth (%) Projections by Pet Type, 2025-2035
  • Figure 159: East Asia Value (USD Million) Analysis by Service Type, 2020-2035
  • Figure 160: East Asia Volume (Units) Analysis by Service Type, 2020-2035
  • Figure 161: East Asia Value Share (%) and BPS Analysis by Service Type, 2025-2035
  • Figure 162: East Asia Y-o-Y Growth (%) Projections by Service Type, 2025-2035
  • Figure 163: East Asia Value (USD Million) Analysis by Service Mode, 2020-2035
  • Figure 164: East Asia Volume (Units) Analysis by Service Mode, 2020-2035
  • Figure 165: East Asia Value Share (%) and BPS Analysis by Service Mode, 2025-2035
  • Figure 166: East Asia Y-o-Y Growth (%) Projections by Service Mode, 2025-2035
  • Figure 167: East Asia Value (USD Million) Analysis by Provider Type, 2020-2035
  • Figure 168: East Asia Volume (Units) Analysis by Provider Type, 2020-2035
  • Figure 169: East Asia Value Share (%) and BPS Analysis by Provider Type, 2025-2035
  • Figure 170: East Asia Y-o-Y Growth (%) Projections by Provider Type, 2025-2035
  • Figure 171: East Asia Value (USD Million) Analysis by Booking Channel, 2020-2035
  • Figure 172: East Asia Volume (Units) Analysis by Booking Channel, 2020-2035
  • Figure 173: East Asia Value Share (%) and BPS Analysis by Booking Channel, 2025-2035
  • Figure 174: East Asia Y-o-Y Growth (%) Projections by Booking Channel, 2025-2035
  • Figure 175: East Asia Attractiveness by Pet Type, 2025-2035
  • Figure 176: East Asia Attractiveness by Service Type, 2025-2035
  • Figure 177: East Asia Attractiveness by Service Mode, 2025-2035
  • Figure 178: East Asia Attractiveness by Provider Type, 2025-2035
  • Figure 179: East Asia Attractiveness by Booking Channel, 2025-2035
  • Figure 180: East Asia Attractiveness by Country, 2025-2035
  • Figure 181: South Asia & Pacific Value (USD Million) by Pet Type, 2025-2035
  • Figure 182: South Asia & Pacific Value (USD Million) by Service Type, 2025-2035
  • Figure 183: South Asia & Pacific Value (USD Million) by Service Mode, 2025-2035
  • Figure 184: South Asia & Pacific Value (USD Million) by Provider Type, 2025-2035
  • Figure 185: South Asia & Pacific Value (USD Million) by Booking Channel, 2025-2035
  • Figure 186: South Asia & Pacific Value (USD Million) by Country, 2025-2035
  • Figure 187: South Asia & Pacific Value (USD Million) Analysis by Country, 2020-2035
  • Figure 188: South Asia & Pacific Volume (Units) Analysis by Country, 2020-2035
  • Figure 189: South Asia & Pacific Value Share (%) and BPS Analysis by Country, 2025-2035
  • Figure 190: South Asia & Pacific Y-o-Y Growth (%) Projections by Country, 2025-2035
  • Figure 191: South Asia & Pacific Value (USD Million) Analysis by Pet Type, 2020-2035
  • Figure 192: South Asia & Pacific Volume (Units) Analysis by Pet Type, 2020-2035
  • Figure 193: South Asia & Pacific Value Share (%) and BPS Analysis by Pet Type, 2025-2035
  • Figure 194: South Asia & Pacific Y-o-Y Growth (%) Projections by Pet Type, 2025-2035
  • Figure 195: South Asia & Pacific Value (USD Million) Analysis by Service Type, 2020-2035
  • Figure 196: South Asia & Pacific Volume (Units) Analysis by Service Type, 2020-2035
  • Figure 197: South Asia & Pacific Value Share (%) and BPS Analysis by Service Type, 2025-2035
  • Figure 198: South Asia & Pacific Y-o-Y Growth (%) Projections by Service Type, 2025-2035
  • Figure 199: South Asia & Pacific Value (USD Million) Analysis by Service Mode, 2020-2035
  • Figure 200: South Asia & Pacific Volume (Units) Analysis by Service Mode, 2020-2035
  • Figure 201: South Asia & Pacific Value Share (%) and BPS Analysis by Service Mode, 2025-2035
  • Figure 202: South Asia & Pacific Y-o-Y Growth (%) Projections by Service Mode, 2025-2035
  • Figure 203: South Asia & Pacific Value (USD Million) Analysis by Provider Type, 2020-2035
  • Figure 204: South Asia & Pacific Volume (Units) Analysis by Provider Type, 2020-2035
  • Figure 205: South Asia & Pacific Value Share (%) and BPS Analysis by Provider Type, 2025-2035
  • Figure 206: South Asia & Pacific Y-o-Y Growth (%) Projections by Provider Type, 2025-2035
  • Figure 207: South Asia & Pacific Value (USD Million) Analysis by Booking Channel, 2020-2035
  • Figure 208: South Asia & Pacific Volume (Units) Analysis by Booking Channel, 2020-2035
  • Figure 209: South Asia & Pacific Value Share (%) and BPS Analysis by Booking Channel, 2025-2035
  • Figure 210: South Asia & Pacific Y-o-Y Growth (%) Projections by Booking Channel, 2025-2035
  • Figure 211: South Asia & Pacific Attractiveness by Pet Type, 2025-2035
  • Figure 212: South Asia & Pacific Attractiveness by Service Type, 2025-2035
  • Figure 213: South Asia & Pacific Attractiveness by Service Mode, 2025-2035
  • Figure 214: South Asia & Pacific Attractiveness by Provider Type, 2025-2035
  • Figure 215: South Asia & Pacific Attractiveness by Booking Channel, 2025-2035
  • Figure 216: South Asia & Pacific Attractiveness by Country, 2025-2035
  • Figure 217: Middle East and Africa Value (USD Million) by Pet Type, 2025-2035
  • Figure 218: Middle East and Africa Value (USD Million) by Service Type, 2025-2035
  • Figure 219: Middle East and Africa Value (USD Million) by Service Mode, 2025-2035
  • Figure 220: Middle East and Africa Value (USD Million) by Provider Type, 2025-2035
  • Figure 221: Middle East and Africa Value (USD Million) by Booking Channel, 2025-2035
  • Figure 222: Middle East and Africa Value (USD Million) by Country, 2025-2035
  • Figure 223: Middle East and Africa Value (USD Million) Analysis by Country, 2020-2035
  • Figure 224: Middle East and Africa Volume (Units) Analysis by Country, 2020-2035
  • Figure 225: Middle East and Africa Value Share (%) and BPS Analysis by Country, 2025-2035
  • Figure 226: Middle East and Africa Y-o-Y Growth (%) Projections by Country, 2025-2035
  • Figure 227: Middle East and Africa Value (USD Million) Analysis by Pet Type, 2020-2035
  • Figure 228: Middle East and Africa Volume (Units) Analysis by Pet Type, 2020-2035
  • Figure 229: Middle East and Africa Value Share (%) and BPS Analysis by Pet Type, 2025-2035
  • Figure 230: Middle East and Africa Y-o-Y Growth (%) Projections by Pet Type, 2025-2035
  • Figure 231: Middle East and Africa Value (USD Million) Analysis by Service Type, 2020-2035
  • Figure 232: Middle East and Africa Volume (Units) Analysis by Service Type, 2020-2035
  • Figure 233: Middle East and Africa Value Share (%) and BPS Analysis by Service Type, 2025-2035
  • Figure 234: Middle East and Africa Y-o-Y Growth (%) Projections by Service Type, 2025-2035
  • Figure 235: Middle East and Africa Value (USD Million) Analysis by Service Mode, 2020-2035
  • Figure 236: Middle East and Africa Volume (Units) Analysis by Service Mode, 2020-2035
  • Figure 237: Middle East and Africa Value Share (%) and BPS Analysis by Service Mode, 2025-2035
  • Figure 238: Middle East and Africa Y-o-Y Growth (%) Projections by Service Mode, 2025-2035
  • Figure 239: Middle East and Africa Value (USD Million) Analysis by Provider Type, 2020-2035
  • Figure 240: Middle East and Africa Volume (Units) Analysis by Provider Type, 2020-2035
  • Figure 241: Middle East and Africa Value Share (%) and BPS Analysis by Provider Type, 2025-2035
  • Figure 242: Middle East and Africa Y-o-Y Growth (%) Projections by Provider Type, 2025-2035
  • Figure 243: Middle East and Africa Value (USD Million) Analysis by Booking Channel, 2020-2035
  • Figure 244: Middle East and Africa Volume (Units) Analysis by Booking Channel, 2020-2035
  • Figure 245: Middle East and Africa Value Share (%) and BPS Analysis by Booking Channel, 2025-2035
  • Figure 246: Middle East and Africa Y-o-Y Growth (%) Projections by Booking Channel, 2025-2035
  • Figure 247: Middle East and Africa Attractiveness by Pet Type, 2025-2035
  • Figure 248: Middle East and Africa Attractiveness by Service Type, 2025-2035
  • Figure 249: Middle East and Africa Attractiveness by Service Mode, 2025-2035
  • Figure 250: Middle East and Africa Attractiveness by Provider Type, 2025-2035
  • Figure 251: Middle East and Africa Attractiveness by Booking Channel, 2025-2035
  • Figure 252: Middle East and Africa Attractiveness by Country, 2025-2035

Frequently Asked Questions

How big is the Mobile Grooming Services Market in 2025?

The global Mobile Grooming Services Market is estimated to be valued at USD 2,376.0 Million in 2025.

What will be the size of Mobile Grooming Services Market in 2035?

The market size for the Mobile Grooming Services Market is projected to reach USD 7,577.5 Million by 2035.

How much will be the Mobile Grooming Services Market growth between 2025 and 2035?

The Mobile Grooming Services Market is expected to grow at a 12.3% CAGR between 2025 and 2035.

What are the key Services types in the Mobile Grooming Services Market?

The key Services types in Mobile Grooming Services Market are Full groom / haircut, Bath & brush, De-shedding / undercoat, Add-ons (nails, ears, teeth), Medicated / flea-tick care

Which Pet Type segment to contribute significant share in the Mobile Grooming Services Market in 2025?

In terms of Pet Type, Dogs segment to command 75.7% share in the Mobile Grooming Services Market in 2025.

Explore Similar Insights

Future Market Insights

Mobile Grooming Services Market