Reports

- Global Locations -

Headquarters

Future Market Insights, Inc.

Christiana Corporate, 200
Continental Drive, Suite 401,
Newark, Delaware - 19713,
United States

T: +1-845-579-5705

Americas

Future Market Insights, Inc.

616 Corporate Way, Suite 2-9018,
Valley Cottage, NY 10989, United States

T: +1-347-918-3531

MEA

Future Market Insights

1602-6 Jumeirah Bay X2 Tower, Plot No: JLT-PH2-X2A,
Jumeirah Lakes Towers, Dubai,
United Arab Emirates

Europe

Future Market Insights

3rd Floor, 207 Regent Street,
W1B 3HH London
United Kingdom

T: + 44 (0) 20 8123 9659
D: +44 (0) 20 3287 4268

Asia Pacific

Future Market Insights

IndiaLand Global Tech Park, Unit UG-1, Behind Grand HighStreet, Phase 1, Hinjawadi, MH, Pune – 411057, India

Mucosal Atomization Device Market Outlook from 2024 to 2034

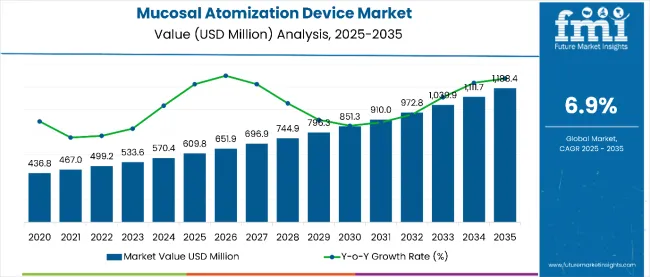
The mucosal atomization device market is expected to develop at a modest CAGR of 6.9% between 2024 and 2034, increasing from US$ 570.52 million in 2024 to US$ 1.11 billion by 2034.

The non-invasive medication administration mechanism, user-friendliness, and versatility of mucosal atomization devices in medical operations attract individuals to the market. The demand for mucosal atomization devices is anticipated to increase significantly over the next ten years due to:

  • Patient comfort and safety are becoming more important concerns
  • Growing applications in emergency medicine and pain treatment
  • The adoption of needle-free medication delivery techniques
  • Technological improvements in these devices
  • Rising healthcare costs across multiple countries
Attributes Details
Estimated Mucosal Atomization Device Market Value in 2024 US$ 570.52 million
Forecasted Market Value by 2034 US$ 1.11 billion
Projected Market CAGR from 2024 to 2034 6.9%

Don't pay for what you don't need

Customize your report by selecting specific countries or regions and save 30%!

Consumption Analysis of Mucosal Atomization Devices

  • The mucosal atomization device market is expanding due to sinusitis incidence, demand for non-invasive procedures, device adoption, technological advancements, and increasing demand for these devices.
  • Given several benefits, including quick drug delivery to circulation, non-invasiveness, lack of first-pass metabolism, and simplicity of administration, the market for mucosal atomization devices continues to grow in the forthcoming decade.
  • Due to its non-invasiveness, reduced discomfort, and quicker recovery time than conventional needle-based injectable drug delivery techniques, mucosal atomization devices are becoming increasingly common, driving demand for their development.
  • The mucosal atomization device market is being propelled forward by the growing emphasis of device manufacturers on healthcare systems based on value in developing countries.
  • Technological developments in the healthcare industry propel the demand for mucosal atomization devices. The enhanced usability and bioavailability data these devices provide are anticipated to speed up their adoption rate in the coming decade.

Mucosal Atomization Device Market Restraints

Mucosal atomization device business performance score value is partly driven down by an increase in product recalls brought on by the device's inadequate ability to deliver a drug plume into the mucosal layer. Other crucial factors that are anticipated to disturb the demand for mucosal atomization devices through 2034 include:

  • The mucosal atomization device industry faces obstacles such as the high expense of creating novel therapeutic compounds and the requirement for research on surfactant toxicity. This causes the BPS value of mucosal atomization devices to decrease.
  • The rising incidence of product recalls significantly impacts the increasing incidence of product signs due to their inability to introduce a medicine plume into the mucosal layer.
  • The recall of some mucosal atomization devices because of faults is another issue impeding the market's growth.

In the subsequent period, mucosal atomization devices are anticipated to function well with advancements and expand promisingly despite obstacles, offering new business prospects for market players. Industry participants are going to desire to be wise and flexible over the anticipated period since these challenging attributes position the industry for success in the upcoming years.

Sabyasachi Ghosh
Sabyasachi Ghosh

Principal Consultant

Talk to Analyst

Find your sweet spots for generating winning opportunities in this market.

Historical Performance and Future Growth of the Mucosal Atomization Device Market

With an emphasis on the anticipated trends in the mucosal atomization device market, this section offers a thorough review of the industry during the previous five years. The market's historical CAGR has been a strong 6.4%, and it is becoming increasingly widespread. Through 2034, the mucosal atomization device industry is expected to grow consistently at a 6.9% CAGR.

Historical CAGR (2019 to 2023) 6.4%
Forecast CAGR (2024 to 2034) 6.9%

Growth in the market is expected to be aided by favorable regulatory environments and the licensing of mucosal atomization devices for use in new areas or applications.

The market's potential is likely to be enhanced by intensifying research and development into novel applications of mucosal atomization devices, including immunizations and chronic medication administration. The rise in telemedicine and home healthcare services has led to a growing demand for portable, user-friendly medical devices, including home-use mucosal atomization devices.

Technological advancements in mucosal atomization devices, including intelligent functionalities and improved delivery systems, are anticipated to lead to new market opportunities. The demand for cutting-edge medical equipment like mucosal atomization is predicted to rise because of the ongoing global growth in healthcare spending and the increased focus on patient-centric treatment.

Key Trends Influencing the Mucosal Atomization Device Market Expansion

Emphasis on Needle-free Drug Delivery Systems Booms the Demand for Mucosal Atomization Devices

The mucosal atomization device market is greatly influenced by the increasing inclination toward needle-free medication administration techniques. Devices without needles provide several benefits, such as less discomfort, increased patient comfort, and a lower chance of needlestick injuries and related infections. By administering drugs directly to mucous membranes, mucosal atomization devices offer a non-invasive and effective way to promote quick absorption and onset of action.

A growing number of medical specializations and healthcare infrastructures are adopting mucosal atomization devices due to their convenience, safety, and effectiveness, which appeal to patients seeking alternatives to traditional injection approaches.

Revolution in Sonic Nebulization Propels the Mucosal Atomization Device Market Growth

Nasal atomization has advanced significantly due to technological developments in acoustic nebulization and mucosal atomization devices, making it a sought-after trend in the global market. These advancements have led to the development of devices capable of generating fine aerosol particles with precise control and efficiency.

By leveraging sonic energy or innovative atomization mechanisms, these devices ensure optimal drug delivery to mucous membranes, enhancing absorption and therapeutic outcomes. Healthcare providers and patients alike are increasingly drawn to these advanced devices due to their ability to deliver medications effectively while minimizing discomfort and inconvenience associated with traditional delivery methods.

The tendency mentioned above emphasizes the significance of keeping up with technological advancements to satisfy the changing needs of the healthcare sector and promote better patient care and treatment efficacy in the mucosal atomization device market.

The Commonness of Allergic Rhinitis Draws the Mucosal Automation Device Industry to Growth

The mucosal atomization device market is expected to develop significantly due to the global increase in allergic rhinitis cases. Allergens such as dust, pollen, or animal dander can cause various nose symptoms, including allergic rhinitis.

Mucosal atomization devices are essential for treating chronic rhinosinusitis because they provide drugs like budesonide, a topical nasal steroid spray, for managing allergic rhinitis. Due to the rising incidence of allergic rhinitis globally, there is an increasing need for efficient and practical medication delivery systems to reduce symptoms and enhance patient outcomes.

With mucosal atomization devices, drugs may be effectively and non-invasively delivered straight to the nasal mucosa. This has resulted in quick absorption and focused alleviation. Due to the increasing incidence of allergic rhinitis, mucosal atomization devices are becoming increasingly relevant, propelling their acceptance and global market expansion.

Get the data you need at a Fraction of the cost

Personalize your report by choosing insights you need
and save 40%!

Comparative View of the Adjacent Mucosal Atomization Device Market

The following section contrasts and compares the mucosal atomization device market with the nasal packing device market and the respiratory inhaler device market. Focusing on each market's key trends, potential, and compound annual growth rate, the study covers the growth potentials of each market from 2024 through 2034.

Mucosal Atomization Device Market:

Attributes Mucosal Atomization Device Market
CAGR (2024 to 2034) 6.9%
Opportunity Development of novel formulations compatible with mucosal atomization devices to cater to diverse therapeutic areas
Key Trend Growing demand for needle-free drug delivery systems, especially in pediatric and geriatric populations

Nasal Packing Device Market:

Attributes Nasal Packing Device Market
CAGR (2024 to 2034) 5.1%
Opportunity Advancements in materials and design for the development of more comfortable and effective packing devices
Key Trend Growing preference for biodegradable and resorbable packing materials to minimize patient discomfort and complications

Respiratory Inhaler Device Market:

Attributes Respiratory Inhaler Device Market
CAGR (2024 to 2034) 4.9%
Opportunity Rising preference for portable and pocket-sized inhalers for convenient use, particularly among on-the-go patients
Key Trend Shift toward digital inhaler devices with features such as dose tracking and reminders to improve patient adherence

Category-wise Insights

Comprehensive market assessments of specific mucosal atomization device segments are provided in this section. The two primary subjects of the research are the nasal atomization device sector and the hospital segment. This section aims to provide a deeper understanding of these sectors and their significance within the broader context of the mucosal atomization device industry through thorough investigation.

Demand for Nasal Atomization Devices Skyrockets in the Mucosal Atomization Device Industry

Attributes Details
Top Product Nasal Atomization Device
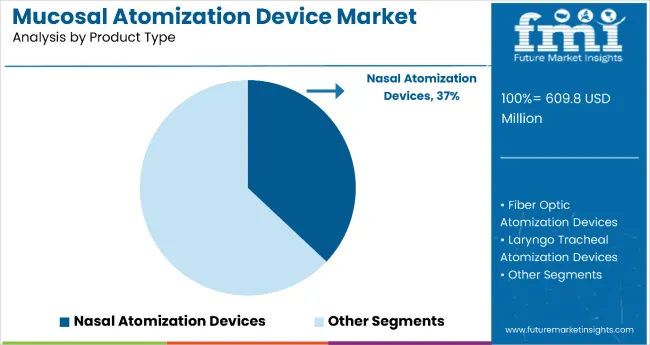
Market Share in 2024 35.09%

Nasal atomization devices are predicted to hold the maximum share of 35.09% by product type among mucosal atomization devices in 2024. The development of the nasal atomization device segment can be explained by the following drivers:

  • The most often utilized administration method is the nasal route. Therefore, the demand for nasal atomization devices is projected to expand significantly.
  • The mucosal atomization device market is likely to rise as more medications in the form of nasal atomizers become available. For instance, In Louisiana, an online marketplace offers a nasal atomizer form of Naloxone, a medication recognized for its ability to mitigate the adverse effects of an opioid overdose.
  • Increased research on the use of nasal devices is projected to present significant prospects for the segment's development in the global mucosal atomization device market.

Demand for Mucosal Atomization Devices Develops Rapidly In Hospitals

Attributes Details
Top End User Hospitals
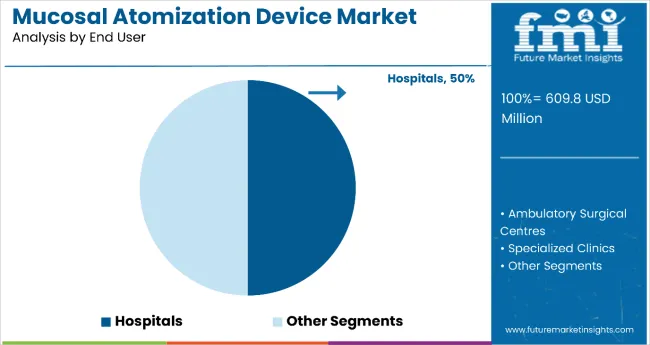
Market Share in 2024 36.77%

Among end users, the hospital segment is expected to have a prime share of 36.77% in the global mucosal atomization device market by 2024. There are several factors that have contributed to the development of remote sensing technology for mucosal atomization devices:

  • The mucosal atomization device market is expected to experience a surge in demand, particularly in developed countries, due to the increasing number of hospitals.
  • The presence of well-established infrastructure and advanced equipment also supports the growth of the hospital segment.
  • The rising number of hospital patient admissions is leading to increased usage of these devices in hospitals, further contributing to the growth of the mucosal atomization device industry.

Country-wise Insights

In this section, the focus shifts to the global stage, with particular attention on the United Kingdom, China, and India. Their respective mucosal atomization device markets and potential are examined, shedding light on the factors influencing these countries' demand for, acceptance of, and interactions with such devices.

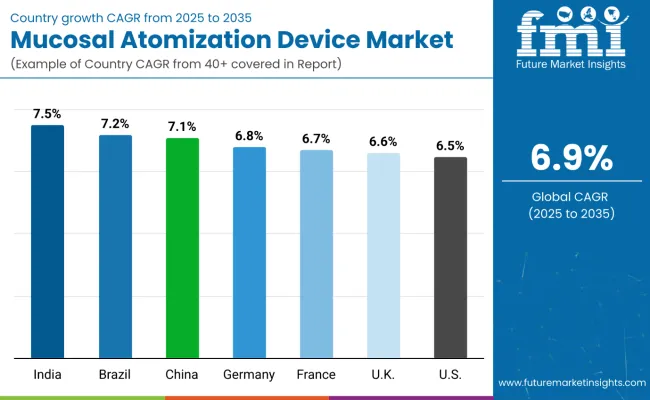
Countries Forecasted CAGR from 2024 to 2034
United Kingdom 6.70%
China 7.10%
India 7.50%

China’s Healthcare Infrastructure Booms the Demand for Mucosal Atomization Procedures

The mucosal atomization device market in China's healthcare system is likely to grow at a moderate pace of 7.10% between 2024 and 2034. Some of the primary trends are:

  • The mucosal atomization device industry in China is driven by various factors, including an aging patient population, an increase in allergic rhinitis cases, and the development of several local producers.
  • According to a recent study conducted by the Chinese Society of Allergy and the Chinese Society of Otorhinolaryngology-Head and Neck Surgery, Rhinology Group in 2020, nearly 8% of adults in the country suffer from chronic rhinosinusitis, which means that approximately 107 million individuals in China are affected by this condition.
  • As per the World Health Organization (WHO), the elderly population in China constitutes around 12% of the total population, and it is projected to grow to 28% by 2040. Since older people are more vulnerable to nasal allergies, the rise in the elderly population and the persistent prevalence of chronic rhinosinusitis are expected to boost the demand for mucosal atomization devices in China.

The United Kingdom Patient-centric Approach Spirals the Intranasal Atomization Device Demand

From 2024 to 2034, the market in the United Kingdom is predicted to grow at a modest CAGR of 6.70%. The United Kingdom's mucosal atomization device market is projected to lead the Western Europe healthcare market. The following are some significant patterns illustrating the advancement of mucosal atomization devices in the United Kingdom:

  • Non-invasive medication delivery systems are becoming more popular because of the United Kingdom government's increased investment in healthcare infrastructure and technology.
  • These techniques are becoming increasingly common in the United Kingdom and are especially sought after for treating chronic conditions requiring nasal medication delivery.
  • The focus is on enhancing patient comfort and adherence to medical treatments, which has prompted cooperation between medical professionals and device makers to advance intranasal atomization technology in the United Kingdom.

India’s Pain Administration Industry Dominates Global Mucosal Atomization Device Demand

India's demand for mucosal atomization devices is predicted to grow between 2024 and 2034 at an average CAGR of about 7.50%. The adoption of mucosal atomization devices is anticipated to increase sharply in the Indian pain management sector. The following are some of the primary drivers:

  • India is predicted to become an emerging nation due to rising research and development spending, healthcare costs, and the introduction of novel and inventive products.
  • The government's initiatives to provide better healthcare facilities with contemporary methods that demand less suffering and more efficiency help the Indian market grow.
  • The mucosal atomization device market in India is also expanding due to the growing prevalence of allergic rhinosinusitis and the requirement for precise dosage.

Establishments Shaping the Outlook of the Mucosal Atomization Device Industry

Market players play a pivotal role in shaping the outlook of the mucosal atomization device industry through their strategic initiatives, technological innovations, and market activities.

These companies continuously invest in research and development to enhance the efficiency, precision, and safety of mucosal atomization devices, driving advancements in drug delivery technology. The firms are anticipated to engage in strategic alliances and collaborations to expand their product portfolios, penetrate new markets, and effectively address evolving customer needs.

Mucosal atomization device companies actively participate in regulatory compliance efforts to ensure their products meet stringent quality and safety standards, enhancing consumer trust and confidence in the healthcare industry. By emphasizing patient-centric techniques and being aware of the distinct needs of healthcare providers and consumers, these businesses create customized medications that provide better user comfort and boost health performance.

Industry participants support the expansion of the market by informing consumers and medical professionals about the advantages of mucosal atomization devices and encouraging their acceptance and use in a range of settings and specializations. These participants' proactive efforts and innovations make improved patient care and treatment results possible and play a major role in propelling the growth and development of the mucosal atomization device industry.

Recent Developments in the Mucosal Atomization Device Industry

  • In February 2024, the MDIC Data Standardization Working Group launched a project to develop and promote In Vitro Diagnostic (IVD) data standards for regulatory submission. The project focuses on clinical trial data to propose common standards.
  • In December 2023, The United States Food and Drug Administration (FDA) published draft guidance on the use of real-world data (RWD) in the evaluation of medical devices, potentially impacting the approval process for new mucosal atomization devices.
  • In January 2023, Aptar Pharma, a global leader in drug delivery systems, launched APF Futurity, its first metal-free, multidose nasal spray pump designed for recyclability. The highly recyclable pump has achieved a Class AA certification from cyclos-HTP for European recycling streams.

Key Companies in the Mucosal Atomization Device Market

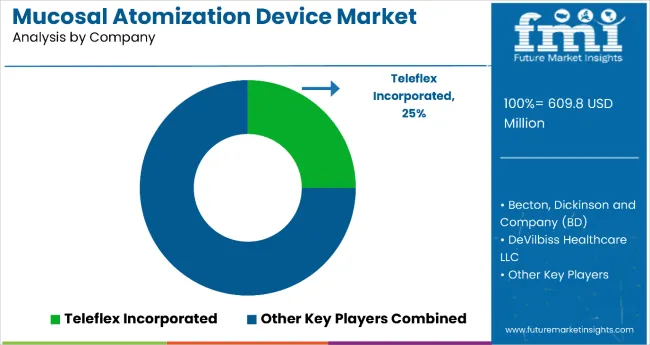
  • Teleflex Incorporated
  • LMA North America Inc.
  • Medtronic plc
  • HealthFirst Corporation
  • VBM Medizintechnik GmbH
  • DeVilbiss Healthcare LLC
  • Cook Medical
  • Medica Holdings, LLC.

Key Coverage in the Mucosal Atomization Device Market Report

  • Nasal Antihistamines Industry Forecast Assessments
  • Analysis of Intranasal Administration Pricing Strategy
  • Innovations in Drug Deposition Efficiency
  • Analysis of MAD Nasal-Mucosal Atomization Device Pricing in the United States
  • Latest Development of Mucosal Atomization Device Medications
  • Current Nasal Drug Delivery Device Trends
  • Expense Analysis of MAD Nasal Intranasal Mucosal Atomization Device without Syringe Mad300

Key Segments

By Product Type:

  • Nasal Atomization Device
  • Fiber Optic Atomization Device
  • Laryngo Tracheal Atomization Device
  • Bottle Atomizers

By Technology:

  • Gas Propelled Atomization Device
  • Electrical Atomization Device

By End User:

  • Hospitals
  • Ambulatory Surgical Centers
  • Specialized Clinics

By Region:

  • North America
  • Latin America
  • Europe
  • East Asia
  • South Asia
  • Oceania
  • Middle East and Africa

Frequently Asked Questions

How Big is the Mucosal Atomization Device Market?

The market is expected to be valued at US$ 570.52 million in 2024.

Which is the top mucosal atomization device type?

The nasal atomization device leads the mucosal atomization device market.

What was the Sales Outlook of Mucosal Atomization Devices from 2018 to 2023?

Sales of mucosal atomization devices developed at a CAGR of 6.4% between 2018 and 2023.

What is the Mucosal Atomization Device Market Growth Outlook for 2034?

The market is anticipated to surpass US$ 1.11 billion by 2034.

What is the Projected Growth Rate for the Mucosal Atomization Device Market from 2024 to 2034?

The mucosal atomization device industry is anticipated to develop at a CAGR of 6.9% from 2024 to 2034.

Table of Content

1. Executive Summary

    1.1. Global Market Outlook

    1.2. Demand-side Trends

    1.3. Supply-side Trends

    1.4. Technology Roadmap Analysis

    1.5. Analysis and Recommendations

2. Market Overview

    2.1. Market Coverage / Taxonomy

    2.2. Market Definition / Scope / Limitations

3. Market Background

    3.1. Market Dynamics

        3.1.1. Drivers

        3.1.2. Restraints

        3.1.3. Opportunity

        3.1.4. Trends

    3.2. Scenario Forecast

        3.2.1. Demand in Optimistic Scenario

        3.2.2. Demand in Likely Scenario

        3.2.3. Demand in Conservative Scenario

    3.3. Opportunity Map Analysis

    3.4. Product Life Cycle Analysis

    3.5. Supply Chain Analysis

        3.5.1. Supply Side Participants and their Roles

            3.5.1.1. Producers

            3.5.1.2. Mid-Level Participants (Traders/ Agents/ Brokers)

            3.5.1.3. Wholesalers and Distributors

        3.5.2. Value Added and Value Created at Node in the Supply Chain

        3.5.3. List of Raw Material Suppliers

        3.5.4. List of Existing and Potential Buyer’s

    3.6. Investment Feasibility Matrix

    3.7. Value Chain Analysis

        3.7.1. Profit Margin Analysis

        3.7.2. Wholesalers and Distributors

        3.7.3. Retailers

    3.8. PESTLE and Porter’s Analysis

    3.9. Regulatory Landscape

        3.9.1. By Key Regions

        3.9.2. By Key Countries

    3.10. Regional Parent Market Outlook

    3.11. Production and Consumption Statistics

    3.12. Import and Export Statistics

4. Global Market Analysis 2019 to 2023 and Forecast, 2024 to 2034

    4.1. Historical Market Size Value (US$ Million) & Volume (Units) Analysis, 2019 to 2023

    4.2. Current and Future Market Size Value (US$ Million) & Volume (Units) Projections, 2024 to 2034

        4.2.1. Y-o-Y Growth Trend Analysis

        4.2.2. Absolute $ Opportunity Analysis

5. Global Market Analysis 2019 to 2023 and Forecast 2024 to 2034, By Product Type

    5.1. Introduction / Key Findings

    5.2. Historical Market Size Value (US$ Million) & Volume (Units) Analysis By Product Type, 2019 to 2023

    5.3. Current and Future Market Size Value (US$ Million) & Volume (Units) Analysis and Forecast By Product Type, 2024 to 2034

        5.3.1. Nasal Atomization Devices

        5.3.2. Fiber Optic Atomization Devices

        5.3.3. Laryngo Tracheal Atomization Devices

        5.3.4. Bottle Atomizers

    5.4. Y-o-Y Growth Trend Analysis By Product Type, 2019 to 2023

    5.5. Absolute $ Opportunity Analysis By Product Type, 2024 to 2034

6. Global Market Analysis 2019 to 2023 and Forecast 2024 to 2034, By Technology

    6.1. Introduction / Key Findings

    6.2. Historical Market Size Value (US$ Million) & Volume (Units) Analysis By Technology, 2019 to 2023

    6.3. Current and Future Market Size Value (US$ Million) & Volume (Units) Analysis and Forecast By Technology, 2024 to 2034

        6.3.1. Gas Propelled Atomization Devices

        6.3.2. Electrical Atomization Devices

    6.4. Y-o-Y Growth Trend Analysis By Technology, 2019 to 2023

    6.5. Absolute $ Opportunity Analysis By Technology, 2024 to 2034

7. Global Market Analysis 2019 to 2023 and Forecast 2024 to 2034, By End User

    7.1. Introduction / Key Findings

    7.2. Historical Market Size Value (US$ Million) & Volume (Units) Analysis By End User, 2019 to 2023

    7.3. Current and Future Market Size Value (US$ Million) & Volume (Units) Analysis and Forecast By End User, 2024 to 2034

        7.3.1. Hospitals

        7.3.2. Ambulatory Surgical Centres

        7.3.3. Specialized Clinics

    7.4. Y-o-Y Growth Trend Analysis By End User, 2019 to 2023

    7.5. Absolute $ Opportunity Analysis By End User, 2024 to 2034

8. Global Market Analysis 2019 to 2023 and Forecast 2024 to 2034, By Region

    8.1. Introduction

    8.2. Historical Market Size Value (US$ Million) & Volume (Units) Analysis By Region, 2019 to 2023

    8.3. Current Market Size Value (US$ Million) & Volume (Units) Analysis and Forecast By Region, 2024 to 2034

        8.3.1. North America

        8.3.2. Latin America

        8.3.3. Western Europe

        8.3.4. Eastern Europe

        8.3.5. South Asia and Pacific

        8.3.6. East Asia

        8.3.7. Middle East and Africa

    8.4. Market Attractiveness Analysis By Region

9. North America Market Analysis 2019 to 2023 and Forecast 2024 to 2034, By Country

    9.1. Historical Market Size Value (US$ Million) & Volume (Units) Trend Analysis By Market Taxonomy, 2019 to 2023

    9.2. Market Size Value (US$ Million) & Volume (Units) Forecast By Market Taxonomy, 2024 to 2034

        9.2.1. By Country

            9.2.1.1. USA

            9.2.1.2. Canada

        9.2.2. By Product Type

        9.2.3. By Technology

        9.2.4. By End User

    9.3. Market Attractiveness Analysis

        9.3.1. By Country

        9.3.2. By Product Type

        9.3.3. By Technology

        9.3.4. By End User

    9.4. Key Takeaways

10. Latin America Market Analysis 2019 to 2023 and Forecast 2024 to 2034, By Country

    10.1. Historical Market Size Value (US$ Million) & Volume (Units) Trend Analysis By Market Taxonomy, 2019 to 2023

    10.2. Market Size Value (US$ Million) & Volume (Units) Forecast By Market Taxonomy, 2024 to 2034

        10.2.1. By Country

            10.2.1.1. Brazil

            10.2.1.2. Mexico

            10.2.1.3. Rest of Latin America

        10.2.2. By Product Type

        10.2.3. By Technology

        10.2.4. By End User

    10.3. Market Attractiveness Analysis

        10.3.1. By Country

        10.3.2. By Product Type

        10.3.3. By Technology

        10.3.4. By End User

    10.4. Key Takeaways

11. Western Europe Market Analysis 2019 to 2023 and Forecast 2024 to 2034, By Country

    11.1. Historical Market Size Value (US$ Million) & Volume (Units) Trend Analysis By Market Taxonomy, 2019 to 2023

    11.2. Market Size Value (US$ Million) & Volume (Units) Forecast By Market Taxonomy, 2024 to 2034

        11.2.1. By Country

            11.2.1.1. Germany

            11.2.1.2. UK

            11.2.1.3. France

            11.2.1.4. Spain

            11.2.1.5. Italy

            11.2.1.6. Rest of Western Europe

        11.2.2. By Product Type

        11.2.3. By Technology

        11.2.4. By End User

    11.3. Market Attractiveness Analysis

        11.3.1. By Country

        11.3.2. By Product Type

        11.3.3. By Technology

        11.3.4. By End User

    11.4. Key Takeaways

12. Eastern Europe Market Analysis 2019 to 2023 and Forecast 2024 to 2034, By Country

    12.1. Historical Market Size Value (US$ Million) & Volume (Units) Trend Analysis By Market Taxonomy, 2019 to 2023

    12.2. Market Size Value (US$ Million) & Volume (Units) Forecast By Market Taxonomy, 2024 to 2034

        12.2.1. By Country

            12.2.1.1. Poland

            12.2.1.2. Russia

            12.2.1.3. Czech Republic

            12.2.1.4. Romania

            12.2.1.5. Rest of Eastern Europe

        12.2.2. By Product Type

        12.2.3. By Technology

        12.2.4. By End User

    12.3. Market Attractiveness Analysis

        12.3.1. By Country

        12.3.2. By Product Type

        12.3.3. By Technology

        12.3.4. By End User

    12.4. Key Takeaways

13. South Asia and Pacific Market Analysis 2019 to 2023 and Forecast 2024 to 2034, By Country

    13.1. Historical Market Size Value (US$ Million) & Volume (Units) Trend Analysis By Market Taxonomy, 2019 to 2023

    13.2. Market Size Value (US$ Million) & Volume (Units) Forecast By Market Taxonomy, 2024 to 2034

        13.2.1. By Country

            13.2.1.1. India

            13.2.1.2. Bangladesh

            13.2.1.3. Australia

            13.2.1.4. New Zealand

            13.2.1.5. Rest of South Asia and Pacific

        13.2.2. By Product Type

        13.2.3. By Technology

        13.2.4. By End User

    13.3. Market Attractiveness Analysis

        13.3.1. By Country

        13.3.2. By Product Type

        13.3.3. By Technology

        13.3.4. By End User

    13.4. Key Takeaways

14. East Asia Market Analysis 2019 to 2023 and Forecast 2024 to 2034, By Country

    14.1. Historical Market Size Value (US$ Million) & Volume (Units) Trend Analysis By Market Taxonomy, 2019 to 2023

    14.2. Market Size Value (US$ Million) & Volume (Units) Forecast By Market Taxonomy, 2024 to 2034

        14.2.1. By Country

            14.2.1.1. China

            14.2.1.2. Japan

            14.2.1.3. South Korea

        14.2.2. By Product Type

        14.2.3. By Technology

        14.2.4. By End User

    14.3. Market Attractiveness Analysis

        14.3.1. By Country

        14.3.2. By Product Type

        14.3.3. By Technology

        14.3.4. By End User

    14.4. Key Takeaways

15. Middle East and Africa Market Analysis 2019 to 2023 and Forecast 2024 to 2034, By Country

    15.1. Historical Market Size Value (US$ Million) & Volume (Units) Trend Analysis By Market Taxonomy, 2019 to 2023

    15.2. Market Size Value (US$ Million) & Volume (Units) Forecast By Market Taxonomy, 2024 to 2034

        15.2.1. By Country

            15.2.1.1. GCC Countries

            15.2.1.2. South Africa

            15.2.1.3. Israel

            15.2.1.4. Rest of MEA

        15.2.2. By Product Type

        15.2.3. By Technology

        15.2.4. By End User

    15.3. Market Attractiveness Analysis

        15.3.1. By Country

        15.3.2. By Product Type

        15.3.3. By Technology

        15.3.4. By End User

    15.4. Key Takeaways

16. Key Countries Market Analysis

    16.1. USA

        16.1.1. Pricing Analysis

        16.1.2. Market Share Analysis, 2023

            16.1.2.1. By Product Type

            16.1.2.2. By Technology

            16.1.2.3. By End User

    16.2. Canada

        16.2.1. Pricing Analysis

        16.2.2. Market Share Analysis, 2023

            16.2.2.1. By Product Type

            16.2.2.2. By Technology

            16.2.2.3. By End User

    16.3. Brazil

        16.3.1. Pricing Analysis

        16.3.2. Market Share Analysis, 2023

            16.3.2.1. By Product Type

            16.3.2.2. By Technology

            16.3.2.3. By End User

    16.4. Mexico

        16.4.1. Pricing Analysis

        16.4.2. Market Share Analysis, 2023

            16.4.2.1. By Product Type

            16.4.2.2. By Technology

            16.4.2.3. By End User

    16.5. Germany

        16.5.1. Pricing Analysis

        16.5.2. Market Share Analysis, 2023

            16.5.2.1. By Product Type

            16.5.2.2. By Technology

            16.5.2.3. By End User

    16.6. UK

        16.6.1. Pricing Analysis

        16.6.2. Market Share Analysis, 2023

            16.6.2.1. By Product Type

            16.6.2.2. By Technology

            16.6.2.3. By End User

    16.7. France

        16.7.1. Pricing Analysis

        16.7.2. Market Share Analysis, 2023

            16.7.2.1. By Product Type

            16.7.2.2. By Technology

            16.7.2.3. By End User

    16.8. Spain

        16.8.1. Pricing Analysis

        16.8.2. Market Share Analysis, 2023

            16.8.2.1. By Product Type

            16.8.2.2. By Technology

            16.8.2.3. By End User

    16.9. Italy

        16.9.1. Pricing Analysis

        16.9.2. Market Share Analysis, 2023

            16.9.2.1. By Product Type

            16.9.2.2. By Technology

            16.9.2.3. By End User

    16.10. Poland

        16.10.1. Pricing Analysis

        16.10.2. Market Share Analysis, 2023

            16.10.2.1. By Product Type

            16.10.2.2. By Technology

            16.10.2.3. By End User

    16.11. Russia

        16.11.1. Pricing Analysis

        16.11.2. Market Share Analysis, 2023

            16.11.2.1. By Product Type

            16.11.2.2. By Technology

            16.11.2.3. By End User

    16.12. Czech Republic

        16.12.1. Pricing Analysis

        16.12.2. Market Share Analysis, 2023

            16.12.2.1. By Product Type

            16.12.2.2. By Technology

            16.12.2.3. By End User

    16.13. Romania

        16.13.1. Pricing Analysis

        16.13.2. Market Share Analysis, 2023

            16.13.2.1. By Product Type

            16.13.2.2. By Technology

            16.13.2.3. By End User

    16.14. India

        16.14.1. Pricing Analysis

        16.14.2. Market Share Analysis, 2023

            16.14.2.1. By Product Type

            16.14.2.2. By Technology

            16.14.2.3. By End User

    16.15. Bangladesh

        16.15.1. Pricing Analysis

        16.15.2. Market Share Analysis, 2023

            16.15.2.1. By Product Type

            16.15.2.2. By Technology

            16.15.2.3. By End User

    16.16. Australia

        16.16.1. Pricing Analysis

        16.16.2. Market Share Analysis, 2023

            16.16.2.1. By Product Type

            16.16.2.2. By Technology

            16.16.2.3. By End User

    16.17. New Zealand

        16.17.1. Pricing Analysis

        16.17.2. Market Share Analysis, 2023

            16.17.2.1. By Product Type

            16.17.2.2. By Technology

            16.17.2.3. By End User

    16.18. China

        16.18.1. Pricing Analysis

        16.18.2. Market Share Analysis, 2023

            16.18.2.1. By Product Type

            16.18.2.2. By Technology

            16.18.2.3. By End User

    16.19. Japan

        16.19.1. Pricing Analysis

        16.19.2. Market Share Analysis, 2023

            16.19.2.1. By Product Type

            16.19.2.2. By Technology

            16.19.2.3. By End User

    16.20. South Korea

        16.20.1. Pricing Analysis

        16.20.2. Market Share Analysis, 2023

            16.20.2.1. By Product Type

            16.20.2.2. By Technology

            16.20.2.3. By End User

    16.21. GCC Countries

        16.21.1. Pricing Analysis

        16.21.2. Market Share Analysis, 2023

            16.21.2.1. By Product Type

            16.21.2.2. By Technology

            16.21.2.3. By End User

    16.22. South Africa

        16.22.1. Pricing Analysis

        16.22.2. Market Share Analysis, 2023

            16.22.2.1. By Product Type

            16.22.2.2. By Technology

            16.22.2.3. By End User

    16.23. Israel

        16.23.1. Pricing Analysis

        16.23.2. Market Share Analysis, 2023

            16.23.2.1. By Product Type

            16.23.2.2. By Technology

            16.23.2.3. By End User

17. Market Structure Analysis

    17.1. Competition Dashboard

    17.2. Competition Benchmarking

    17.3. Market Share Analysis of Top Players

        17.3.1. By Regional

        17.3.2. By Product Type

        17.3.3. By Technology

        17.3.4. By End User

18. Competition Analysis

    18.1. Competition Deep Dive

        18.1.1. Teleflex Incorporated

            18.1.1.1. Overview

            18.1.1.2. Product Portfolio

            18.1.1.3. Profitability by Market Segments

            18.1.1.4. Sales Footprint

            18.1.1.5. Strategy Overview

                18.1.1.5.1. Marketing Strategy

                18.1.1.5.2. Product Strategy

                18.1.1.5.3. Channel Strategy

        18.1.2. DeVilbiss Healthcare LLC

            18.1.2.1. Overview

            18.1.2.2. Product Portfolio

            18.1.2.3. Profitability by Market Segments

            18.1.2.4. Sales Footprint

            18.1.2.5. Strategy Overview

                18.1.2.5.1. Marketing Strategy

                18.1.2.5.2. Product Strategy

                18.1.2.5.3. Channel Strategy

        18.1.3. Cook Medical

            18.1.3.1. Overview

            18.1.3.2. Product Portfolio

            18.1.3.3. Profitability by Market Segments

            18.1.3.4. Sales Footprint

            18.1.3.5. Strategy Overview

                18.1.3.5.1. Marketing Strategy

                18.1.3.5.2. Product Strategy

                18.1.3.5.3. Channel Strategy

        18.1.4. Medica Holdings, LLC.

            18.1.4.1. Overview

            18.1.4.2. Product Portfolio

            18.1.4.3. Profitability by Market Segments

            18.1.4.4. Sales Footprint

            18.1.4.5. Strategy Overview

                18.1.4.5.1. Marketing Strategy

                18.1.4.5.2. Product Strategy

                18.1.4.5.3. Channel Strategy

        18.1.5. Integra LifeSciences

            18.1.5.1. Overview

            18.1.5.2. Product Portfolio

            18.1.5.3. Profitability by Market Segments

            18.1.5.4. Sales Footprint

            18.1.5.5. Strategy Overview

                18.1.5.5.1. Marketing Strategy

                18.1.5.5.2. Product Strategy

                18.1.5.5.3. Channel Strategy

        18.1.6. BVM Meditech Private Limited

            18.1.6.1. Overview

            18.1.6.2. Product Portfolio

            18.1.6.3. Profitability by Market Segments

            18.1.6.4. Sales Footprint

            18.1.6.5. Strategy Overview

                18.1.6.5.1. Marketing Strategy

                18.1.6.5.2. Product Strategy

                18.1.6.5.3. Channel Strategy

        18.1.7. Life-Assist Inc.

            18.1.7.1. Overview

            18.1.7.2. Product Portfolio

            18.1.7.3. Profitability by Market Segments

            18.1.7.4. Sales Footprint

            18.1.7.5. Strategy Overview

                18.1.7.5.1. Marketing Strategy

                18.1.7.5.2. Product Strategy

                18.1.7.5.3. Channel Strategy

        18.1.8. BTME Group Limited (MEDTREE)

            18.1.8.1. Overview

            18.1.8.2. Product Portfolio

            18.1.8.3. Profitability by Market Segments

            18.1.8.4. Sales Footprint

            18.1.8.5. Strategy Overview

                18.1.8.5.1. Marketing Strategy

                18.1.8.5.2. Product Strategy

                18.1.8.5.3. Channel Strategy

        18.1.9. Becton, Dickinson and Company

            18.1.9.1. Overview

            18.1.9.2. Product Portfolio

            18.1.9.3. Profitability by Market Segments

            18.1.9.4. Sales Footprint

            18.1.9.5. Strategy Overview

                18.1.9.5.1. Marketing Strategy

                18.1.9.5.2. Product Strategy

                18.1.9.5.3. Channel Strategy

        18.1.10. Kurve Therapeutics

            18.1.10.1. Overview

            18.1.10.2. Product Portfolio

            18.1.10.3. Profitability by Market Segments

            18.1.10.4. Sales Footprint

            18.1.10.5. Strategy Overview

                18.1.10.5.1. Marketing Strategy

                18.1.10.5.2. Product Strategy

                18.1.10.5.3. Channel Strategy

19. Assumptions & Acronyms Used

20. Research Methodology

Don't pay for what you don't need

Customize your report by selecting specific countries or regions and save 30%!

List of Tables

Table 1: Global Market Value (US$ Million) Forecast by Region, 2019 to 2034

Table 2: Global Market Volume (Units) Forecast by Region, 2019 to 2034

Table 3: Global Market Value (US$ Million) Forecast by Product Type, 2019 to 2034

Table 4: Global Market Volume (Units) Forecast by Product Type, 2019 to 2034

Table 5: Global Market Value (US$ Million) Forecast by Technology, 2019 to 2034

Table 6: Global Market Volume (Units) Forecast by Technology, 2019 to 2034

Table 7: Global Market Value (US$ Million) Forecast by End User, 2019 to 2034

Table 8: Global Market Volume (Units) Forecast by End User, 2019 to 2034

Table 9: North America Market Value (US$ Million) Forecast by Country, 2019 to 2034

Table 10: North America Market Volume (Units) Forecast by Country, 2019 to 2034

Table 11: North America Market Value (US$ Million) Forecast by Product Type, 2019 to 2034

Table 12: North America Market Volume (Units) Forecast by Product Type, 2019 to 2034

Table 13: North America Market Value (US$ Million) Forecast by Technology, 2019 to 2034

Table 14: North America Market Volume (Units) Forecast by Technology, 2019 to 2034

Table 15: North America Market Value (US$ Million) Forecast by End User, 2019 to 2034

Table 16: North America Market Volume (Units) Forecast by End User, 2019 to 2034

Table 17: Latin America Market Value (US$ Million) Forecast by Country, 2019 to 2034

Table 18: Latin America Market Volume (Units) Forecast by Country, 2019 to 2034

Table 19: Latin America Market Value (US$ Million) Forecast by Product Type, 2019 to 2034

Table 20: Latin America Market Volume (Units) Forecast by Product Type, 2019 to 2034

Table 21: Latin America Market Value (US$ Million) Forecast by Technology, 2019 to 2034

Table 22: Latin America Market Volume (Units) Forecast by Technology, 2019 to 2034

Table 23: Latin America Market Value (US$ Million) Forecast by End User, 2019 to 2034

Table 24: Latin America Market Volume (Units) Forecast by End User, 2019 to 2034

Table 25: Western Europe Market Value (US$ Million) Forecast by Country, 2019 to 2034

Table 26: Western Europe Market Volume (Units) Forecast by Country, 2019 to 2034

Table 27: Western Europe Market Value (US$ Million) Forecast by Product Type, 2019 to 2034

Table 28: Western Europe Market Volume (Units) Forecast by Product Type, 2019 to 2034

Table 29: Western Europe Market Value (US$ Million) Forecast by Technology, 2019 to 2034

Table 30: Western Europe Market Volume (Units) Forecast by Technology, 2019 to 2034

Table 31: Western Europe Market Value (US$ Million) Forecast by End User, 2019 to 2034

Table 32: Western Europe Market Volume (Units) Forecast by End User, 2019 to 2034

Table 33: Eastern Europe Market Value (US$ Million) Forecast by Country, 2019 to 2034

Table 34: Eastern Europe Market Volume (Units) Forecast by Country, 2019 to 2034

Table 35: Eastern Europe Market Value (US$ Million) Forecast by Product Type, 2019 to 2034

Table 36: Eastern Europe Market Volume (Units) Forecast by Product Type, 2019 to 2034

Table 37: Eastern Europe Market Value (US$ Million) Forecast by Technology, 2019 to 2034

Table 38: Eastern Europe Market Volume (Units) Forecast by Technology, 2019 to 2034

Table 39: Eastern Europe Market Value (US$ Million) Forecast by End User, 2019 to 2034

Table 40: Eastern Europe Market Volume (Units) Forecast by End User, 2019 to 2034

Table 41: South Asia and Pacific Market Value (US$ Million) Forecast by Country, 2019 to 2034

Table 42: South Asia and Pacific Market Volume (Units) Forecast by Country, 2019 to 2034

Table 43: South Asia and Pacific Market Value (US$ Million) Forecast by Product Type, 2019 to 2034

Table 44: South Asia and Pacific Market Volume (Units) Forecast by Product Type, 2019 to 2034

Table 45: South Asia and Pacific Market Value (US$ Million) Forecast by Technology, 2019 to 2034

Table 46: South Asia and Pacific Market Volume (Units) Forecast by Technology, 2019 to 2034

Table 47: South Asia and Pacific Market Value (US$ Million) Forecast by End User, 2019 to 2034

Table 48: South Asia and Pacific Market Volume (Units) Forecast by End User, 2019 to 2034

Table 49: East Asia Market Value (US$ Million) Forecast by Country, 2019 to 2034

Table 50: East Asia Market Volume (Units) Forecast by Country, 2019 to 2034

Table 51: East Asia Market Value (US$ Million) Forecast by Product Type, 2019 to 2034

Table 52: East Asia Market Volume (Units) Forecast by Product Type, 2019 to 2034

Table 53: East Asia Market Value (US$ Million) Forecast by Technology, 2019 to 2034

Table 54: East Asia Market Volume (Units) Forecast by Technology, 2019 to 2034

Table 55: East Asia Market Value (US$ Million) Forecast by End User, 2019 to 2034

Table 56: East Asia Market Volume (Units) Forecast by End User, 2019 to 2034

Table 57: Middle East and Africa Market Value (US$ Million) Forecast by Country, 2019 to 2034

Table 58: Middle East and Africa Market Volume (Units) Forecast by Country, 2019 to 2034

Table 59: Middle East and Africa Market Value (US$ Million) Forecast by Product Type, 2019 to 2034

Table 60: Middle East and Africa Market Volume (Units) Forecast by Product Type, 2019 to 2034

Table 61: Middle East and Africa Market Value (US$ Million) Forecast by Technology, 2019 to 2034

Table 62: Middle East and Africa Market Volume (Units) Forecast by Technology, 2019 to 2034

Table 63: Middle East and Africa Market Value (US$ Million) Forecast by End User, 2019 to 2034

Table 64: Middle East and Africa Market Volume (Units) Forecast by End User, 2019 to 2034
Sabyasachi Ghosh
Sabyasachi Ghosh

Principal Consultant

Talk to Analyst

Find your sweet spots for generating winning opportunities in this market.

List of Charts

Figure 1: Global Market Value (US$ Million) by Product Type, 2024 to 2034

Figure 2: Global Market Value (US$ Million) by Technology, 2024 to 2034

Figure 3: Global Market Value (US$ Million) by End User, 2024 to 2034

Figure 4: Global Market Value (US$ Million) by Region, 2024 to 2034

Figure 5: Global Market Value (US$ Million) Analysis by Region, 2019 to 2034

Figure 6: Global Market Volume (Units) Analysis by Region, 2019 to 2034

Figure 7: Global Market Value Share (%) and BPS Analysis by Region, 2024 to 2034

Figure 8: Global Market Y-o-Y Growth (%) Projections by Region, 2024 to 2034

Figure 9: Global Market Value (US$ Million) Analysis by Product Type, 2019 to 2034

Figure 10: Global Market Volume (Units) Analysis by Product Type, 2019 to 2034

Figure 11: Global Market Value Share (%) and BPS Analysis by Product Type, 2024 to 2034

Figure 12: Global Market Y-o-Y Growth (%) Projections by Product Type, 2024 to 2034

Figure 13: Global Market Value (US$ Million) Analysis by Technology, 2019 to 2034

Figure 14: Global Market Volume (Units) Analysis by Technology, 2019 to 2034

Figure 15: Global Market Value Share (%) and BPS Analysis by Technology, 2024 to 2034

Figure 16: Global Market Y-o-Y Growth (%) Projections by Technology, 2024 to 2034

Figure 17: Global Market Value (US$ Million) Analysis by End User, 2019 to 2034

Figure 18: Global Market Volume (Units) Analysis by End User, 2019 to 2034

Figure 19: Global Market Value Share (%) and BPS Analysis by End User, 2024 to 2034

Figure 20: Global Market Y-o-Y Growth (%) Projections by End User, 2024 to 2034

Figure 21: Global Market Attractiveness by Product Type, 2024 to 2034

Figure 22: Global Market Attractiveness by Technology, 2024 to 2034

Figure 23: Global Market Attractiveness by End User, 2024 to 2034

Figure 24: Global Market Attractiveness by Region, 2024 to 2034

Figure 25: North America Market Value (US$ Million) by Product Type, 2024 to 2034

Figure 26: North America Market Value (US$ Million) by Technology, 2024 to 2034

Figure 27: North America Market Value (US$ Million) by End User, 2024 to 2034

Figure 28: North America Market Value (US$ Million) by Country, 2024 to 2034

Figure 29: North America Market Value (US$ Million) Analysis by Country, 2019 to 2034

Figure 30: North America Market Volume (Units) Analysis by Country, 2019 to 2034

Figure 31: North America Market Value Share (%) and BPS Analysis by Country, 2024 to 2034

Figure 32: North America Market Y-o-Y Growth (%) Projections by Country, 2024 to 2034

Figure 33: North America Market Value (US$ Million) Analysis by Product Type, 2019 to 2034

Figure 34: North America Market Volume (Units) Analysis by Product Type, 2019 to 2034

Figure 35: North America Market Value Share (%) and BPS Analysis by Product Type, 2024 to 2034

Figure 36: North America Market Y-o-Y Growth (%) Projections by Product Type, 2024 to 2034

Figure 37: North America Market Value (US$ Million) Analysis by Technology, 2019 to 2034

Figure 38: North America Market Volume (Units) Analysis by Technology, 2019 to 2034

Figure 39: North America Market Value Share (%) and BPS Analysis by Technology, 2024 to 2034

Figure 40: North America Market Y-o-Y Growth (%) Projections by Technology, 2024 to 2034

Figure 41: North America Market Value (US$ Million) Analysis by End User, 2019 to 2034

Figure 42: North America Market Volume (Units) Analysis by End User, 2019 to 2034

Figure 43: North America Market Value Share (%) and BPS Analysis by End User, 2024 to 2034

Figure 44: North America Market Y-o-Y Growth (%) Projections by End User, 2024 to 2034

Figure 45: North America Market Attractiveness by Product Type, 2024 to 2034

Figure 46: North America Market Attractiveness by Technology, 2024 to 2034

Figure 47: North America Market Attractiveness by End User, 2024 to 2034

Figure 48: North America Market Attractiveness by Country, 2024 to 2034

Figure 49: Latin America Market Value (US$ Million) by Product Type, 2024 to 2034

Figure 50: Latin America Market Value (US$ Million) by Technology, 2024 to 2034

Figure 51: Latin America Market Value (US$ Million) by End User, 2024 to 2034

Figure 52: Latin America Market Value (US$ Million) by Country, 2024 to 2034

Figure 53: Latin America Market Value (US$ Million) Analysis by Country, 2019 to 2034

Figure 54: Latin America Market Volume (Units) Analysis by Country, 2019 to 2034

Figure 55: Latin America Market Value Share (%) and BPS Analysis by Country, 2024 to 2034

Figure 56: Latin America Market Y-o-Y Growth (%) Projections by Country, 2024 to 2034

Figure 57: Latin America Market Value (US$ Million) Analysis by Product Type, 2019 to 2034

Figure 58: Latin America Market Volume (Units) Analysis by Product Type, 2019 to 2034

Figure 59: Latin America Market Value Share (%) and BPS Analysis by Product Type, 2024 to 2034

Figure 60: Latin America Market Y-o-Y Growth (%) Projections by Product Type, 2024 to 2034

Figure 61: Latin America Market Value (US$ Million) Analysis by Technology, 2019 to 2034

Figure 62: Latin America Market Volume (Units) Analysis by Technology, 2019 to 2034

Figure 63: Latin America Market Value Share (%) and BPS Analysis by Technology, 2024 to 2034

Figure 64: Latin America Market Y-o-Y Growth (%) Projections by Technology, 2024 to 2034

Figure 65: Latin America Market Value (US$ Million) Analysis by End User, 2019 to 2034

Figure 66: Latin America Market Volume (Units) Analysis by End User, 2019 to 2034

Figure 67: Latin America Market Value Share (%) and BPS Analysis by End User, 2024 to 2034

Figure 68: Latin America Market Y-o-Y Growth (%) Projections by End User, 2024 to 2034

Figure 69: Latin America Market Attractiveness by Product Type, 2024 to 2034

Figure 70: Latin America Market Attractiveness by Technology, 2024 to 2034

Figure 71: Latin America Market Attractiveness by End User, 2024 to 2034

Figure 72: Latin America Market Attractiveness by Country, 2024 to 2034

Figure 73: Western Europe Market Value (US$ Million) by Product Type, 2024 to 2034

Figure 74: Western Europe Market Value (US$ Million) by Technology, 2024 to 2034

Figure 75: Western Europe Market Value (US$ Million) by End User, 2024 to 2034

Figure 76: Western Europe Market Value (US$ Million) by Country, 2024 to 2034

Figure 77: Western Europe Market Value (US$ Million) Analysis by Country, 2019 to 2034

Figure 78: Western Europe Market Volume (Units) Analysis by Country, 2019 to 2034

Figure 79: Western Europe Market Value Share (%) and BPS Analysis by Country, 2024 to 2034

Figure 80: Western Europe Market Y-o-Y Growth (%) Projections by Country, 2024 to 2034

Figure 81: Western Europe Market Value (US$ Million) Analysis by Product Type, 2019 to 2034

Figure 82: Western Europe Market Volume (Units) Analysis by Product Type, 2019 to 2034

Figure 83: Western Europe Market Value Share (%) and BPS Analysis by Product Type, 2024 to 2034

Figure 84: Western Europe Market Y-o-Y Growth (%) Projections by Product Type, 2024 to 2034

Figure 85: Western Europe Market Value (US$ Million) Analysis by Technology, 2019 to 2034

Figure 86: Western Europe Market Volume (Units) Analysis by Technology, 2019 to 2034

Figure 87: Western Europe Market Value Share (%) and BPS Analysis by Technology, 2024 to 2034

Figure 88: Western Europe Market Y-o-Y Growth (%) Projections by Technology, 2024 to 2034

Figure 89: Western Europe Market Value (US$ Million) Analysis by End User, 2019 to 2034

Figure 90: Western Europe Market Volume (Units) Analysis by End User, 2019 to 2034

Figure 91: Western Europe Market Value Share (%) and BPS Analysis by End User, 2024 to 2034

Figure 92: Western Europe Market Y-o-Y Growth (%) Projections by End User, 2024 to 2034

Figure 93: Western Europe Market Attractiveness by Product Type, 2024 to 2034

Figure 94: Western Europe Market Attractiveness by Technology, 2024 to 2034

Figure 95: Western Europe Market Attractiveness by End User, 2024 to 2034

Figure 96: Western Europe Market Attractiveness by Country, 2024 to 2034

Figure 97: Eastern Europe Market Value (US$ Million) by Product Type, 2024 to 2034

Figure 98: Eastern Europe Market Value (US$ Million) by Technology, 2024 to 2034

Figure 99: Eastern Europe Market Value (US$ Million) by End User, 2024 to 2034

Figure 100: Eastern Europe Market Value (US$ Million) by Country, 2024 to 2034

Figure 101: Eastern Europe Market Value (US$ Million) Analysis by Country, 2019 to 2034

Figure 102: Eastern Europe Market Volume (Units) Analysis by Country, 2019 to 2034

Figure 103: Eastern Europe Market Value Share (%) and BPS Analysis by Country, 2024 to 2034

Figure 104: Eastern Europe Market Y-o-Y Growth (%) Projections by Country, 2024 to 2034

Figure 105: Eastern Europe Market Value (US$ Million) Analysis by Product Type, 2019 to 2034

Figure 106: Eastern Europe Market Volume (Units) Analysis by Product Type, 2019 to 2034

Figure 107: Eastern Europe Market Value Share (%) and BPS Analysis by Product Type, 2024 to 2034

Figure 108: Eastern Europe Market Y-o-Y Growth (%) Projections by Product Type, 2024 to 2034

Figure 109: Eastern Europe Market Value (US$ Million) Analysis by Technology, 2019 to 2034

Figure 110: Eastern Europe Market Volume (Units) Analysis by Technology, 2019 to 2034

Figure 111: Eastern Europe Market Value Share (%) and BPS Analysis by Technology, 2024 to 2034

Figure 112: Eastern Europe Market Y-o-Y Growth (%) Projections by Technology, 2024 to 2034

Figure 113: Eastern Europe Market Value (US$ Million) Analysis by End User, 2019 to 2034

Figure 114: Eastern Europe Market Volume (Units) Analysis by End User, 2019 to 2034

Figure 115: Eastern Europe Market Value Share (%) and BPS Analysis by End User, 2024 to 2034

Figure 116: Eastern Europe Market Y-o-Y Growth (%) Projections by End User, 2024 to 2034

Figure 117: Eastern Europe Market Attractiveness by Product Type, 2024 to 2034

Figure 118: Eastern Europe Market Attractiveness by Technology, 2024 to 2034

Figure 119: Eastern Europe Market Attractiveness by End User, 2024 to 2034

Figure 120: Eastern Europe Market Attractiveness by Country, 2024 to 2034

Figure 121: South Asia and Pacific Market Value (US$ Million) by Product Type, 2024 to 2034

Figure 122: South Asia and Pacific Market Value (US$ Million) by Technology, 2024 to 2034

Figure 123: South Asia and Pacific Market Value (US$ Million) by End User, 2024 to 2034

Figure 124: South Asia and Pacific Market Value (US$ Million) by Country, 2024 to 2034

Figure 125: South Asia and Pacific Market Value (US$ Million) Analysis by Country, 2019 to 2034

Figure 126: South Asia and Pacific Market Volume (Units) Analysis by Country, 2019 to 2034

Figure 127: South Asia and Pacific Market Value Share (%) and BPS Analysis by Country, 2024 to 2034

Figure 128: South Asia and Pacific Market Y-o-Y Growth (%) Projections by Country, 2024 to 2034

Figure 129: South Asia and Pacific Market Value (US$ Million) Analysis by Product Type, 2019 to 2034

Figure 130: South Asia and Pacific Market Volume (Units) Analysis by Product Type, 2019 to 2034

Figure 131: South Asia and Pacific Market Value Share (%) and BPS Analysis by Product Type, 2024 to 2034

Figure 132: South Asia and Pacific Market Y-o-Y Growth (%) Projections by Product Type, 2024 to 2034

Figure 133: South Asia and Pacific Market Value (US$ Million) Analysis by Technology, 2019 to 2034

Figure 134: South Asia and Pacific Market Volume (Units) Analysis by Technology, 2019 to 2034

Figure 135: South Asia and Pacific Market Value Share (%) and BPS Analysis by Technology, 2024 to 2034

Figure 136: South Asia and Pacific Market Y-o-Y Growth (%) Projections by Technology, 2024 to 2034

Figure 137: South Asia and Pacific Market Value (US$ Million) Analysis by End User, 2019 to 2034

Figure 138: South Asia and Pacific Market Volume (Units) Analysis by End User, 2019 to 2034

Figure 139: South Asia and Pacific Market Value Share (%) and BPS Analysis by End User, 2024 to 2034

Figure 140: South Asia and Pacific Market Y-o-Y Growth (%) Projections by End User, 2024 to 2034

Figure 141: South Asia and Pacific Market Attractiveness by Product Type, 2024 to 2034

Figure 142: South Asia and Pacific Market Attractiveness by Technology, 2024 to 2034

Figure 143: South Asia and Pacific Market Attractiveness by End User, 2024 to 2034

Figure 144: South Asia and Pacific Market Attractiveness by Country, 2024 to 2034

Figure 145: East Asia Market Value (US$ Million) by Product Type, 2024 to 2034

Figure 146: East Asia Market Value (US$ Million) by Technology, 2024 to 2034

Figure 147: East Asia Market Value (US$ Million) by End User, 2024 to 2034

Figure 148: East Asia Market Value (US$ Million) by Country, 2024 to 2034

Figure 149: East Asia Market Value (US$ Million) Analysis by Country, 2019 to 2034

Figure 150: East Asia Market Volume (Units) Analysis by Country, 2019 to 2034

Figure 151: East Asia Market Value Share (%) and BPS Analysis by Country, 2024 to 2034

Figure 152: East Asia Market Y-o-Y Growth (%) Projections by Country, 2024 to 2034

Figure 153: East Asia Market Value (US$ Million) Analysis by Product Type, 2019 to 2034

Figure 154: East Asia Market Volume (Units) Analysis by Product Type, 2019 to 2034

Figure 155: East Asia Market Value Share (%) and BPS Analysis by Product Type, 2024 to 2034

Figure 156: East Asia Market Y-o-Y Growth (%) Projections by Product Type, 2024 to 2034

Figure 157: East Asia Market Value (US$ Million) Analysis by Technology, 2019 to 2034

Figure 158: East Asia Market Volume (Units) Analysis by Technology, 2019 to 2034

Figure 159: East Asia Market Value Share (%) and BPS Analysis by Technology, 2024 to 2034

Figure 160: East Asia Market Y-o-Y Growth (%) Projections by Technology, 2024 to 2034

Figure 161: East Asia Market Value (US$ Million) Analysis by End User, 2019 to 2034

Figure 162: East Asia Market Volume (Units) Analysis by End User, 2019 to 2034

Figure 163: East Asia Market Value Share (%) and BPS Analysis by End User, 2024 to 2034

Figure 164: East Asia Market Y-o-Y Growth (%) Projections by End User, 2024 to 2034

Figure 165: East Asia Market Attractiveness by Product Type, 2024 to 2034

Figure 166: East Asia Market Attractiveness by Technology, 2024 to 2034

Figure 167: East Asia Market Attractiveness by End User, 2024 to 2034

Figure 168: East Asia Market Attractiveness by Country, 2024 to 2034

Figure 169: Middle East and Africa Market Value (US$ Million) by Product Type, 2024 to 2034

Figure 170: Middle East and Africa Market Value (US$ Million) by Technology, 2024 to 2034

Figure 171: Middle East and Africa Market Value (US$ Million) by End User, 2024 to 2034

Figure 172: Middle East and Africa Market Value (US$ Million) by Country, 2024 to 2034

Figure 173: Middle East and Africa Market Value (US$ Million) Analysis by Country, 2019 to 2034

Figure 174: Middle East and Africa Market Volume (Units) Analysis by Country, 2019 to 2034

Figure 175: Middle East and Africa Market Value Share (%) and BPS Analysis by Country, 2024 to 2034

Figure 176: Middle East and Africa Market Y-o-Y Growth (%) Projections by Country, 2024 to 2034

Figure 177: Middle East and Africa Market Value (US$ Million) Analysis by Product Type, 2019 to 2034

Figure 178: Middle East and Africa Market Volume (Units) Analysis by Product Type, 2019 to 2034

Figure 179: Middle East and Africa Market Value Share (%) and BPS Analysis by Product Type, 2024 to 2034

Figure 180: Middle East and Africa Market Y-o-Y Growth (%) Projections by Product Type, 2024 to 2034

Figure 181: Middle East and Africa Market Value (US$ Million) Analysis by Technology, 2019 to 2034

Figure 182: Middle East and Africa Market Volume (Units) Analysis by Technology, 2019 to 2034

Figure 183: Middle East and Africa Market Value Share (%) and BPS Analysis by Technology, 2024 to 2034

Figure 184: Middle East and Africa Market Y-o-Y Growth (%) Projections by Technology, 2024 to 2034

Figure 185: Middle East and Africa Market Value (US$ Million) Analysis by End User, 2019 to 2034

Figure 186: Middle East and Africa Market Volume (Units) Analysis by End User, 2019 to 2034

Figure 187: Middle East and Africa Market Value Share (%) and BPS Analysis by End User, 2024 to 2034

Figure 188: Middle East and Africa Market Y-o-Y Growth (%) Projections by End User, 2024 to 2034

Figure 189: Middle East and Africa Market Attractiveness by Product Type, 2024 to 2034

Figure 190: Middle East and Africa Market Attractiveness by Technology, 2024 to 2034

Figure 191: Middle East and Africa Market Attractiveness by End User, 2024 to 2034

Figure 192: Middle East and Africa Market Attractiveness by Country, 2024 to 2034

Recommendations

Healthcare

Nasal Packing Devices Market

Published : July 2023

Healthcare

Nasal Antihistamines Market

Published : June 2023

Healthcare

Respiratory Inhaler Devices Market

Published : April 2023

Healthcare

Nasal Sprays Market

Published : January 2023

Explore Healthcare Insights

View Reports

Mucosal Atomization Device Market