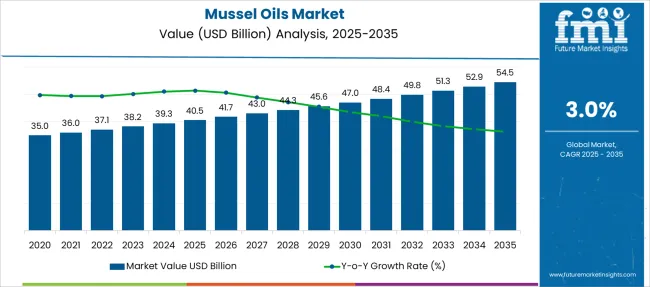
The Mussel Oils Market is estimated to be valued at USD 40.5 billion in 2025 and is projected to reach USD 54.5 billion by 2035, registering a compound annual growth rate (CAGR) of 3.0% over the forecast period.
| Metric | Value |
|---|---|
| Mussel Oils Market Estimated Value in (2025 E) | USD 40.5 billion |
| Mussel Oils Market Forecast Value in (2035 F) | USD 54.5 billion |
| Forecast CAGR (2025 to 2035) | 3.0% |
The mussel oils market is witnessing steady growth driven by rising consumer awareness around the health benefits of omega three fatty acids, increasing demand for marine based supplements, and a shift toward preventive healthcare. Extracted primarily from green lipped mussels, mussel oil is gaining prominence due to its natural anti inflammatory properties and high concentration of essential fatty acids.
The market is further supported by innovations in encapsulation technologies, expanding nutraceutical applications, and the growing popularity of clean label products. Regulatory approvals in key markets and increased investment in sustainable aquaculture practices are contributing to supply chain stability and market credibility.
The future outlook remains optimistic as consumer preference continues to shift toward natural and functional ingredients in both dietary supplements and fortified food products.
The market is segmented by End Use and Distribution Channel and region. By End Use, the market is divided into Processed Foods, Cosmetics and Personal Care, Biopharmaceuticals, Dietary Supplements, Veterinary Medicines, and Pet Foods. In terms of Distribution Channel, the market is classified into Wholesale, Online Retailers, Supermarkets, and Specialty Stores. Regionally, the market is classified into North America, Latin America, Western Europe, Eastern Europe, Balkan & Baltic Countries, Russia & Belarus, Central Asia, East Asia, South Asia & Pacific, and the Middle East & Africa.
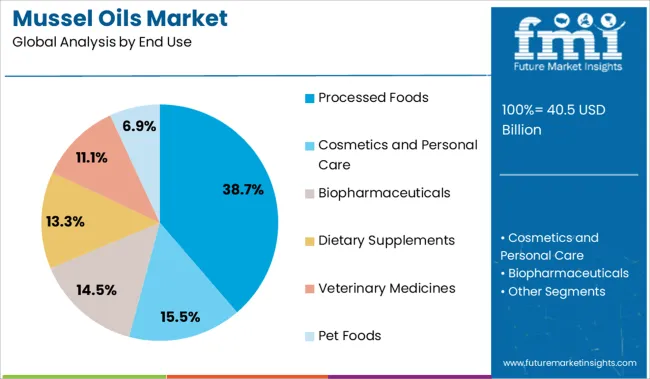
The processed foods segment is anticipated to account for 38.70% of the total market revenue by 2025 within the end use category, making it the leading application. This dominance is driven by the growing trend of functional food fortification, rising demand for omega rich ingredients, and the integration of mussel oil into ready to eat and convenience food products.
Food manufacturers are increasingly incorporating marine based oils into formulations aimed at joint support, heart health, and immune system benefits. The neutral flavor profile and compatibility with various food matrices have supported its widespread use in snacks, beverages, and dairy alternatives.
The segment’s growth is further enhanced by evolving consumer expectations for added health benefits in everyday food items, positioning processed foods as a primary driver of mussel oil adoption.
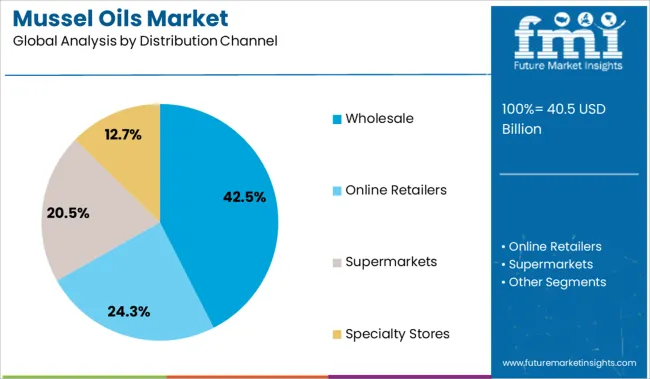
The wholesale segment is projected to hold 42.50% of the total market revenue by 2025 under the distribution channel category, making it the most dominant channel. This prominence is attributed to the ability of wholesalers to manage large volume distribution, ensure supply consistency, and offer competitive pricing to retailers and food manufacturers.
Wholesale networks are essential for reaching both domestic and international markets, particularly in regions where mussel oil is imported or produced at scale. Their role in aggregating supply, streamlining logistics, and maintaining regulatory compliance has enhanced trust and efficiency within the supply chain.
The wholesale model continues to be preferred by businesses seeking scalable sourcing solutions, thereby establishing its leading position in the mussel oils market.
The anti-inflammatory properties conveyed by the bioactive compounds present in the mussel oils have high demand in biopharmaceuticals. Mussel oil derived from green-lipped mussels contains a high amount of eicosatetraenoic acid since green-lipped mussel is the only known source of ETAs, which help prevent inflammation at a cellular level.
Increasing awareness about a healthy lifestyle and increased demand for dietary supplements drive the growth of the market. Oil extracted from green-lipped mussels found in the coastal line of New Zealand stimulates bone health and eliminates deficiencies as it is a rich source of protein, omega-3 fatty acids, selenium, iron, vitamin B12, iodine, magnesium, and calcium. Also, mussel oil helps in the treatment of asthma and other respiratory problems, rheumatoid arthritis osteoarthritis, and other inflammatory bowel diseases.
The Biopharmaceutical industry is expected to accrue significant benefits to the global mussel oils market as technological developments, cost-effective techniques are being developed to produce a supreme quality product with an improved long shelf-life of the mussel oil. Mussel oil can reduce the risk of heart disease thus used on large scale in pharmaceutics.
Although the mussel oils market has numerous end-user, there are numerous obstacles likely to pose a challenge to market growth. With increasing health awareness among the population consumers shifting toward a vegan lifestyle acts as a driver for the mussel oils market growth as it is animal-origin oil.
Lack of consumer awareness and lack of improved distribution channels may hinder the growth of the mussel oils market in forecasting years. The mussels count in oceans is affected by global warming, pollution, and exploitation by human activity this also hampers the growth of the market in forecasting years. Growing instances of allergies caused by seafood consumption are expected to slow down the mussel oils market growth.
The Asia Pacific was the largest market for mussel oils and the trend is expected to continue into the forecast period owing to high product demand in this region. The region is forecast to surge at a 3.3% CAGR from 2025 to 2035. China holds the largest share of mussel oil in the Asia Pacific region.
Increasing pet population and increasing mussel oils demand in pet food. Also, the rapidly increasing cosmetics industry provides a lucrative opportunity for the mussel oils market in the region.
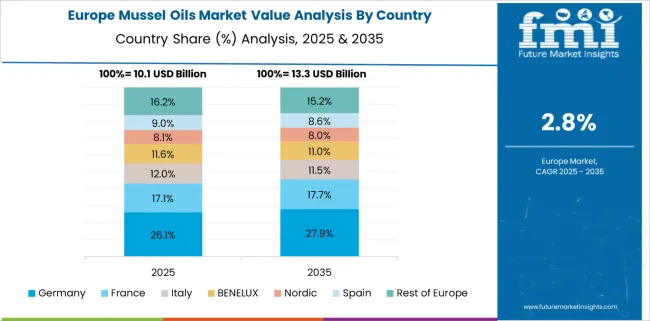
According to Future Market Insights, Europe is expected to provide immense growth opportunities for mussel oils, with France expected to steer the bulk of all regional growth.
Extensive applications in dietary supplements are keeping sales of mussel oils afloat across France. Moreover, the pet food industry in these countries is also experiencing a major upsurge, which will generate favorable conditions for market growth.
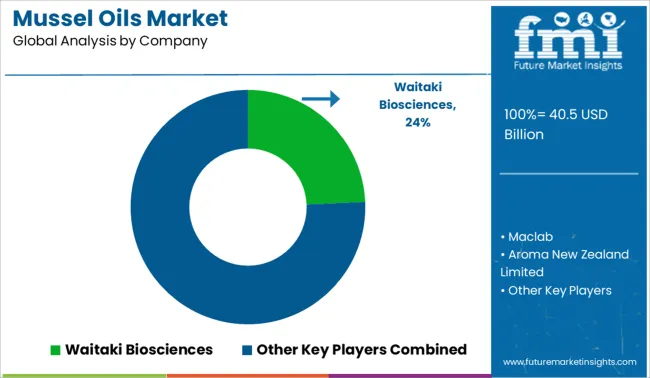
Some of the key participants present in the global mussel oils market include Waitaki Biosciences, Maclab, Aroma New Zealand Limited, Nature’s Range, Great Healthworks, and Blackmores Limited among others.
Attributed to the presence of such a high number of participants, the market is highly competitive. While global players such as Waitaki Biosciences, Maclab, and Aroma New Zealand Limited account for a considerable market size, several regional-level players are also operating across key growth regions, particularly in the Asia Pacific.
| Report Attribute | Details |
|---|---|
| Growth Rate | CAGR of 3% from 2025 to 2035 |
| Market Value in 2025 | USD 40.5 billion |
| Market Value in 2035 | USD 54.5 billion |
| Base Year for Estimation | 2024 |
| Historical Data | 2020 to 2024 |
| Forecast Period | 2025 to 2035 |
| Quantitative Units | Revenue in USD Million, Volume in Kilotons, and CAGR from 2025 to 2035 |
| Report Coverage | Revenue Forecast, Volume Forecast, Company Ranking, Competitive Landscape, Growth Factors, Trends, and Pricing Analysis |
| Segments Covered | End Use, Distribution Channel, Region |
| Regions Covered | North America; Latin America; Europe; Asia Pacific; Middle East and Africa |
| Key Countries Profiled | USA, Canada, Brazil, Mexico, Germany, United Kingdom, France, Spain, Italy, China, Japan, South Korea, Malaysia, Singapore, Australia, New Zealand, GCC Countries, South Africa, Israel |
| Key Companies Profiled | Waitaki Biosciences; Maclab; Aroma New Zealand Limited; Nature’s Range; Great Healthworks; Blackmores Limited; Bio-Mer Limited; ByLovely Health Ltd.; Henry Blooms Health Products; Nature’s Range |
| Customization | Available Upon Request |
The global mussel oils market is estimated to be valued at USD 40.5 billion in 2025.
The market size for the mussel oils market is projected to reach USD 54.5 billion by 2035.
The mussel oils market is expected to grow at a 3.0% CAGR between 2025 and 2035.
The key product types in mussel oils market are processed foods, cosmetics and personal care, biopharmaceuticals, dietary supplements, veterinary medicines and pet foods.
In terms of distribution channel, wholesale segment to command 42.5% share in the mussel oils market in 2025.


Full Research Suite comprises of:
Market outlook & trends analysis
Interviews & case studies
Strategic recommendations
Vendor profiles & capabilities analysis
5-year forecasts
8 regions and 60+ country-level data splits
Market segment data splits
12 months of continuous data updates
DELIVERED AS:
PDF EXCEL ONLINE
Mussel Extract Market Size and Share Forecast Outlook 2025 to 2035
Analysis and Growth Projections for Mussel Business
Lip Oils Market Size and Share Forecast Outlook 2025 to 2035
EDM Oils/Fluids Market
Blown oils Market Size and Share Forecast Outlook 2025 to 2035
Spice Oils and Oleoresins Market Analysis - Size, Share, and Forecast Outlook 2025 to 2035
Edible Oils and Fats Market Analysis by Product Type, Source, and Distribution Channel Through 2035
Flavor Oils Market
Turbine Oils Market Size and Share Forecast Outlook 2025 to 2035
Coding Foils & Tapes Market Size and Share Forecast Outlook 2025 to 2035
Market Share Insights of Coding Foils & Tapes Providers
Fats And Oils Market Size and Share Forecast Outlook 2025 to 2035
Tipping Foils Market Size and Share Forecast Outlook 2025 to 2035
Understanding Market Share Trends in the Tipping Foils Industry
Flavoring Oils Market Size and Share Forecast Outlook 2025 to 2035
Lime Seed Oils Market Size and Share Forecast Outlook 2025 to 2035
Specialty Oils Market Size, Growth, and Forecast 2025 to 2035
Feed Grade Oils Market Analysis - Size, Share, and Forecast Outlook 2025 to 2035
ASEAN Fish Oils Market Growth – Trends, Demand & Innovations 2025–2035
Machine Tool Oils Market Size and Share Forecast Outlook 2025 to 2035

Thank you!
You will receive an email from our Business Development Manager. Please be sure to check your SPAM/JUNK folder too.
Chat With
MaRIA