Reports

- Global Locations -

Headquarters

Future Market Insights, Inc.

Christiana Corporate, 200
Continental Drive, Suite 401,
Newark, Delaware - 19713,
United States

T: +1-845-579-5705

Americas

Future Market Insights, Inc.

616 Corporate Way, Suite 2-9018,
Valley Cottage, NY 10989, United States

T: +1-347-918-3531

MEA

Future Market Insights

1602-6 Jumeirah Bay X2 Tower, Plot No: JLT-PH2-X2A,
Jumeirah Lakes Towers, Dubai,
United Arab Emirates

Europe

Future Market Insights

3rd Floor, 207 Regent Street,
W1B 3HH London
United Kingdom

T: + 44 (0) 20 8123 9659
D: +44 (0) 20 3287 4268

Asia Pacific

Future Market Insights

IndiaLand Global Tech Park, Unit UG-1, Behind Grand HighStreet, Phase 1, Hinjawadi, MH, Pune – 411057, India

Lime Seed Oils Market Outlook (2022 to 2032)

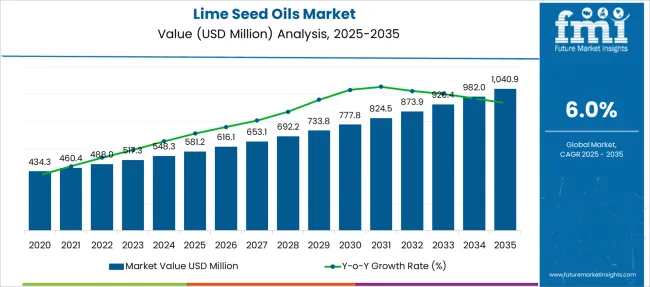
The global lime seed oils market is poised to register a CAGR of 6% from 2022 to 2032, projected to garner a revenue of US$ 708 million by 2032, up from US$ 488 million in 2022.

With a sizable consumer base preferring organic over conventional food ingredients, natural essential oils are on a steady upward trend, propelling the overall demand for lime seed oils.

Furthermore, the sales of lime seed oils are on the rise due to their energy-boosting and mood-lifting properties, lime oil has gained traction in aromatherapy in recent years.

Hence, the demand for lime seed oils in therapeutics is expected to expand the lime seed oils market share over the forecast period.

Report Attribute Details
Lime Seed Oils Market Value (2022) US$ 488 million
Lime Seed Oils Market Anticipated Forecast Value (2032) US$ 708 million
Lime Seed Oils Market Projected Growth Rate (2022 to 2032) 6%

The demand for lime seed oils is rising as when compared to its more expensive siblings, lime oil is one of the more affordable essential oils, allowing it to attract a larger consumer base than other essential oils.

The desire for natural, non-chemical ingredients has a significant impact on processed food purchasing decisions thereby fuelling the sales of lime seed oils.

Manufacturers of lime oil are increasingly emphasizing the introduction of food-grade lime oil variants for both taste and preservation, catering to the consumer’s demand for lime seed oils.

The rising sales of lime seed oils can be attributed to their commercial importance where lime oil was first used as a natural preservative in canned, frozen, and vacuum-packed goods, as well as bottled beverages and fruit juices.

The lime seed oil contains palmitic acid, which makes lime seed oil very stable in nature thereby facilitating heating without disturbing its natural properties at the fat stage while making cream and lotions. Hence, the demand for lime seed oils is on a higher trajectory.

Moreover, the growing sales of lime seed oils are also due to their useful properties such as antiseptic, preventing aging symptoms, fighting infection, and helping in reducing weight and joint pain.

The lime seed oil is also used in other industries such as cosmetics and fragrances, pharmaceuticals, healthcare, and food, due to which the demand for lime seed oils is increasing tremendously over the forecast period.

Combinations of lime oil variants have recently been tested in oral care products such as toothpaste and mouthwash and the same is auguring well for the lime seed oils market share.

Don't pay for what you don't need

Customize your report by selecting specific countries or regions and save 30%!

What Factors are Shaping the Lime Seed Oils Market?

The demand for lime seed oils is gaining momentum in the market majorly due to its multi-purpose uses and benefits.

The easy permeability of the oil into the skin spikes its use as an essential ingredient in the cosmetic industry for the preparation of lotions, body butter, and other moisturizing creams, in turn, spurring the demand for lime seed oils.

In addition to this, the sales of lime seed oils are catered by its uses as a vital component for an anti-aging cream, the lime seed oil is used in the soap-making process and other toiletries.

Consumers these days are suffering from various skin problems due to which the demand for lime seed oils has increased as it helps in rejuvenating the skin and also create a refreshing sensation, in turn, soaring the sales of lime seed oils as well.

Not only in cosmetics products but also in pharmaceutical products lime seed oil is used due to its antiseptic and disinfectant property, adding up to the overall sales of lime seed oils.

Hence, the sales of lime seed oils also rise as they are used to manufacture many antiseptic creams, ointments, sanitizers, etc.

Lime seed oil is also a good mosquito repellent, indicating an increasing demand for lime seed oils in more mosquito-prone areas.

Spiking sales of lime seed oils can be credited to the increasing demand from industries such as the fragrance industry, pharmaceutical industry, healthcare industry, cosmetics, and personal care industry.

Due to evolving food taste and the demand of consumers, flavor mixing has become necessary, which eventually augments the demand for lime seed oils as a flavor blender, which is bolstering the lime seed oils market share.

Consumers these days are looking for long-lasting and new fragrances which are developed with the use of lime seed oil as an essential component in the fragrance and perfume industry, fostering the sales of lime seed oils.
What are Various Opportunities Present for Key Players in the Lime Seed Oils Market?

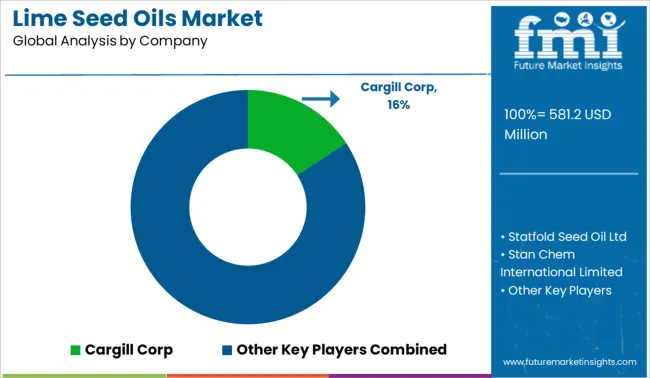
Some of the top manufacturers and suppliers of lime seed oil are Cargill Corp, Statfold Seed Oil Ltd, Stan Chem International Limited., Young Living Essential Oils LC, Phoenix Aromas & Essential Oils, LLC, Kerry Ingredients Holdings (United Kingdom) Limited., Shirley Price Aromatherapy Ltd, Sydney Essential Oil Co. Pty Limited, Citromax Flavors, Inc., etc. Symrise AG, and Ultra International Limited, among others.

The manufacturers in the lime seed oils market are increasing due to their demand among consumers.

The manufacturer should not supply adulterated and crude lime seed oil, which might affect consumers' health as well as product quality, and dwindle the lime seed oils market share.

If such lime seeds crude oil is used as an ingredient, it might spoil the texture and quality of the final product and also may contaminate and affect the quality of the end product.

To avoid such conditions, the manufacturer should focus on providing refined and purified lime seed oils.

The pre-existing manufacturers should try to reduce the production cost, which may gain them a huge profit, lime seed oils market share, and can also eventually serve at a better price than the other competitors in the market.

Nandini Roy Choudhury

Principal Consultant

Talk to Analyst

Find your sweet spots for generating winning opportunities in this market.

Report Scope

Report Attribute Details
Growth Rate CAGR of 6% from 2022 to 2032
Base Year for Estimation 2021
Historical Data 2014 to 2020
Forecast Period 2022 to 2032
Quantitative Units Revenue in USD Billion, Volume in Kilotons, and CAGR from 2022 to 2032
Report Coverage Revenue Forecast, Volume Forecast, Company Ranking, Competitive Landscape, Growth Factors, Trends, and Pricing Analysis
Segments Covered
  • Nature
  • Application
  • Distribution Channel
  • Region
Regions Covered
  • North America
  • Latin America
  • Europe
  • East Asia
  • South Asia
  • Oceania
  • Middle East and Africa
Key Countries Profiled
  • USA
  • Canada
  • Brazil
  • Argentina
  • Germany
  • United Kingdom
  • France
  • Spain
  • Italy
  • Nordics
  • BENELUX
  • Australia & New Zealand
  • China
  • India
  • ASIAN
  • GCC Countries
  • South Africa
Key Companies Profiled
  • Cargill Corp
  • Statfold Seed Oil Ltd
  • Stan Chem International Limited.
  • Young Living Essential Oils LC
  • Phoenix Aromas & Essential Oils, LLC.
  • Kerry Ingredients Holdings (U.K.) Limited.
  • Shirley Price Aromatherapy Ltd
  • Sydney Essential Oil Co. Pty Limited
  • Citromax Flavors, Inc.
  • Symrise AG
  • Ultra International Limited.
Customization Available Upon Request

Key Segments Profiled in the Lime Seed Oils Market Survey

By Nature:

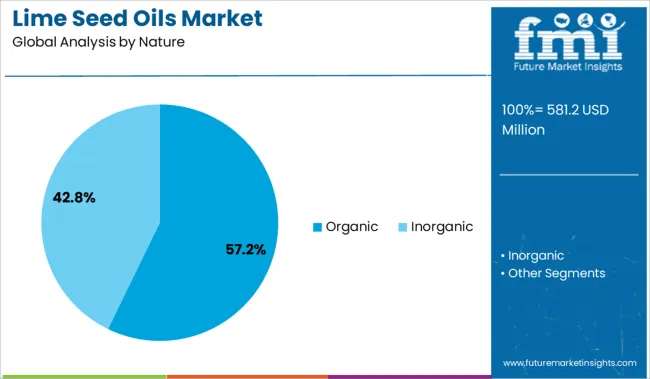
  • Organic
  • Inorganic

By Application:

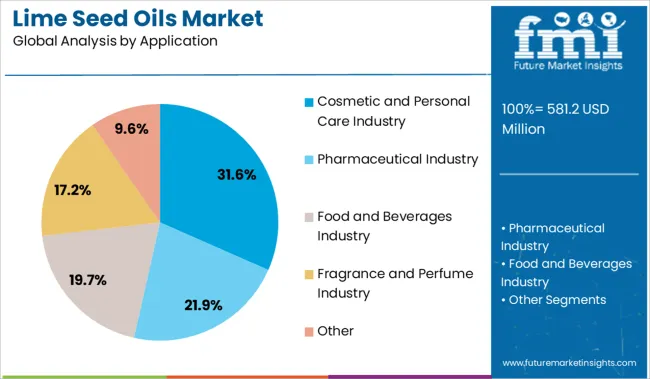
  • Cosmetic and Personal Care Industry
  • Pharmaceutical Industry
  • Food and Beverages Industry
  • Fragrance and Perfume Industry
  • Others

By Distribution Channel:

  • B2B
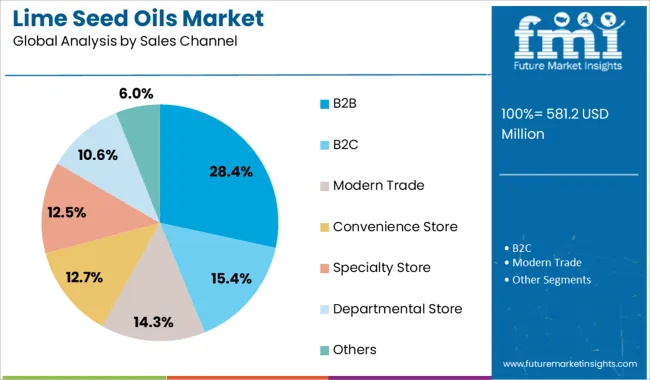
  • B2C
  • Modern Trade
  • Convenience Store
  • Specialty Store
  • Departmental Store
  • Others

By Region:

  • North America
  • Latin America
  • Europe
  • East Asia
  • South Asia
  • Oceania
  • Middle East and Africa

Get the data you need at a Fraction of the cost

Personalize your report by choosing insights you need
and save 40%!

Frequently Asked Questions

What is the Growth Outlook for the Lime Seed Oils Market?

The global lime seed oils market is projected to move forward with a CAGR of 6% from 2022 to 2032.

Which is the Future of Lime Seed Oils Market?

The lime seed oils market is projected to hold a market share of US$ 708 million by 2032.

Who are a Few Key Players in the Lime Seed Oils Market?

Some of the key players holding major global lime seed oils market share are Cargill Corp, Statfold Seed Oil Ltd, Stan Chem International Limited., Young Living Essential Oils LC, and Phoenix Aromas & Essential Oils.

Table of Content

1. Global Market Executive Summary | Lime Seed Oils Market

    1.1. Global Market Overview

    1.2. Demand Side Trends

    1.3. Supply Side Trends

    1.4. Fact.MR Analysis and Recommendations

2. Global Market Overview

    2.1. Market Coverage / Taxonomy

    2.2. Market Introduction and Definition

3. Market Risks and Trends Assessment

    3.1. Risk Assessment

        3.1.1. COVID-19 Crisis and Impact on Lime Seed Oils

        3.1.2. COVID-19 Crisis and Impact on Aprotic Solvent Prices

        3.1.3. COVID-19 Impact Benchmark with Previous Crisis

            3.1.3.1. Change in Demand

            3.1.3.2. Before and After COVID-19 Crisis (Projected)

            3.1.3.3. Before and After Sub-prime Crisis – 2008 (Actual)

            3.1.3.4. Change in Demand post Recovery Period (After Each Crisis)

        3.1.4. Impact on Market and Value (US$ Million)

            3.1.4.1. Likely Loss of Value in 2020

            3.1.4.2. Mid-term and Long-Term Forecast

            3.1.4.3. Quarter-by-Quarter Demand and Recovery Assessment

        3.1.5. Anticipated Demand and Value Recovery Curve

            3.1.5.1. Likelihood of U-Shape Recovery

            3.1.5.2. Likelihood of L-Shape Recovery

        3.1.6. Recovery Period Assessment by Key Countries

        3.1.7. Recovery Assessment by Key Market Segments

        3.1.8. Action Points and Recommendations for Suppliers

        3.1.9. Impact on Trade Balance

    3.2. Key Trends Impacting the Market

    3.3. Formulation and Nature Development Trends

4. Market Background and foundation Data Points

    4.1. Need of the Hour for Industries

    4.2. Industry Wise Industry 4.0

    4.3. Strategic Priorities

    4.4. Life Cycle Stage

    4.5. Importance of Technology

    4.6. Use Cases of Lime Seed Oils

    4.7. Forecast Factors: Relevance and Impact

    4.8. Investment Feasibility Matrix

    4.9. PESTLE Analysis

    4.10. Porter’s Five Forces Analysis

    4.11. Market Dynamics

        4.11.1. Drivers

        4.11.2. Restraints

        4.11.3. Opportunity Analysis

        4.11.4. Trend

5. Global Market Demand (US$ Million) Analysis 2017 to 2021 and Forecast, 2022 to 2032

    5.1. Historical Market Value (US$ Million) Analysis, 2017 to 2021

    5.2. Current and Future Market Value (US$ Million) Projections, 2022 to 2032

        5.2.1. Y-o-Y Growth Trend Analysis

        5.2.2. Absolute $ Opportunity Analysis

6. Global Market Analysis 2017 to 2021 and Forecast 2022 to 2032, By Nature

    6.1. Introduction / Key Findings

    6.2. Historical Market Value (US$ Million) Analysis By Nature, 2017 to 2021

    6.3. Current and Future Market Value (US$ Million) Analysis and Forecast By Nature, 2022 to 2032

        6.3.1. Organic

        6.3.2. Inorganic

    6.4. Market Attractiveness Analysis By Nature

7. Global Market Analysis 2017 to 2021 and Forecast 2022 to 2032, by Application

    7.1. Introduction / Key Findings

    7.2. Historical Market Value (US$ Million) Analysis By Application, 2017 to 2021

    7.3. Current and Future Market Value (US$ Million) Analysis and Forecast By Application, 2022 to 2032

        7.3.1. Cosmetic and Personal Care Industry

        7.3.2. Pharmaceutical Industry

        7.3.3. Food and Beverages Industry

        7.3.4. Fragrance and Perfume Industry

        7.3.5. Other

    7.4. Market Attractiveness Analysis By Application

8. Global Market Analysis 2017 to 2021 and Forecast 2022 to 2032, by Sales Channel

    8.1. Introduction / Key Findings

    8.2. Historical Market Value (US$ Million) Analysis By Sales Channel, 2017 to 2021

    8.3. Current and Future Market Value (US$ Million) Analysis and Forecast By Sales Channel, 2022 to 2032

        8.3.1. B2B

        8.3.2. B2C

        8.3.3. Modern Trade

        8.3.4. Convenience Store

        8.3.5. Specialty Store

        8.3.6. Departmental Store

        8.3.7. Others

    8.4. Market Attractiveness Analysis By Sales Channel

9. Global Market Analysis 2017 to 2021 and Forecast 2022 to 2032, by Region

    9.1. Introduction / Key Findings

    9.2. Historical Market Value (US$ Million) Analysis By Region, 2017 to 2021

    9.3. Current and Future Market Value (US$ Million) Analysis and Forecast By Region, 2022 to 2032

        9.3.1. North America

        9.3.2. Latin America

        9.3.3. Europe

        9.3.4. East Asia

        9.3.5. South Asia & Oceania

        9.3.6. Middle East and Africa (MEA)

    9.4. Market Attractiveness Analysis By Region

10. North America Market Analysis 2017 to 2021 and Forecast 2022 to 2032

    10.1. Introduction / Key Findings

    10.2. Historical Market Value (US$ Million) Trend Analysis By Market Taxonomy, 2017 to 2021

    10.3. Market Value (US$ Million) Forecast By Market Taxonomy, 2022 to 2032

        10.3.1. By Country

            10.3.1.1. USA

            10.3.1.2. Canada

        10.3.2. By Nature

        10.3.3. By Application

    10.4. Market Attractiveness Analysis

        10.4.1. By Country

        10.4.2. By Nature

        10.4.3. By Application

11. Latin America Market Analysis 2017 to 2021 and Forecast 2022 to 2032

    11.1. Introduction / Key Findings

    11.2. Historical Market Size (US$ Million) Trend Analysis By Market Taxonomy, 2017 to 2021

    11.3. Current and Future Market Value (US$ Million) Analysis and Forecast By Region, 2022 to 2032

        11.3.1. By Country

            11.3.1.1. Brazil

            11.3.1.2. Mexico

            11.3.1.3. Rest of Latin America

        11.3.2. By Nature

        11.3.3. By Application

        11.3.4. By Sales Channel

    11.4. Market Attractiveness Analysis

        11.4.1. By Country

        11.4.2. By Nature

        11.4.3. By Application

        11.4.4. By Sales Channel

12. Europe Market Analysis 2017 to 2021 and Forecast 2022 to 2032

    12.1. Introduction / Key Findings

    12.2. Historical Market Size (US$ Million) Trend Analysis By Market Taxonomy, 2017 to 2021

    12.3. Current and Future Market Value (US$ Million) Analysis and Forecast By Region, 2022 to 2032

        12.3.1. By Country

            12.3.1.1. Germany

            12.3.1.2. France

            12.3.1.3. Italy

            12.3.1.4. Spain

            12.3.1.5. United Kingdom

            12.3.1.6. BENELUX

            12.3.1.7. Russia

            12.3.1.8. Rest of Europe

        12.3.2. By Nature

        12.3.3. By Application

        12.3.4. By Sales Channel

    12.4. Market Attractiveness Analysis

        12.4.1. By Country

        12.4.2. By Nature

        12.4.3. By Application

        12.4.4. By Sales Channel

13. East Asia Market Analysis 2017 to 2021 and Forecast 2022 to 2032

    13.1. Introduction / Key Findings

    13.2. Historical Market Size (US$ Million) Trend Analysis By Market Taxonomy, 2017 to 2021

    13.3. Current and Future Market Value (US$ Million) Analysis and Forecast By Region, 2022 to 2032

        13.3.1. By Country

            13.3.1.1. China

            13.3.1.2. Japan

            13.3.1.3. South Korea

        13.3.2. By Nature

        13.3.3. By Application

        13.3.4. By Sales Channel

    13.4. Market Attractiveness Analysis

        13.4.1. By Country

        13.4.2. By Nature

        13.4.3. By Application

        13.4.4. By Sales Channel

14. South Asia & Oceania Market Analysis 2017 to 2021 and Forecast 2022 to 2032

    14.1. Introduction / Key Findings

    14.2. Historical Market Size (US$ Million) Trend Analysis By Market Taxonomy, 2017 to 2021

    14.3. Current and Future Market Value (US$ Million) Analysis and Forecast By Region, 2022 to 2032

        14.3.1. By Country

            14.3.1.1. India

            14.3.1.2. Thailand

            14.3.1.3. Malaysia

            14.3.1.4. Singapore

            14.3.1.5. Vietnam

            14.3.1.6. Australia and New Zealand

            14.3.1.7. Rest of South Asia & Oceania

        14.3.2. By Nature

        14.3.3. By Application

        14.3.4. By Sales Channel

    14.4. Market Attractiveness Analysis

        14.4.1. By Country

        14.4.2. By Nature

        14.4.3. By Application

        14.4.4. By Sales Channel

15. Middle East and Africa Market Analysis 2017 to 2021 and Forecast 2022 to 2032

    15.1. Introduction / Key Findings

    15.2. Historical Market Size (US$ Million) Trend Analysis By Market Taxonomy, 2017 to 2021

    15.3. Current and Future Market Value (US$ Million) Analysis and Forecast By Region, 2022 to 2032

        15.3.1. By Country

            15.3.1.1. GCC Countries

            15.3.1.2. South Africa

            15.3.1.3. Israel

            15.3.1.4. Rest of Middle East and Africa (MEA)

        15.3.2. By Nature

        15.3.3. By Application

        15.3.4. By Sales Channel

    15.4. Market Attractiveness Analysis

        15.4.1. By Country

        15.4.2. By Nature

        15.4.3. By Application

        15.4.4. By Sales Channel

16. Market Structure Analysis

    16.1. Market Analysis by Tier of Companies

    16.2. Market Concentration

    16.3. Market Share Analysis of Top Players

    16.4. Market Presence Analysis

17. Competition Analysis

    17.1. Competition Dashboard

    17.2. Competition Benchmarking

    17.3. Competition Deep Dive

    17.4. Cargill Corp

        17.4.1. Company Overview

        17.4.2. Nature overview

        17.4.3. SWOT Analysis

        17.4.4. Key Developments

    17.5. Statfold Seed Oil Ltd

        17.5.1. Company Overview

        17.5.2. Nature overview

        17.5.3. SWOT Analysis

        17.5.4. Key Developments

    17.6. Stan Chem International Limited.

        17.6.1. Company Overview

        17.6.2. Nature overview

        17.6.3. SWOT Analysis

        17.6.4. Key Developments

    17.7. Young Living Essential Oils LC

        17.7.1. Company Overview

        17.7.2. Nature overview

        17.7.3. SWOT Analysis

        17.7.4. Key Developments

    17.8. Phoenix Aromas & Essential Oils, LLC.

        17.8.1. Company Overview

        17.8.2. Nature overview

        17.8.3. SWOT Analysis

        17.8.4. Key Developments

    17.9. Kerry Ingredients Holdings (United Kingdom) Limited.

        17.9.1. Company Overview

        17.9.2. Nature overview

        17.9.3. SWOT Analysis

        17.9.4. Key Developments

    17.10. Shirley Price Aromatherapy Ltd

        17.10.1. Company Overview

        17.10.2. Nature overview

        17.10.3. SWOT Analysis

        17.10.4. Key Developments

    17.11. Sydney Essential Oil Co. Pty Limited

        17.11.1. Company Overview

        17.11.2. Nature overview

        17.11.3. SWOT Analysis

        17.11.4. Key Developments

    17.12. Citromax Flavors, Inc.

        17.12.1. Company Overview

        17.12.2. Nature overview

        17.12.3. SWOT Analysis

        17.12.4. Key Developments

    17.13. Symrise AG

        17.13.1. Company Overview

        17.13.2. Nature overview

        17.13.3. SWOT Analysis

        17.13.4. Key Developments

    17.14. Ultra International Limited.

        17.14.1. Company Overview

        17.14.2. Nature overview

        17.14.3. SWOT Analysis

        17.14.4. Key Developments

18. Assumptions And Acronyms Used

19. Research Methodology

Don't pay for what you don't need

Customize your report by selecting specific countries or regions and save 30%!

List of Tables

Table 1: Global Market Value (US$ Million) Analysis, by Nature, 2017 to 2021

Table 2: Global Market Value (US$ Million) Analysis, by Nature, 2022 to 2032

Table 3: Global Market Value (US$ Million) Opportunity Analysis, by Nature, 2022 to 2032

Table 4: Global Market Value (US$ Million) Analysis, by Application, 2017 to 2021

Table 5: Global Market Value (US$ Million) Analysis, by Application, 2022 to 2032

Table 6: Global Market Value (US$ Million) Opportunity Analysis, by Application, 2022 to 2032

Table 7: Global Market Value (US$ Million) Analysis, by Sales Channel, 2017 to 2021

Table 8: Global Market Value (US$ Million) Analysis, by Sales Channel, 2022 to 2032

Table 9: Global Market Value (US$ Million) Opportunity Analysis, by Sales Channel, 2022 to 2032

Table 10: Global Market Value (US$ Million) Analysis, by Region, 2017 to 2021

Table 11: Global Market Value (US$ Million) Analysis, by Region, 2022 to 2032

Table 12: Global Market Value (US$ Million) Opportunity Analysis, by Region, 2022 to 2032

Table 13: North America Market Value (US$ Million) Analysis, by Country, 2017 to 2021

Table 14: North America Market Value (US$ Million) Analysis, by Country, 2022 to 2032

Table 15: North America Market Value (US$ Million) Opportunity Analysis, by Country, 2022 to 2032

Table 16: North America Market Value (US$ Million) Analysis, by Nature, 2017 to 2021

Table 17: North America Market Value (US$ Million) Analysis, by Nature, 2022 to 2032

Table 18: North America Market Value (US$ Million) Opportunity Analysis, by Nature, 2022 to 2032

Table 19: North America Market Value (US$ Million) Analysis, by Application, 2017 to 2021

Table 20: North America Market Value (US$ Million) Analysis, by Application, 2022 to 2032

Table 21: North America Market Value (US$ Million) Opportunity Analysis, by Application, 2022 to 2032

Table 22: North America Market Value (US$ Million) Analysis, by Sales Channel, 2017 to 2021

Table 23: North America Market Value (US$ Million) Analysis, by Sales Channel, 2022 to 2032

Table 24: North America Market Value (US$ Million) Opportunity Analysis, by Sales Channel, 2022 to 2032

Table 25: Latin America Market Value (US$ Million) Analysis, by Country, 2017 to 2021

Table 26: Latin America Market Value (US$ Million) Analysis, by Country, 2022 to 2032

Table 27: Latin America Market Value (US$ Million) Opportunity Analysis, by Country, 2022 to 2032

Table 28: Latin America Market Value (US$ Million) Analysis, by Nature, 2017 to 2021

Table 29: Latin America Market Value (US$ Million) Analysis, by Nature, 2022 to 2032

Table 30: Latin America Market Value (US$ Million) Opportunity Analysis, by Nature, 2022 to 2032

Table 31: Latin America Market Value (US$ Million) Analysis, by Application, 2017 to 2021

Table 32: Latin America Market Value (US$ Million) Analysis, by Application, 2022 to 2032

Table 33: Latin America Market Value (US$ Million) Opportunity Analysis, by Application, 2022 to 2032

Table 34: Latin America Market Value (US$ Million) Analysis, by Sales Channel, 2017 to 2021

Table 35: Latin America Market Value (US$ Million) Analysis, by Sales Channel, 2022 to 2032

Table 36: Latin America Market Value (US$ Million) Opportunity Analysis, by Sales Channel, 2022 to 2032

Table 37: Europe Market Value (US$ Million) Analysis, by Country, 2017 to 2021

Table 38: Europe Market Value (US$ Million) Analysis, by Country, 2022 to 2032

Table 39: Europe Market Value (US$ Million) Opportunity Analysis, by Country, 2022 to 2032

Table 40: Europe Market Value (US$ Million) Analysis, by Nature, 2017 to 2021

Table 41: Europe Market Value (US$ Million) Analysis, by Nature, 2022 to 2032

Table 42: Europe Market Value (US$ Million) Opportunity Analysis, by Nature, 2022 to 2032

Table 43: Europe Market Value (US$ Million) Analysis, by Application, 2017 to 2021

Table 44: Europe Market Value (US$ Million) Analysis, by Application, 2022 to 2032

Table 45: Europe Market Value (US$ Million) Opportunity Analysis, by Application, 2022 to 2032

Table 46: Europe Market Value (US$ Million) Analysis, by Sales Channel, 2017 to 2021

Table 47: Europe Market Value (US$ Million) Analysis, by Sales Channel, 2022 to 2032

Table 48: Europe Market Value (US$ Million) Opportunity Analysis, by Sales Channel, 2022 to 2032

Table 49: East Asia Market Value (US$ Million) Analysis, by Country, 2017 to 2021

Table 50: East Asia Market Value (US$ Million) Analysis, by Country, 2022 to 2032

Table 51: East Asia Market Value (US$ Million) Opportunity Analysis, by Country, 2022 to 2032

Table 52: East Asia Market Value (US$ Million) Analysis, by Nature, 2017 to 2021

Table 53: East Asia Market Value (US$ Million) Analysis, by Nature, 2022 to 2032

Table 54: East Asia Market Value (US$ Million) Opportunity Analysis, by Nature, 2022 to 2032

Table 55: East Asia Market Value (US$ Million) Analysis, by Application, 2017 to 2021

Table 56: East Asia Market Value (US$ Million) Analysis, by Application, 2022 to 2032

Table 57: East Asia Market Value (US$ Million) Opportunity Analysis, by Application, 2022 to 2032

Table 58: East Asia Market Value (US$ Million) Analysis, by Sales Channel, 2017 to 2021

Table 59: East Asia Market Value (US$ Million) Analysis, by Sales Channel, 2022 to 2032

Table 60: East Asia Market Value (US$ Million) Opportunity Analysis, by Sales Channel, 2022 to 2032

Table 61: South Asia & Oceania Market Value (US$ Million) Analysis, by Country, 2017 to 2021

Table 62: South Asia & Oceania Market Value (US$ Million) Analysis, by Country, 2022 to 2032

Table 63: South Asia & Oceania Market Value (US$ Million) Opportunity Analysis, by Country, 2022 to 2032

Table 64: South Asia & Oceania Market Value (US$ Million) Analysis, by Nature, 2017 to 2021

Table 65: South Asia & Oceania Market Value (US$ Million) Analysis, by Nature, 2022 to 2032

Table 66: South Asia & Oceania Market Value (US$ Million) Opportunity Analysis, by Nature, 2022 to 2032

Table 67: South Asia & Oceania Market Value (US$ Million) Analysis, by Application, 2017 to 2021

Table 68: South Asia & Oceania Market Value (US$ Million) Analysis, by Application, 2022 to 2032

Table 69: South Asia & Oceania Market Value (US$ Million) Opportunity Analysis, by Application, 2022 to 2032

Table 70: South Asia & Oceania Market Value (US$ Million) Analysis, by Sales Channel, 2017 to 2021

Table 71: South Asia & Oceania Market Value (US$ Million) Analysis, by Sales Channel, 2022 to 2032

Table 72: South Asia & Oceania Market Value (US$ Million) Opportunity Analysis, by Sales Channel, 2022 to 2032

Table 73: MEA Market Value (US$ Million) Analysis, by Country, 2017 to 2021

Table 74: MEA Market Value (US$ Million) Analysis, by Country, 2022 to 2032

Table 75: MEA Market Value (US$ Million) Opportunity Analysis, by Country, 2022 to 2032

Table 76: MEA Market Value (US$ Million) Analysis, by Nature, 2017 to 2021

Table 77: MEA Market Value (US$ Million) Analysis, by Nature, 2022 to 2032

Table 78: MEA Market Value (US$ Million) Opportunity Analysis, by Nature, 2022 to 2032

Table 79: MEA Market Value (US$ Million) Analysis, by Application, 2017 to 2021

Table 80: MEA Market Value (US$ Million) Analysis, by Application, 2022 to 2032

Table 81: MEA Market Value (US$ Million) Opportunity Analysis, by Application, 2022 to 2032

Table 82: MEA Market Value (US$ Million) Analysis, by Sales Channel, 2017 to 2021

Table 83: MEA Market Value (US$ Million) Analysis, by Sales Channel, 2022 to 2032

Table 84: MEA Market Value (US$ Million) Opportunity Analysis, by Sales Channel, 2022 to 2032
Nandini Roy Choudhury

Principal Consultant

Talk to Analyst

Find your sweet spots for generating winning opportunities in this market.

List of Charts

Figure 1: Global Market Value (US$ Million) Historical Analysis, 2017 to 2021

Figure 2: Global Market Value (US$ Million) Forecast and Analysis, 2022 to 2032

Figure 3: Global Market Value Y-o-Y Growth and Forecast, 2017 to 2032

Figure 4: Global Market Incremental $ Opportunity, 2022 to 2032

Figure 5: Global Market Share and BPS Analysis by Nature, 2022 & 2032

Figure 6: Global Market Y-o-Y Growth Projections by Nature, 2022 to 2032

Figure 7: Global Market Attractiveness Analysis by Nature, 2022 to 2032

Figure 8: Global Market Share and BPS Analysis by Application, 2022 & 2032

Figure 9: Global Market Y-o-Y Growth Projections by Application, 2022 to 2032

Figure 10: Global Market Attractiveness Analysis by Application, 2022 to 2032

Figure 11: Global Market Share and BPS Analysis by Sales Channel, 2022 & 2032

Figure 12: Global Market Y-o-Y Growth Projections by Sales Channel, 2022 to 2032

Figure 13: Global Market Attractiveness Analysis by Sales Channel, 2022 to 2032

Figure 14: Global Market Share and BPS Analysis by Region, 2022 & 2032

Figure 15: Global Market Y-o-Y Growth Projections by Region, 2022 to 2032

Figure 16: Global Market Attractiveness Analysis by Region, 2022 to 2032

Figure 17: North America Market Value (US$ Million) Historical Analysis, 2017 to 2021

Figure 18: North America Market Value (US$ Million) Forecast and Analysis, 2022 to 2032

Figure 19: North America Market Value Y-o-Y Growth and Forecast, 2032

Figure 20: North America Market Incremental $ Opportunity, 2022 to 2032

Figure 21: North America Market Share Analysis by Country, 2022 & 2032

Figure 22: North America Market Y-o-Y Growth Projection by Country, 2022 to 2032

Figure 23: North America Market Attractiveness Analysis by Country, 2022 to 2032

Figure 24: North America Market Share and BPS Analysis by Nature, 2022 & 2032

Figure 25: North America Market Y-o-Y Growth Projections by Nature, 2022 to 2032

Figure 26: North America Market Attractiveness Analysis by Nature, 2022 to 2032

Figure 27: North America Market Share and BPS Analysis by Application, 2022 & 2032

Figure 28: North America Market Y-o-Y Growth Projections by Application, 2022 to 2032

Figure 29: North America Market Attractiveness Analysis by Application, 2022 to 2032

Figure 30: North America Market Share and BPS Analysis by Sales Channel, 2022 & 2032

Figure 31: North America Market Y-o-Y Growth Projections by Sales Channel, 2022 to 2032

Figure 32: North America Market Attractiveness Analysis by Sales Channel, 2022 to 2032

Figure 33: Latin America Market Value (US$ Million) Historical Analysis, 2017 to 2021

Figure 34: Latin America Market Value (US$ Million) Forecast and Analysis, 2022 to 2032

Figure 35: Latin America Market Value Y-o-Y Growth and Forecast, 2017 to 2032

Figure 36: Latin America Market Incremental $ Opportunity, 2022 to 2032

Figure 37: Latin America Market Share Analysis by Country, 2022 & 2032

Figure 38: Latin America Market Y-o-Y Growth Projection by Country, 2022 to 2032

Figure 39: Latin America Market Attractiveness Analysis by Country, 2022 to 2032

Figure 40: Latin America Market Share and BPS Analysis by Nature, 2022 & 2032

Figure 41: Latin America Market Y-o-Y Growth Projections by Nature, 2022 to 2032

Figure 42: Latin America Market Attractiveness Analysis by Nature, 2022 to 2032

Figure 43: Latin America Market Share and BPS Analysis by Application, 2022 & 2032

Figure 44: Latin America Market Y-o-Y Growth Projections by Application, 2022 to 2032

Figure 45: Latin America Market Attractiveness Analysis by Application, 2022 to 2032

Figure 46: Latin America Market Share and BPS Analysis by Sales Channel, 2022 & 2032

Figure 47: Latin America Market Y-o-Y Growth Projections by Sales Channel, 2022 to 2032

Figure 48: Latin America Market Attractiveness Analysis by Sales Channel, 2022 to 2032

Figure 49: Europe Market Value (US$ Million) Historical Analysis, 2017 to 2021

Figure 50: Europe Market Value (US$ Million) Forecast and Analysis, 2022 to 2032

Figure 51: Europe Market Value Y-o-Y Growth and Forecast, 2017 to 2032

Figure 52: Europe Market Incremental $ Opportunity, 2022 to 2032

Figure 53: Europe Market Share Analysis by Country, 2022 & 2032

Figure 54: Europe Market Y-o-Y Growth Projection by Country, 2022 to 2032

Figure 55: Europe Market Attractiveness Analysis by Country, 2022 to 2032

Figure 56: Europe Market Share and BPS Analysis by Nature, 2022 & 2032

Figure 57: Europe Market Y-o-Y Growth Projections by Nature, 2022 to 2032

Figure 58: Europe Market Attractiveness Analysis by Nature, 2022 to 2032

Figure 59: Europe Market Share and BPS Analysis by Application, 2022 & 2032

Figure 60: Europe Market Y-o-Y Growth Projections by Application, 2022 to 2032

Figure 61: Europe Market Attractiveness Analysis by Application, 2022 to 2032

Figure 62: Europe Market Share and BPS Analysis by Sales Channel, 2022 & 2032

Figure 63: Europe Market Y-o-Y Growth Projections by Sales Channel, 2022 to 2032

Figure 64: Europe Market Attractiveness Analysis by Sales Channel, 2022 to 2032

Figure 65: East Asia Market Value (US$ Million) Historical Analysis, 2017 to 2021

Figure 66: East Asia Market Value (US$ Million) Forecast and Analysis, 2022 to 2032

Figure 67: East Asia Market Value Y-o-Y Growth and Forecast, 2017 to 2032

Figure 68: East Asia Market Incremental $ Opportunity, 2022 to 2032

Figure 69: East Asia Market Share Analysis by Country, 2022 & 2032

Figure 70: East Asia Market Y-o-Y Growth Projection by Country, 2022 to 2032

Figure 71: East Asia Market Attractiveness Analysis by Country, 2022 to 2032

Figure 72: East Asia Market Share and BPS Analysis by Nature, 2022 & 2032

Figure 73: East Asia Market Y-o-Y Growth Projections by Nature, 2022 to 2032

Figure 74: East Asia Market Attractiveness Analysis by Nature, 2022 to 2032

Figure 75: East Asia Market Share and BPS Analysis by Application, 2022 & 2032

Figure 76: East Asia Market Y-o-Y Growth Projections by Application, 2022 to 2032

Figure 77: East Asia Market Attractiveness Analysis by Application, 2022 to 2032

Figure 78: East Asia Market Share and BPS Analysis by Sales Channel, 2022 & 2032

Figure 79: East Asia Market Y-o-Y Growth Projections by Sales Channel, 2022 to 2032

Figure 80: East Asia Market Attractiveness Analysis by Sales Channel, 2022 to 2032

Figure 81: South Asia & Oceania Market Value (US$ Million) Historical Analysis, 2017 to 2021

Figure 82: South Asia & Oceania Market Value (US$ Million) Forecast and Analysis, 2022 to 2032

Figure 83: South Asia & Oceania Market Value Y-o-Y Growth and Forecast, 2017 to 2032

Figure 84: South Asia & Oceania Market Incremental $ Opportunity, 2022 to 2032

Figure 85: South Asia & Oceania Market Share Analysis by Country, 2022 & 2032

Figure 86: South Asia & Oceania Market Y-o-Y Growth Projection by Country, 2022 to 2032

Figure 87: South Asia & Oceania Market Attractiveness Analysis by Country, 2022 to 2032

Figure 88: South Asia & Oceania Market Share and BPS Analysis by Nature, 2022 & 2032

Figure 89: South Asia & Oceania Market Y-o-Y Growth Projections by Nature, 2022 to 2032

Figure 90: South Asia & Oceania Market Attractiveness Analysis by Nature, 2022 to 2032

Figure 91: South Asia & Oceania Market Share and BPS Analysis by Application, 2022 & 2032

Figure 92: South Asia & Oceania Market Y-o-Y Growth Projections by Application, 2022 to 2032

Figure 93: South Asia & Oceania Market Attractiveness Analysis by Application, 2022 to 2032

Figure 94: South Asia & Oceania Market Share and BPS Analysis by Sales Channel, 2022 & 2032

Figure 95: South Asia & Oceania Market Y-o-Y Growth Projections by Sales Channel, 2022 to 2032

Figure 96: South Asia & Oceania Market Attractiveness Analysis by Sales Channel, 2022 to 2032

Figure 97: MEA Market Value (US$ Million) Historical Analysis, 2017 to 2021

Figure 98: MEA Market Value (US$ Million) Forecast and Analysis, 2022 to 2032

Figure 99: MEA Market Value Y-o-Y Growth and Forecast, 2017 to 2032

Figure 100: MEA Market Incremental $ Opportunity, 2022 to 2032

Figure 101: MEA Market Share Analysis by Country, 2022 & 2032

Figure 102: MEA Market Y-o-Y Growth Projection by Country, 2022 to 2032

Figure 103: MEA Market Attractiveness Analysis by Country, 2022 to 2032

Figure 104: MEA Market Share and BPS Analysis by Nature, 2022 & 2032

Figure 105: MEA Market Y-o-Y Growth Projections by Nature, 2022 to 2032

Figure 106: MEA Market Attractiveness Analysis by Nature, 2022 to 2032

Figure 107: MEA Market Share and BPS Analysis by Application, 2022 & 2032

Figure 108: MEA Market Y-o-Y Growth Projections by Application, 2022 to 2032

Figure 109: MEA Market Attractiveness Analysis by Application, 2022 to 2032

Figure 110: MEA Market Share and BPS Analysis by Sales Channel, 2022 & 2032

Figure 111: MEA Market Y-o-Y Growth Projections by Sales Channel, 2022 to 2032

Figure 112: MEA Market Attractiveness Analysis by Sales Channel, 2022 to 2032

Recommendations

Food and Beverage

Hemp Seed Oil Market

Published : July 2023

Food and Beverage

Strawberry Seed Oil Market

Published : December 2022

Food and Beverage

Apple Seed Oil Market

Published : June 2022

Food and Beverage

Cottonseed Oil Market

Published : November 2018

Explore Food and Beverage Insights

View Reports