Reports

- Global Locations -

Headquarters

Future Market Insights, Inc.

Christiana Corporate, 200
Continental Drive, Suite 401,
Newark, Delaware - 19713,
United States

T: +1-845-579-5705

Americas

Future Market Insights, Inc.

616 Corporate Way, Suite 2-9018,
Valley Cottage, NY 10989, United States

T: +1-347-918-3531

MEA

Future Market Insights

1602-6 Jumeirah Bay X2 Tower, Plot No: JLT-PH2-X2A,
Jumeirah Lakes Towers, Dubai,
United Arab Emirates

Europe

Future Market Insights

3rd Floor, 207 Regent Street,
W1B 3HH London
United Kingdom

T: + 44 (0) 20 8123 9659
D: +44 (0) 20 3287 4268

Asia Pacific

Future Market Insights

IndiaLand Global Tech Park, Unit UG-1, Behind Grand HighStreet, Phase 1, Hinjawadi, MH, Pune – 411057, India

Mussel Extract Market Snapshot (2022 to 2032)

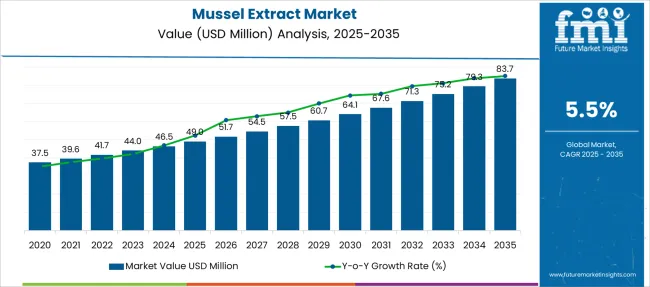
The global mussel extract market size is expected to reach US$ 71.30 Million in 2032. The mussel extract market is growing rapidly.

As per FMI Analysts, the global Mussel extract market is estimated to be valued at US$ 41.74 Million in 2022 and is projected to increase at a CAGR of 5.5% in the forecast period from 2022 to 2032.

Report Attribute Details
Mussel Extract Market Estimated Base Year Value (2021) US$ 39.56 Million
Mussel Extract Market Expected Market Value (2022) US$ 41.74 Million
Mussel Extract Market Anticipated Forecast Value (2032) US$ 71.30 Million
Mussel Extract Market Projected Growth Rate (2022 to 2032) 5.5% CAGR

Mussels are revered in different countries, due to health issues such as arthritis and osteoporosis, consumers are becoming health-conscious and moving towards health-beneficial foods like mussel extract, which enables the better function of nerve cells and tissue sensitivity. Mussel extract is used to manufacture various dietary supplements and immunity supplements as well.

There is an increasing demand for mussel extract as it is beneficial in increasing fertility and the immune system functions in consumers, which is why many manufacturers are already using mussel extract in their curtailments due to its increasing health benefits and its popularity among consumers.

Mussel extract is more in demand in the animal feed manufacturing industry in order to improve animal nutrition. There are a lot of opportunities in the mussel extract market, and manufacturers need to plan their systemic investment budget along with payment of GST before shipment to avoid huge custom duty.

To maintain in the market, new players should enter with a price rate challenge, and players should have extensive outsourcing experience so that their mussel extract can be sold at a lower rate but at a similar or better quality to other corresponding manufacturers.

Companies like these are focusing on entering new markets for their products and also expanding their product offerings and portfolios to gain more mussel extract market share.

The APAC market accounted for the lion's share of the market in 2018 and will continue to dominate in the forecast years. This is due to the high product demand for mussel extract, driven by the rising target population in the region. The product is used for the treatment of joint problems and rheumatoid arthritis. The cosmetics industry is expected to grow dramatically, especially in South Korea, due to a rapidly expanding cosmetics and personal care industry.

Nevertheless, Europe is set to experience maximum growth between 2019 and 2025 due to the increasing population and rise in health consciousness. Moreover, France, in particular, is the region's major market for live and frozen mussels.

Accordingly, in April 2014, the European Commission of the Common Fisheries Policy Reform and Strategic Guidelines passed a policy with the aim of promoting the aquaculture business in Europe. This will contribute to the rapid expansion of the aquaculture sector in Nordic and English countries and the growth of the mussel extract market regionally.

Don't pay for what you don't need

Customize your report by selecting specific countries or regions and save 30%!

What are the Various Factors Driving the Mussel Extract Market?

The mussel extract market has received a lot of traction in the industry.

Whether it's seafood or supplements, mussels are popular around the world. With more and more health concerns such as arthritis and bone diseases, consumers are moving towards health benefits from foods such as mussel extract, which has the ability to improve nerve cell function, increase bone and tissue sensitivity, and is included in products such as supplement immunity boosters and nutritional supplements, these factors, in turn, are boosting the mussel extract market growth.

As a result of increased pollution resulting in hazardous work environments and a hectic work-life schedule, and the consumption of tobacco and alcohol, infertility is increasing in both women and men. Mussels also contribute to boosting immunity in consumers, bringing higher demand to the mussel extract market. Due to the health benefits of mussel extract and consumers' demand, there is a growing number of manufacturers using mussel extract in their products.

Higher demand for mussel extract exists in the animal feed industry to enhance the nutritional content of the animal feed. There are a lot of opportunities in the mussel extract market, but the manufacturer should understand the systemic investment budget together with proper planning, for example, purchasing mussels from aquaculture vendors at a cheaper rate and paying GST before shipping to prevent heavy customs duty.

In order to stay relevant in the market, new players need to enter the market with a challenging price rate. Players should have the maximum outsourcing knowledge in order to generate sales of mussel extract as an ingredient to other corresponding manufacturers at a low rate while maintaining that same or better quality than other competitors.
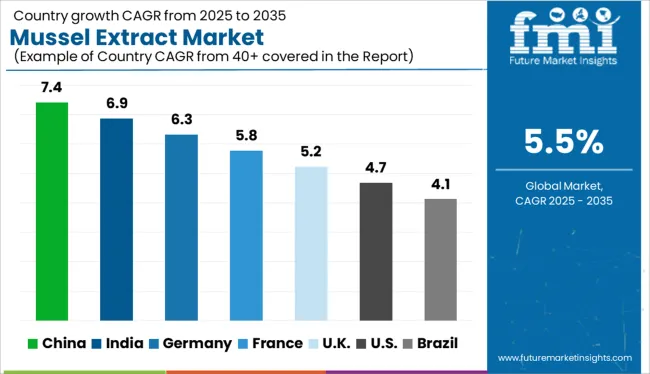
What is Regional Analysis of Mussel Extract Market Share?

The use of mussel extract has been shown to boost fertility and immune power in consumers, hence, triggering the demand for mussel extract among manufacturers. This has led to the mushroom extract market booming, with many manufacturers already using mussel extract for their products based on consumers' and health benefits.

In 2018, the Asia Pacific held the top market position and was expected to maintain that position throughout the forecast years, owing to the high product demand for mussel extract stemming from the increasing target population in the region. This product is primarily used in treating rheumatoid arthritis and joint-related conditions. Additionally, the global cosmetic market is predicted to benefit from the rapid expansion of the cosmetics and personal care industry, especially in South Korea.

It is expected, however, that Europe will witness the highest growth rate in the mussel extract market from 2019 to 2025 due to an increasing population and increased health consciousness. In addition, Britain is the second-largest producer of live and frozen mussels in this region, while France accounts for the largest imports.

Accordingly, in April 2014, the European Commission of the Common Fisheries Policy Reform and Strategic Guidelines passed a policy with the aim of promoting the aquaculture business in Europe. This will contribute to the rapid expansion of the aquaculture sector in Nordic and English countries and the growth of the mussel extract market regionally.
Nandini Roy Choudhury

Principal Consultant

Talk to Analyst

Find your sweet spots for generating winning opportunities in this market.

What is the Competition Landscape in the Mussel Extract Market?

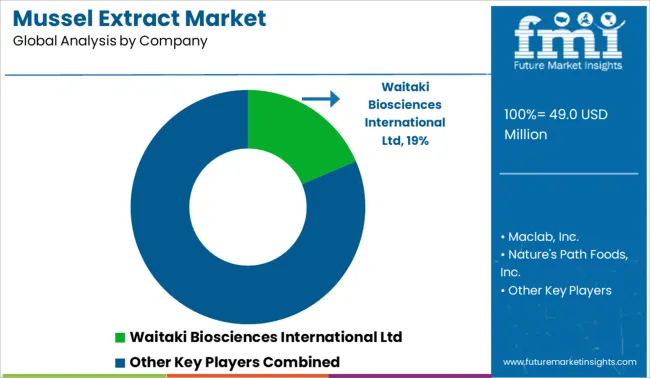
Some of the leading companies operating in the global mussel extract market include Waitaki Biosciences International Ltd., Maclab, Inc., Nature's Path Foods, Inc., Great HealthWorks Inc., and Navchetana Kendra Agra.

They are also seeking to expand their portfolios and create innovative products to increase the mussel extract market share. The companies are focusing on entering newer markets to increase product sales.

A company named Korure Ltd expanded its market in China in 2018 by providing anti-inflammatory phospholipid extract products to the country. Sanford Health launched a range of nutraceutical products in November of the same year.

Aroma New Zealand uses Flash-drying technology to dehydrate heat-sensitive products such as slurries, bioactive proteins, granules, and powders. It permits high temperatures and ensures the highest quality of the final product. This technology allows the formulation of GlycOmega mussel powder in just 5 minutes with no loss of Omega-3 lipids and bioactive proteins, propelling the growth objectives of the global mussel extract market.

Report Scope

Report Attribute Details
Growth Rate CAGR of 5.5% from 2022 to 2032
Base Year for Estimation 2021
Historical Data 2015 to 2021
Forecast Period 2022 to 2032
Quantitative Units Revenue in USD Billion, Volume in Kilotons, and CAGR from 2022 to 2032
Report Coverage Revenue Forecast, Volume Forecast, Company Ranking, Competitive Landscape, Growth Factors, Trends, and Pricing Analysis
Segments Covered
  • End User
  • Form
  • Distribution Channels
Regions Covered
  • North America
  • Latin America
  • Europe
  • East Asia
  • South Asia
  • Oceania
  • Middle East and Africa
Key Countries Profiled
  • USA
  • Canada
  • Brazil
  • Mexico
  • Germany
  • United Kingdom
  • France
  • Spain
  • Italy
  • Russia
  • Poland
  • Australia
  • New Zealand
  • China
  • India
  • Japan
  • South Korea
  • Thailand
  • Malaysia
  • Vietnam
  • Indonesia
  • GCC Countries
  • Turkey
  • South Africa
  • North Africa
Key Companies Profiled
  • Waitaki Biosciences International Ltd
  • Maclab, Inc.
  • Nature's Path Foods, Inc.
  • Great HealthWorks Inc.
  • Navchetana Kendra Agra.
Customization Available Upon Request

Get the data you need at a Fraction of the cost

Personalize your report by choosing insights you need
and save 40%!

Key Segments Profiled in the Mussel Extract Market

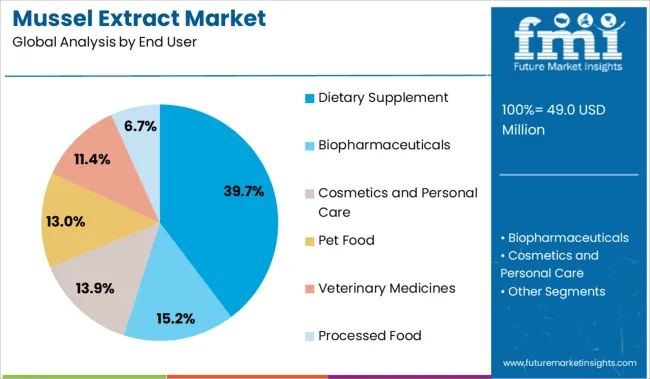
By End Users:

  • Dietary supplement
  • Biopharmaceuticals
  • Cosmetics and personal care
  • Pet food
  • Veterinary medicines
  • Processed food

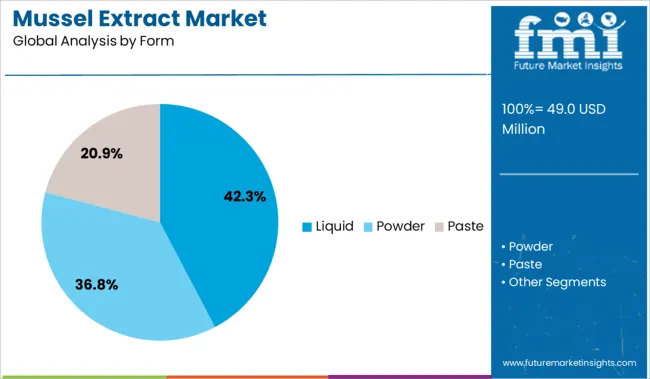
By Form:

  • Liquid
  • Powder
  • Paste

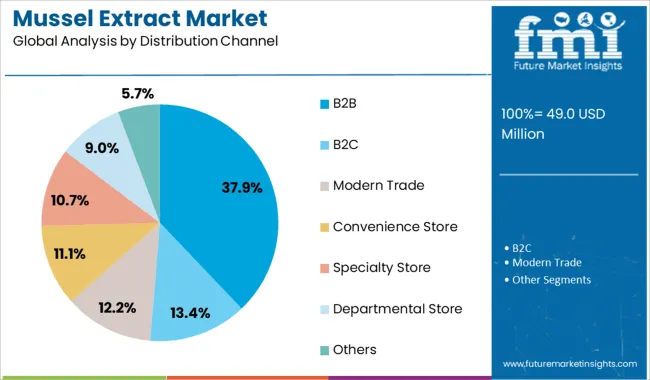
By Distribution Channels:

  • B2B
  • B2C
  • Modern Trade
  • Convenience Store
  • Specialty Store
  • Departmental Store
  • Others

By Region:

  • North America
  • Latin America
  • Europe
  • East Asia
  • South Asia
  • Oceania
  • Middle East and Africa

Frequently Asked Questions

At what Rate will the Mussel Extract Market Grow?

The global mussel extract market is set to exceed US$ 71.30 Million in 2032.

Which Region is set to lead the Mussel Extract Market?

The USA is projected to lead the mussel extract market in the forecast period.

Which are some of the Renowned Companies in the Mussel Extract Market?

Waitaki Biosciences International Ltd., Maclab, Inc., Nature's Path Foods, Inc., Great HealthWorks Inc., and others are some of the renowned companies in the mussel extract market.

Table of Content

1. Global Market Executive Summary | Mussel Extract Market

    1.1. Global Market Overview

    1.2. Demand Side Trends

    1.3. Supply Side Trends

    1.4. Fact.MR Analysis and Recommendations

2. Global Market Overview

    2.1. Market Coverage / Taxonomy

    2.2. Market Introduction and Definition

3. Market Risks and Trends Assessment

    3.1. Risk Assessment

        3.1.1. COVID-19 Crisis and Impact on Mussel extracts

        3.1.2. COVID-19 Crisis and Impact on Aprotic Solvent Prices

        3.1.3. COVID-19 Impact Benchmark with Previous Crisis

            3.1.3.1. Change in Demand

            3.1.3.2. Before and After COVID-19 Crisis (Projected)

            3.1.3.3. Before and After Sub-prime Crisis – 2008 (Actual)

            3.1.3.4. Change in Demand post Recovery Period (After Each Crisis)

        3.1.4. Impact on Market and Value (US$ Million)

            3.1.4.1. Likely Loss of Value in 2020

            3.1.4.2. Mid-term and Long-Term Forecast

            3.1.4.3. Quarter-by-Quarter Demand and Recovery Assessment

        3.1.5. Anticipated Demand and Value Recovery Curve

            3.1.5.1. Likelihood of U-Shape Recovery

            3.1.5.2. Likelihood of L-Shape Recovery

        3.1.6. Recovery Period Assessment by Key Countries

        3.1.7. Recovery Assessment by Key Market Segments

        3.1.8. Action Points and Recommendations for Suppliers

        3.1.9. Impact on Trade Balance

    3.2. Key Trends Impacting the Market

    3.3. Formulation and End-User Development Trends

4. Market Background and foundation Data Points

    4.1. Need of the Hour for Industries

    4.2. Industry Wise Industry 4.0

    4.3. Strategic Priorities

    4.4. Life Cycle Stage

    4.5. Importance of Technology

    4.6. Use Cases of Mussel extracts

    4.7. Forecast Factors: Relevance and Impact

    4.8. Investment Feasibility Matrix

    4.9. PESTLE Analysis

    4.10. Porter’s Five Forces Analysis

    4.11. Market Dynamics

        4.11.1. Drivers

        4.11.2. Restraints

        4.11.3. Opportunity Analysis

        4.11.4. Trend

5. Global Market Demand (US$ Million) Analysis 2017 to 2021 and Forecast, 2022 to 2032

    5.1. Historical Market Value (US$ Million) Analysis, 2017 to 2021

    5.2. Current and Future Market Value (US$ Million) Projections, 2022 to 2032

        5.2.1. Y-o-Y Growth Trend Analysis

        5.2.2. Absolute $ Opportunity Analysis

6. Global Market Analysis 2017 to 2021 and Forecast 2022 to 2032, By End User

    6.1. Introduction / Key Findings

    6.2. Historical Market Value (US$ Million) Analysis By End User, 2017 to 2021

    6.3. Current and Future Market Value (US$ Million) Analysis and Forecast By End User, 2022 to 2032

        6.3.1. Dietary supplement

        6.3.2. Biopharmaceuticals

        6.3.3. Cosmetics and personal care

        6.3.4. Pet food

        6.3.5. Veterinary medicines

        6.3.6. Processed food

    6.4. Market Attractiveness Analysis By End User

7. Global Market Analysis 2017 to 2021 and Forecast 2022 to 2032, by Form

    7.1. Introduction / Key Findings

    7.2. Historical Market Value (US$ Million) Analysis By Form, 2017 to 2021

    7.3. Current and Future Market Value (US$ Million) Analysis and Forecast By Form, 2022 to 2032

        7.3.1. Liquid

        7.3.2. Powder

        7.3.3. Paste

    7.4. Market Attractiveness Analysis By Form

8. Global Market Analysis 2017 to 2021 and Forecast 2022 to 2032, by Distribution Channel

    8.1. Introduction / Key Findings

    8.2. Historical Market Value (US$ Million) Analysis By Distribution Channel, 2017 to 2021

    8.3. Current and Future Market Value (US$ Million) Analysis and Forecast By Distribution Channel, 2022 to 2032

        8.3.1. B2B

        8.3.2. B2C

        8.3.3. Modern Trade

        8.3.4. Convenience Store

        8.3.5. Specialty Store

        8.3.6. Departmental Store

        8.3.7. Others

    8.4. Market Attractiveness Analysis By Distribution Channel

9. Global Market Analysis 2017 to 2021 and Forecast 2022 to 2032, by Region

    9.1. Introduction / Key Findings

    9.2. Historical Market Value (US$ Million) Analysis By Region, 2017 to 2021

    9.3. Current and Future Market Value (US$ Million) Analysis and Forecast By Region, 2022 to 2032

        9.3.1. North America

        9.3.2. Latin America

        9.3.3. Europe

        9.3.4. East Asia

        9.3.5. South Asia & Oceania

        9.3.6. Middle East and Africa (MEA)

    9.4. Market Attractiveness Analysis By Region

10. North America Market Analysis 2017 to 2021 and Forecast 2022 to 2032

    10.1. Introduction / Key Findings

    10.2. Historical Market Value (US$ Million) Trend Analysis By Market Taxonomy, 2017 to 2021

    10.3. Market Value (US$ Million) Forecast By Market Taxonomy, 2022 to 2032

        10.3.1. By Country

            10.3.1.1. USA

            10.3.1.2. Canada

        10.3.2. By End User

        10.3.3. By Form

    10.4. Market Attractiveness Analysis

        10.4.1. By Country

        10.4.2. By End User

        10.4.3. By Form

11. Latin America Market Analysis 2017 to 2021 and Forecast 2022 to 2032

    11.1. Introduction / Key Findings

    11.2. Historical Market Size (US$ Million) Trend Analysis By Market Taxonomy, 2017 to 2021

    11.3. Current and Future Market Value (US$ Million) Analysis and Forecast By Region, 2022 to 2032

        11.3.1. By Country

            11.3.1.1. Brazil

            11.3.1.2. Mexico

            11.3.1.3. Rest of Latin America

        11.3.2. By End User

        11.3.3. By Form

        11.3.4. By Distribution Channel

    11.4. Market Attractiveness Analysis

        11.4.1. By Country

        11.4.2. By End User

        11.4.3. By Form

        11.4.4. By Distribution Channel

12. Europe Market Analysis 2017 to 2021 and Forecast 2022 to 2032

    12.1. Introduction / Key Findings

    12.2. Historical Market Size (US$ Million) Trend Analysis By Market Taxonomy, 2017 to 2021

    12.3. Current and Future Market Value (US$ Million) Analysis and Forecast By Region, 2022 to 2032

        12.3.1. By Country

            12.3.1.1. Germany

            12.3.1.2. France

            12.3.1.3. Italy

            12.3.1.4. Spain

            12.3.1.5. United Kingdom

            12.3.1.6. BENELUX

            12.3.1.7. Russia

            12.3.1.8. Rest of Europe

        12.3.2. By End User

        12.3.3. By Form

        12.3.4. By Distribution Channel

    12.4. Market Attractiveness Analysis

        12.4.1. By Country

        12.4.2. By End User

        12.4.3. By Form

        12.4.4. By Distribution Channel

13. East Asia Market Analysis 2017 to 2021 and Forecast 2022 to 2032

    13.1. Introduction / Key Findings

    13.2. Historical Market Size (US$ Million) Trend Analysis By Market Taxonomy, 2017 to 2021

    13.3. Current and Future Market Value (US$ Million) Analysis and Forecast By Region, 2022 to 2032

        13.3.1. By Country

            13.3.1.1. China

            13.3.1.2. Japan

            13.3.1.3. South Korea

        13.3.2. By End User

        13.3.3. By Form

        13.3.4. By Distribution Channel

    13.4. Market Attractiveness Analysis

        13.4.1. By Country

        13.4.2. By End User

        13.4.3. By Form

        13.4.4. By Distribution Channel

14. South Asia & Oceania Market Analysis 2017 to 2021 and Forecast 2022 to 2032

    14.1. Introduction / Key Findings

    14.2. Historical Market Size (US$ Million) Trend Analysis By Market Taxonomy, 2017 to 2021

    14.3. Current and Future Market Value (US$ Million) Analysis and Forecast By Region, 2022 to 2032

        14.3.1. By Country

            14.3.1.1. India

            14.3.1.2. Thailand

            14.3.1.3. Malaysia

            14.3.1.4. Singapore

            14.3.1.5. Vietnam

            14.3.1.6. Australia and New Zealand

            14.3.1.7. Rest of South Asia & Oceania

        14.3.2. By End User

        14.3.3. By Form

        14.3.4. By Distribution Channel

    14.4. Market Attractiveness Analysis

        14.4.1. By Country

        14.4.2. By End User

        14.4.3. By Form

        14.4.4. By Distribution Channel

15. Middle East and Africa Market Analysis 2017 to 2021 and Forecast 2022 to 2032

    15.1. Introduction / Key Findings

    15.2. Historical Market Size (US$ Million) Trend Analysis By Market Taxonomy, 2017 to 2021

    15.3. Current and Future Market Value (US$ Million) Analysis and Forecast By Region, 2022 to 2032

        15.3.1. By Country

            15.3.1.1. GCC Countries

            15.3.1.2. South Africa

            15.3.1.3. Israel

            15.3.1.4. Rest of Middle East and Africa (MEA)

        15.3.2. By End User

        15.3.3. By Form

        15.3.4. By Distribution Channel

    15.4. Market Attractiveness Analysis

        15.4.1. By Country

        15.4.2. By End User

        15.4.3. By Form

        15.4.4. By Distribution Channel

16. Market Structure Analysis

    16.1. Market Analysis by Tier of Companies

    16.2. Market Concentration

    16.3. Market Share Analysis of Top Players

    16.4. Market Presence Analysis

17. Competition Analysis

    17.1. Competition Dashboard

    17.2. Competition Benchmarking

    17.3. Competition Deep Dive

    17.4. Waitaki Biosciences International Ltd

        17.4.1. Company Overview

        17.4.2. End User overview

        17.4.3. SWOT Analysis

        17.4.4. Key Developments

    17.5. Maclab, Inc.

        17.5.1. Company Overview

        17.5.2. End User overview

        17.5.3. SWOT Analysis

        17.5.4. Key Developments

    17.6. Nature's Path Foods, Inc.

        17.6.1. Company Overview

        17.6.2. End User overview

        17.6.3. SWOT Analysis

        17.6.4. Key Developments

    17.7. Great HealthWorks Inc.

        17.7.1. Company Overview

        17.7.2. End User overview

        17.7.3. SWOT Analysis

        17.7.4. Key Developments

    17.8. Navchetana Kendra Agra.

        17.8.1. Company Overview

        17.8.2. End User overview

        17.8.3. SWOT Analysis

        17.8.4. Key Developments

18. Assumptions And Acronyms Used

19. Research Methodology

Don't pay for what you don't need

Customize your report by selecting specific countries or regions and save 30%!

List of Tables

Table 1: Global Market Value (US$ Million) Analysis, by End User, 2017 to 2021

Table 2: Global Market Value (US$ Million) Analysis, by End User, 2022 to 2032

Table 3: Global Market Value (US$ Million) Opportunity Analysis, by End User, 2022 to 2032

Table 4: Global Market Value (US$ Million) Analysis, by Form, 2017 to 2021

Table 5: Global Market Value (US$ Million) Analysis, by Form, 2022 to 2032

Table 6: Global Market Value (US$ Million) Opportunity Analysis, by Form, 2022 to 2032

Table 7: Global Market Value (US$ Million) Analysis, by Distribution Channel, 2017 to 2021

Table 8: Global Market Value (US$ Million) Analysis, by Distribution Channel, 2022 to 2032

Table 9: Global Market Value (US$ Million) Opportunity Analysis, by Distribution Channel, 2022 to 2032

Table 10: Global Market Value (US$ Million) Analysis, by Region, 2017 to 2021

Table 11: Global Market Value (US$ Million) Analysis, by Region, 2022 to 2032

Table 12: Global Market Value (US$ Million) Opportunity Analysis, by Region, 2022 to 2032

Table 13: North America Market Value (US$ Million) Analysis, by Country, 2017 to 2021

Table 14: North America Market Value (US$ Million) Analysis, by Country, 2022 to 2032

Table 15: North America Market Value (US$ Million) Opportunity Analysis, by Country, 2022 to 2032

Table 16: North America Market Value (US$ Million) Analysis, by End User, 2017 to 2021

Table 17: North America Market Value (US$ Million) Analysis, by End User, 2022 to 2032

Table 18: North America Market Value (US$ Million) Opportunity Analysis, by End User, 2022 to 2032

Table 19: North America Market Value (US$ Million) Analysis, by Form, 2017 to 2021

Table 20: North America Market Value (US$ Million) Analysis, by Form, 2022 to 2032

Table 21: North America Market Value (US$ Million) Opportunity Analysis, by Form, 2022 to 2032

Table 22: North America Market Value (US$ Million) Analysis, by Distribution Channel, 2017 to 2021

Table 23: North America Market Value (US$ Million) Analysis, by Distribution Channel, 2022 to 2032

Table 24: North America Market Value (US$ Million) Opportunity Analysis, by Distribution Channel, 2022 to 2032

Table 25: Latin America Market Value (US$ Million) Analysis, by Country, 2017 to 2021

Table 26: Latin America Market Value (US$ Million) Analysis, by Country, 2022 to 2032

Table 27: Latin America Market Value (US$ Million) Opportunity Analysis, by Country, 2022 to 2032

Table 28: Latin America Market Value (US$ Million) Analysis, by End User, 2017 to 2021

Table 29: Latin America Market Value (US$ Million) Analysis, by End User, 2022 to 2032

Table 30: Latin America Market Value (US$ Million) Opportunity Analysis, by End User, 2022 to 2032

Table 31: Latin America Market Value (US$ Million) Analysis, by Form, 2017 to 2021

Table 32: Latin America Market Value (US$ Million) Analysis, by Form, 2022 to 2032

Table 33: Latin America Market Value (US$ Million) Opportunity Analysis, by Form, 2022 to 2032

Table 34: Latin America Market Value (US$ Million) Analysis, by Distribution Channel, 2017 to 2021

Table 35: Latin America Market Value (US$ Million) Analysis, by Distribution Channel, 2022 to 2032

Table 36: Latin America Market Value (US$ Million) Opportunity Analysis, by Distribution Channel, 2022 to 2032

Table 37: Europe Market Value (US$ Million) Analysis, by Country, 2017 to 2021

Table 38: Europe Market Value (US$ Million) Analysis, by Country, 2022 to 2032

Table 39: Europe Market Value (US$ Million) Opportunity Analysis, by Country, 2022 to 2032

Table 40: Europe Market Value (US$ Million) Analysis, by End User, 2017 to 2021

Table 41: Europe Market Value (US$ Million) Analysis, by End User, 2022 to 2032

Table 42: Europe Market Value (US$ Million) Opportunity Analysis, by End User, 2022 to 2032

Table 43: Europe Market Value (US$ Million) Analysis, by Form, 2017 to 2021

Table 44: Europe Market Value (US$ Million) Analysis, by Form, 2022 to 2032

Table 45: Europe Market Value (US$ Million) Opportunity Analysis, by Form, 2022 to 2032

Table 46: Europe Market Value (US$ Million) Analysis, by Distribution Channel, 2017 to 2021

Table 47: Europe Market Value (US$ Million) Analysis, by Distribution Channel, 2022 to 2032

Table 48: Europe Market Value (US$ Million) Opportunity Analysis, by Distribution Channel, 2022 to 2032

Table 49: East Asia Market Value (US$ Million) Analysis, by Country, 2017 to 2021

Table 50: East Asia Market Value (US$ Million) Analysis, by Country, 2022 to 2032

Table 51: East Asia Market Value (US$ Million) Opportunity Analysis, by Country, 2022 to 2032

Table 52: East Asia Market Value (US$ Million) Analysis, by End User, 2017 to 2021

Table 53: East Asia Market Value (US$ Million) Analysis, by End User, 2022 to 2032

Table 54: East Asia Market Value (US$ Million) Opportunity Analysis, by End User, 2022 to 2032

Table 55: East Asia Market Value (US$ Million) Analysis, by Form, 2017 to 2021

Table 56: East Asia Market Value (US$ Million) Analysis, by Form, 2022 to 2032

Table 57: East Asia Market Value (US$ Million) Opportunity Analysis, by Form, 2022 to 2032

Table 58: East Asia Market Value (US$ Million) Analysis, by Distribution Channel, 2017 to 2021

Table 59: East Asia Market Value (US$ Million) Analysis, by Distribution Channel, 2022 to 2032

Table 60: East Asia Market Value (US$ Million) Opportunity Analysis, by Distribution Channel, 2022 to 2032

Table 61: South Asia & Oceania Market Value (US$ Million) Analysis, by Country, 2017 to 2021

Table 62: South Asia & Oceania Market Value (US$ Million) Analysis, by Country, 2022 to 2032

Table 63: South Asia & Oceania Market Value (US$ Million) Opportunity Analysis, by Country, 2022 to 2032

Table 64: South Asia & Oceania Market Value (US$ Million) Analysis, by End User, 2017 to 2021

Table 65: South Asia & Oceania Market Value (US$ Million) Analysis, by End User, 2022 to 2032

Table 66: South Asia & Oceania Market Value (US$ Million) Opportunity Analysis, by End User, 2022 to 2032

Table 67: South Asia & Oceania Market Value (US$ Million) Analysis, by Form, 2017 to 2021

Table 68: South Asia & Oceania Market Value (US$ Million) Analysis, by Form, 2022 to 2032

Table 69: South Asia & Oceania Market Value (US$ Million) Opportunity Analysis, by Form, 2022 to 2032

Table 70: South Asia & Oceania Market Value (US$ Million) Analysis, by Distribution Channel, 2017 to 2021

Table 71: South Asia & Oceania Market Value (US$ Million) Analysis, by Distribution Channel, 2022 to 2032

Table 72: South Asia & Oceania Market Value (US$ Million) Opportunity Analysis, by Distribution Channel, 2022 to 2032

Table 73: MEA Market Value (US$ Million) Analysis, by Country, 2017 to 2021

Table 74: MEA Market Value (US$ Million) Analysis, by Country, 2022 to 2032

Table 75: MEA Market Value (US$ Million) Opportunity Analysis, by Country, 2022 to 2032

Table 76: MEA Market Value (US$ Million) Analysis, by End User, 2017 to 2021

Table 77: MEA Market Value (US$ Million) Analysis, by End User, 2022 to 2032

Table 78: MEA Market Value (US$ Million) Opportunity Analysis, by End User, 2022 to 2032

Table 79: MEA Market Value (US$ Million) Analysis, by Form, 2017 to 2021

Table 80: MEA Market Value (US$ Million) Analysis, by Form, 2022 to 2032

Table 81: MEA Market Value (US$ Million) Opportunity Analysis, by Form, 2022 to 2032

Table 82: MEA Market Value (US$ Million) Analysis, by Distribution Channel, 2017 to 2021

Table 83: MEA Market Value (US$ Million) Analysis, by Distribution Channel, 2022 to 2032

Table 84: MEA Market Value (US$ Million) Opportunity Analysis, by Distribution Channel, 2022 to 2032
Nandini Roy Choudhury

Principal Consultant

Talk to Analyst

Find your sweet spots for generating winning opportunities in this market.

List of Charts

Figure 1: Global Market Value (US$ Million) Historical Analysis, 2017 to 2021

Figure 2: Global Market Value (US$ Million) Forecast and Analysis, 2022 to 2032

Figure 3: Global Market Value Y-o-Y Growth and Forecast, 2017 to 2032

Figure 4: Global Market Incremental $ Opportunity, 2022 to 2032

Figure 5: Global Market Share and BPS Analysis by End User, 2022 & 2032

Figure 6: Global Market Y-o-Y Growth Projections by End User, 2022 to 2032

Figure 7: Global Market Attractiveness Analysis by End User, 2022 to 2032

Figure 8: Global Market Share and BPS Analysis by Form, 2022 & 2032

Figure 9: Global Market Y-o-Y Growth Projections by Form, 2022 to 2032

Figure 10: Global Market Attractiveness Analysis by Form, 2022 to 2032

Figure 11: Global Market Share and BPS Analysis by Distribution Channel, 2022 & 2032

Figure 12: Global Market Y-o-Y Growth Projections by Distribution Channel, 2022 to 2032

Figure 13: Global Market Attractiveness Analysis by Distribution Channel, 2022 to 2032

Figure 14: Global Market Share and BPS Analysis by Region, 2022 & 2032

Figure 15: Global Market Y-o-Y Growth Projections by Region, 2022 to 2032

Figure 16: Global Market Attractiveness Analysis by Region, 2022 to 2032

Figure 17: North America Market Value (US$ Million) Historical Analysis, 2017 to 2021

Figure 18: North America Market Value (US$ Million) Forecast and Analysis, 2022 to 2032

Figure 19: North America Market Value Y-o-Y Growth and Forecast, 2032

Figure 20: North America Market Incremental $ Opportunity, 2022 to 2032

Figure 21: North America Market Share Analysis by Country, 2022 & 2032

Figure 22: North America Market Y-o-Y Growth Projection by Country, 2022 to 2032

Figure 23: North America Market Attractiveness Analysis by Country, 2022 to 2032

Figure 24: North America Market Share and BPS Analysis by End User, 2022 & 2032

Figure 25: North America Market Y-o-Y Growth Projections by End User, 2022 to 2032

Figure 26: North America Market Attractiveness Analysis by End User, 2022 to 2032

Figure 27: North America Market Share and BPS Analysis by Form, 2022 & 2032

Figure 28: North America Market Y-o-Y Growth Projections by Form, 2022 to 2032

Figure 29: North America Market Attractiveness Analysis by Form, 2022 to 2032

Figure 30: North America Market Share and BPS Analysis by Distribution Channel, 2022 & 2032

Figure 31: North America Market Y-o-Y Growth Projections by Distribution Channel, 2022 to 2032

Figure 32: North America Market Attractiveness Analysis by Distribution Channel, 2022 to 2032

Figure 33: Latin America Market Value (US$ Million) Historical Analysis, 2017 to 2021

Figure 34: Latin America Market Value (US$ Million) Forecast and Analysis, 2022 to 2032

Figure 35: Latin America Market Value Y-o-Y Growth and Forecast, 2017 to 2032

Figure 36: Latin America Market Incremental $ Opportunity, 2022 to 2032

Figure 37: Latin America Market Share Analysis by Country, 2022 & 2032

Figure 38: Latin America Market Y-o-Y Growth Projection by Country, 2022 to 2032

Figure 39: Latin America Market Attractiveness Analysis by Country, 2022 to 2032

Figure 40: Latin America Market Share and BPS Analysis by End User, 2022 & 2032

Figure 41: Latin America Market Y-o-Y Growth Projections by End User, 2022 to 2032

Figure 42: Latin America Market Attractiveness Analysis by End User, 2022 to 2032

Figure 43: Latin America Market Share and BPS Analysis by Form, 2022 & 2032

Figure 44: Latin America Market Y-o-Y Growth Projections by Form, 2022 to 2032

Figure 45: Latin America Market Attractiveness Analysis by Form, 2022 to 2032

Figure 46: Latin America Market Share and BPS Analysis by Distribution Channel, 2022 & 2032

Figure 47: Latin America Market Y-o-Y Growth Projections by Distribution Channel, 2022 to 2032

Figure 48: Latin America Market Attractiveness Analysis by Distribution Channel, 2022 to 2032

Figure 49: Europe Market Value (US$ Million) Historical Analysis, 2017 to 2021

Figure 50: Europe Market Value (US$ Million) Forecast and Analysis, 2022 to 2032

Figure 51: Europe Market Value Y-o-Y Growth and Forecast, 2017 to 2032

Figure 52: Europe Market Incremental $ Opportunity, 2022 to 2032

Figure 53: Europe Market Share Analysis by Country, 2022 & 2032

Figure 54: Europe Market Y-o-Y Growth Projection by Country, 2022 to 2032

Figure 55: Europe Market Attractiveness Analysis by Country, 2022 to 2032

Figure 56: Europe Market Share and BPS Analysis by End User, 2022 & 2032

Figure 57: Europe Market Y-o-Y Growth Projections by End User, 2022 to 2032

Figure 58: Europe Market Attractiveness Analysis by End User, 2022 to 2032

Figure 59: Europe Market Share and BPS Analysis by Form, 2022 & 2032

Figure 60: Europe Market Y-o-Y Growth Projections by Form, 2022 to 2032

Figure 61: Europe Market Attractiveness Analysis by Form, 2022 to 2032

Figure 62: Europe Market Share and BPS Analysis by Distribution Channel, 2022 & 2032

Figure 63: Europe Market Y-o-Y Growth Projections by Distribution Channel, 2022 to 2032

Figure 64: Europe Market Attractiveness Analysis by Distribution Channel, 2022 to 2032

Figure 65: East Asia Market Value (US$ Million) Historical Analysis, 2017 to 2021

Figure 66: East Asia Market Value (US$ Million) Forecast and Analysis, 2022 to 2032

Figure 67: East Asia Market Value Y-o-Y Growth and Forecast, 2017 to 2032

Figure 68: East Asia Market Incremental $ Opportunity, 2022 to 2032

Figure 69: East Asia Market Share Analysis by Country, 2022 & 2032

Figure 70: East Asia Market Y-o-Y Growth Projection by Country, 2022 to 2032

Figure 71: East Asia Market Attractiveness Analysis by Country, 2022 to 2032

Figure 72: East Asia Market Share and BPS Analysis by End User, 2022 & 2032

Figure 73: East Asia Market Y-o-Y Growth Projections by End User, 2022 to 2032

Figure 74: East Asia Market Attractiveness Analysis by End User, 2022 to 2032

Figure 75: East Asia Market Share and BPS Analysis by Form, 2022 & 2032

Figure 76: East Asia Market Y-o-Y Growth Projections by Form, 2022 to 2032

Figure 77: East Asia Market Attractiveness Analysis by Form, 2022 to 2032

Figure 78: East Asia Market Share and BPS Analysis by Distribution Channel, 2022 & 2032

Figure 79: East Asia Market Y-o-Y Growth Projections by Distribution Channel, 2022 to 2032

Figure 80: East Asia Market Attractiveness Analysis by Distribution Channel, 2022 to 2032

Figure 81: South Asia & Oceania Market Value (US$ Million) Historical Analysis, 2017 to 2021

Figure 82: South Asia & Oceania Market Value (US$ Million) Forecast and Analysis, 2022 to 2032

Figure 83: South Asia & Oceania Market Value Y-o-Y Growth and Forecast, 2017 to 2032

Figure 84: South Asia & Oceania Mussel extract Market Incremental $ Opportunity, 2022 to 2032

Figure 85: South Asia & Oceania Mussel extract Market Share Analysis by Country, 2022 & 2032

Figure 86: South Asia & Oceania Mussel extract Market Y-o-Y Growth Projection by Country, 2022 to 2032

Figure 87: South Asia & Oceania Market Attractiveness Analysis by Country, 2022 to 2032

Figure 88: South Asia & Oceania Mussel extract Market Share and BPS Analysis by End User, 2022 & 2032

Figure 89: South Asia & Oceania Mussel extract Market Y-o-Y Growth Projections by End User, 2022 to 2032

Figure 90: South Asia & Oceania Market Attractiveness Analysis by End User, 2022 to 2032

Figure 91: South Asia & Oceania Mussel extract Market Share and BPS Analysis by Form, 2022 & 2032

Figure 92: South Asia & Oceania Mussel extract Market Y-o-Y Growth Projections by Form, 2022 to 2032

Figure 93: South Asia & Oceania Market Attractiveness Analysis by Form, 2022 to 2032

Figure 94: South Asia & Oceania Mussel extract Market Share and BPS Analysis by Distribution Channel, 2022 & 2032

Figure 95: South Asia & Oceania Mussel extract Market Y-o-Y Growth Projections by Distribution Channel, 2022 to 2032

Figure 96: South Asia & Oceania Market Attractiveness Analysis by Distribution Channel, 2022 to 2032

Figure 97: MEA Market Value (US$ Million) Historical Analysis, 2017 to 2021

Figure 98: MEA Market Value (US$ Million) Forecast and Analysis, 2022 to 2032

Figure 99: MEA Market Value Y-o-Y Growth and Forecast, 2017 to 2032

Figure 100: MEA Market Incremental $ Opportunity, 2022 to 2032

Figure 101: MEA Market Share Analysis by Country, 2022 & 2032

Figure 102: MEA Market Y-o-Y Growth Projection by Country, 2022 to 2032

Figure 103: MEA Market Attractiveness Analysis by Country, 2022 to 2032

Figure 104: MEA Market Share and BPS Analysis by End User, 2022 & 2032

Figure 105: MEA Market Y-o-Y Growth Projections by End User, 2022 to 2032

Figure 106: MEA Market Attractiveness Analysis by End User, 2022 to 2032

Figure 107: MEA Market Share and BPS Analysis by Form, 2022 & 2032

Figure 108: MEA Market Y-o-Y Growth Projections by Form, 2022 to 2032

Figure 109: MEA Market Attractiveness Analysis by Form, 2022 to 2032

Figure 110: MEA Market Share and BPS Analysis by Distribution Channel, 2022 & 2032

Figure 111: MEA Market Y-o-Y Growth Projections by Distribution Channel, 2022 to 2032

Figure 112: MEA Market Attractiveness Analysis by Distribution Channel, 2022 to 2032

Recommendations

Food and Beverage

Mussel Market

Published : March 2024

Food and Beverage

Mussel Oils Market

Published : June 2022

Explore Food and Beverage Insights

View Reports