Reports

- Global Locations -

Headquarters

Future Market Insights, Inc.

Christiana Corporate, 200
Continental Drive, Suite 401,
Newark, Delaware - 19713,
United States

T: +1-845-579-5705

Americas

Future Market Insights, Inc.

616 Corporate Way, Suite 2-9018,
Valley Cottage, NY 10989, United States

T: +1-347-918-3531

MEA

Future Market Insights

1602-6 Jumeirah Bay X2 Tower, Plot No: JLT-PH2-X2A,
Jumeirah Lakes Towers, Dubai,
United Arab Emirates

Europe

Future Market Insights

3rd Floor, 207 Regent Street,
W1B 3HH London
United Kingdom

T: + 44 (0) 20 8123 9659
D: +44 (0) 20 3287 4268

Asia Pacific

Future Market Insights

IndiaLand Global Tech Park, Unit UG-1, Behind Grand HighStreet, Phase 1, Hinjawadi, MH, Pune – 411057, India

Mustard Seed Outlook (2022-2032)

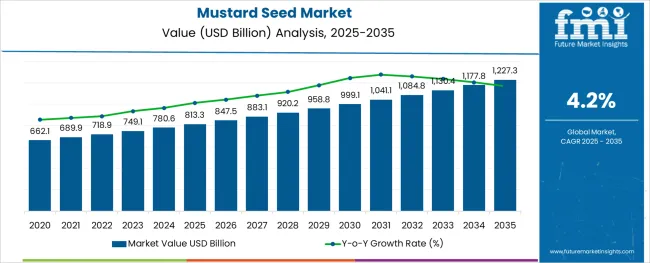
[342 Pages Report] Global mustard seed market worth is expected to rise at a CAGR of 4.2% to US$ 1 Billion by 2032, supported by:

  • The growing trend and consumption of convenient and fast food items create a huge demand for mustard condiments and sauce.
  • The economic slowdown and reduction of agricultural productivity in some particular and traditional mustard seed-producing countries.
  • Innovations in better storage procedures and tools and their adoption by prominent market players have increased the shelf-life of the product significantly.

There is a large & enough supply of mustard produced in India to meet particularly the need of Europe, followed by the mustard oil market in Asian countries. The mustard crop is anticipated to generate nearly 28,000 MT in the financial year 2022-23. But almost 90% of the crop gets consumed in the nation itself to manufacture oil while allowing only the remaining 10% of the crop to export.

Furthermore, according to the IOPEPC mustard seed market report released in the recent past, the output of Indian Mustard Seeds decreased by almost 4-6% during the years prior to the Covid-19 pandemic. However, this was also accompanied by a drop in the product's demand globally in the following years. Fortunately, this downturn of events has resulted in the growth of the mustard seed market in several non-traditional regions of the world for its production and export.

The primary application of Indian mustard is for the production of oil due to its slightly bitter flavor, and it is not utilized to produce sauces or mustard pastes which provides some lucrative opportunities for the mustard seed market players in other countries. The mustard seed analysis report by FMI anticipates that the new mustard seed market would crop up in the forecast years to meet the demand on a global scale, given the growing trend of mustard sauce and flavours.

Report Attribute Details
Mustard Seed Market Valuation as on 2022 US$ 718.9 million
Mustard Seed Market Anticipated Forecast Value (2032) US$ 1084.8 million
Mustard Seed Market Projected Growth Rate (2022-2032) 4.2%

Don't pay for what you don't need

Customize your report by selecting specific countries or regions and save 30%!

What are Major Strategies adopted by New and Existing Mustard Seed Market Players?

With the presence of a number of significant competitors, the global mustard seed market is progressively turning out diversified, which was previously fairly consolidated. Moreover, the prominent players are concentrating on expanding their commercial operations in developing nations. At the same time, most of the new mustard seed companies in the global market are preparing plans for new product development and product portfolio growth through investments and innovations.

The mustard seed market key players frequently conduct analysis of the requirement for mustard on a worldwide scale and take steps appropriately to enhance the quality of seeds produced so that they can retain their existing market demand and improve the brand value. In such a competitive market, new participants need to focus their efforts on popularizing the product and supplying it to untapped markets.

Many entrepreneurs have surfaced to make a profit out of the increasing mustard seed market opportunities in the aftermath of the pandemic food shortage and restrictions on trading agricultural items. On the other hand, over the course of this projection period, the higher expenses related to the installation and maintenance of mustard processing equipment can be a factor that might prolong the gestation period of the start-ups entering into the global mustard seed business.

Another major reason for such a higher rate of prediction for the mustard seed market growth during the forecast period is the continuous investment and innovations by food processing companies to provide better preservation solutions for all kinds of agricultural commodities.

Being a source of a lot of healthy nutrients, being great source of sterols, and for many other reasons, the demand for mustard seeds is expected to increase in the future.

Popularity of mustard seed is growing as it is nearly 40 different mustard plant species are found. In addition to this, mustard seed are available in diversified forms--black, brown and white mustard seeds, which is likely to boost the demand for mustard seeds.

Another key factor that upkeep the growth momentum of mustard seed market is its multipurpose usage as an edible plant. Almost every part of mustard plant is edible, be it seeds, leaves or flowers.

Mustard seeds being full of rich nutrients and their leaves being rich in Vitamin A, Vitamin C, and Vitamin K. These are also rich in fibre, selenium, magnesium, and manganese, which is likely to keep the popularity quo high.

Several studies have found that mustard seeds are also effective in preventing cancer. The mustard seeds also exhibit anti-inflammatory and anti-bacterial properties.

The mustard seeds are also a rich source of isothiocyanates and phenol compounds, because of which they are extremely beneficial for the body.

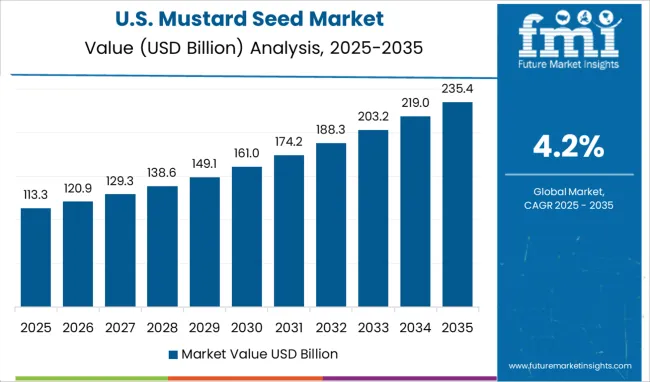
Previously, the CAGR for the mustard seed market was 3.6%. But with the increasing applications of the mustard seed, the anticipated CAGR for the forecast period, which stands at 4.2% highlights the fact that there is an increase in the consumption of mustard seeds and this is only expected to increase further.

What are the Current Market Dynamics pertaining to Mustard Seed Market?

Owing to a number of health benefits offered by mustard seeds, the oils made up of mustard seeds are being used in cooking instead of various other kinds of oil like sunflower oil, sesame oil etc. This is expected to increase the demand for mustard seeds.

Mustard seeds are rich source of various kinds of Vitamin B like niacin, thiamine, riboflavin etc., which are crucial for the effective functioning of Nervous System, and for maintaining a healthy metabolism as well. These benefits offered are expected to increase the demand for mustard seeds.

Mustard seeds are effective for arthritis treatment as well. Being a rich source of Omega 3 fatty acids, selenium, and magnesium, the oils made from mustard seeds are effective in treating arthritis. This is expected to increase the sales of mustard seeds.

As a method of precaution, health specialists advice people to consume mustard seeds on a regular basis. Muster seeds are rich in myrosinase and glucosinolates, which prevent the growth of cancer cells. This is anticipated t further increase the sales of mustard seeds.

Apart from high magnesium and selenium, mustard seeds are also a source of Vitamin A, Vitamin B, beta-carotene and omega 3 fatty acids. These nutrients are effective for handling asthama. This particular application is expected to increase the sales of mustard seeds.

Mustard seeds are also useful for maintaining a sound cardiovascular health. It is effective for maintaining a sound cardiovascular health, and is specifically known for reducing the bad cholesterol levels in the blood. This is expected to increase the adoption of mustard seeds.

Mustard seeds are also consumed for maintaining a strong bone health and strong teeth as well. The presence of selenium in mustard seeds ensures that the bones and teeth remain. The presence of selenium also ensures healthy nails and hair.

This is expected to increase the mustard seed market share.

The anti-inflammatory properties of mustard seeds also prevent the growth of acne. They are effective in hydrating our skin and removing the impurities from our skin. Because of this, the mustard seed market share is anticipated to increase in the coming times.

Additionally, because of the presence of Vitamin A, Vitamin C and Vitamin K, the mustard seeds slow down the ageing process of a person. Even this is anticipated to increase the market for mustard seeds.

It is important to note that there should be a regulated consumption of mustard seeds. Consuming them beyond certain limit may lead to diarrhoea, and gut inflammation.

Moreover, uncooked mustard seeds contain goitrogens. These interfere with the smooth functioning of thyroid glands, which are useful for the smooth metabolism process, which might lead to thyroid related problems. So, it is advisable to consult a health specialist before consuming mustard seeds.
Nandini Roy Choudhury

Principal Consultant

Talk to Analyst

Find your sweet spots for generating winning opportunities in this market.

Regional Analysis

  • How is the Performance of North American Mustard Seed Market?

North America, which currently has a market share of 24.6% is expected to show a decent growth during the forecast period.

People in North America are well informed about leading a healthy lifestyle, and are taking proactive steps as well to lead such a lifestyle. Consequently, lot of people has replaced other forms of edible oil with mustard oil. Moreover, people in this region are aware also aware of the importance of a healthy cardiovascular health. This is also seen as a major factor for the anticipated increase in the market share of mustard seeds during the forecast period.
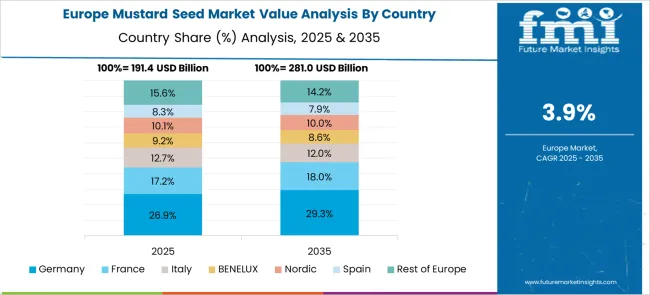
  • How is the Performance of European Mustard Seed Market?

Europe, which currently has a market share of 29.7%, is expected to show a good growth rate during the forecast period.

Apart from the health benefits offered by mustard seeds, people in this region are aware of other benefits of these seeds as well. As mustard oil is highly beneficial for a glowing skin, people in this region make use of mustard oil for skin as well, apart from consumption.

Moreover, people in Europe as well are health conscious, because of which the market size of mustard seed is expected to increase in the region.

Startup Ecosystem

How is the Start Up Ecosystem in the Mustard Seed Market?

The mustard seeds are important for a strong body. Having so much to offer, the start up ecosystem in the mustard seed market is seeing a lot happening.

SunImpex, a Dubai based agro products start up, which was launched in 2013, was exhibiting in GULF FOOD 2020. GULF FOOD is a great platform for food producing companies to discover new trends and discover new trends. The product lines in SunImpex had been multiplying, and taking this reason into consideration, SunImpex decided to participate in the exhibition.
Get the data you need at a Fraction of the cost

Personalize your report by choosing insights you need
and save 40%!

Who are Some of the Key Market Players in the Mustard Seed Market?

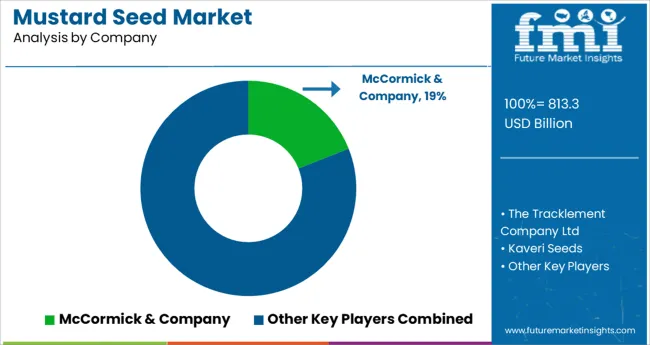
Some of the key market players in the mustard seed market are: McCormick & Company, Inc., Sakai Spice (Canada) Corp, Megha Corporation, Organic Products India, Sun Impex., The Tracklement Company Ltd, Kaveri Seeds.

With the Russia-Ukraine war taking place, farmers across the world fear that the prices of mustard seeds might increase in the future, which might also affect the demand of the mustard seed market.

  • In May 2022, McCormick & Company was recognised on DiversityInc’s Top 50 list of companies for the sixth consecutive year, and was placed in the 50th rank.
  • Organic Products India is all set to participate in the BIOFACH International Organic Food Fair in July 2022, which will be held in Germany.

Report Scope

Report Attribute Details
Growth Rate CAGR of 4.2% from 2022 to 2032
Base Year for Estimation 2021
Historical Data 2014-2020
Forecast Period 2022-2032
Quantitative Units Revenue in USD Million and CAGR from 2022-2032
Report Coverage Revenue Forecast, Volume Forecast, Company Ranking, Competitive Landscape, Growth Factors, Trends and Pricing Analysis
Segments Covered
  • Type
  • Application
  • Sales Channel
  • Region
Regions Covered
  • North America
  • Latin America
  • Europe
  • East Asia
  • South Asia
  • Oceania
  • Middle East and Africa
Key Countries Profiled
  • USA
  • Canada
  • Brazil
  • Argentina
  • Germany
  • UK
  • France
  • Spain
  • Italy
  • Nordics
  • BENELUX
  • Australia & New Zealand
  • China
  • India
  • ASEAN
  • GCC
  • South Africa
Key Companies Profiled
  • McCormick & Company, Inc.
  • Sakai Spice (Canada) Corp
  • Megha Corporation
  • Organic Products India
  • Sun Impex.
  • The Tracklement Company Ltd
  • Kaveri Seeds.
Customization Available Upon Request

Key Segments Profiled in the Mustard Seed Market Survey

By Type:

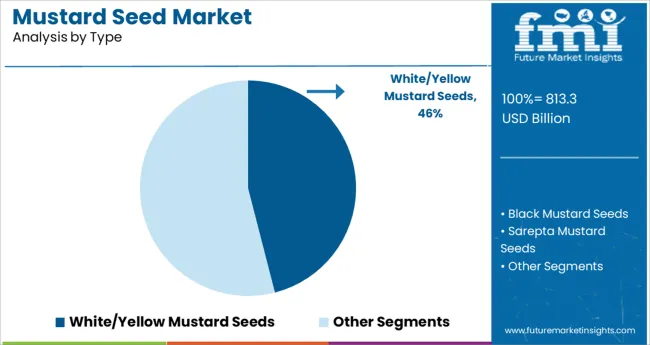
  • White/Yellow Mustard Seeds
  • Black Mustard Seeds
  • Sarepta Mustard Seeds

By Application:

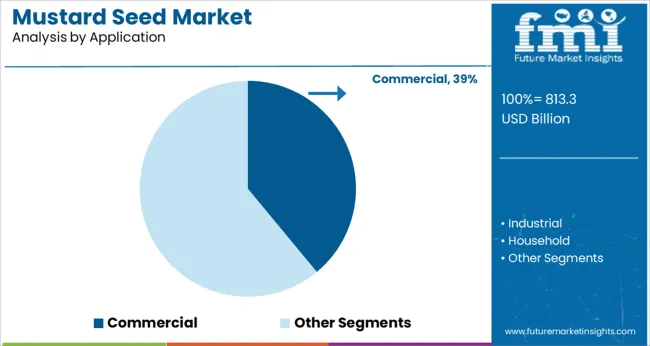
  • Commercial
  • Industrial
  • Household

By Sales Channel:

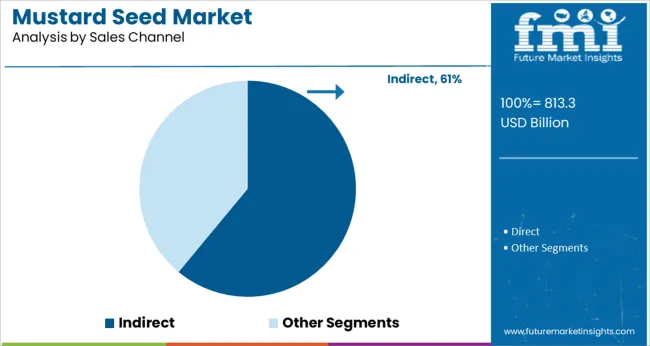
  • Direct
  • Indirect

By Region:

  • North America
  • Latin America
  • Europe
  • East Asia
  • South Asia
  • Oceania
  • Middle East and Africa

Frequently Asked Questions

What is the Growth Outlook for the Mustard Seed Market?

The mustard seed market is projected to grow at a CAGR of 4.2% during the forecast period (2022-2032).

What is the Valuation of Mustard Seed Market as on 2022?

The mustard seed market has a valuation of US$ 718.9 million as on 2022.

What is the Expected Valuation of Mustard Seed Market in 2032?

The mustard seed market is expected to be valued US$ 1084.8 million in 2032.

Table of Content

1. Executive Summary

    1.1. Global Market Outlook

    1.2. Demand-side Trends

    1.3. Supply-side Trends

    1.4. Technology Roadmap Analysis

    1.5. Analysis and Recommendations

2. Market Overview

    2.1. Market Coverage / Taxonomy

    2.2. Market Definition / Scope / Limitations

3. Market Background

    3.1. Market Dynamics

        3.1.1. Drivers

        3.1.2. Restraints

        3.1.3. Opportunity

        3.1.4. Trends

    3.2. Scenario Forecast

        3.2.1. Demand in Optimistic Scenario

        3.2.2. Demand in Likely Scenario

        3.2.3. Demand in Conservative Scenario

    3.3. Opportunity Map Analysis

    3.4. Product Life Cycle Analysis

    3.5. Supply Chain Analysis

        3.5.1. Supply Side Participants and their Roles

            3.5.1.1. Producers

            3.5.1.2. Mid-Level Participants (Traders/ Agents/ Brokers)

            3.5.1.3. Wholesalers and Distributors

        3.5.2. Value Added and Value Created at Node in the Supply Chain

        3.5.3. List of Raw Material Suppliers

        3.5.4. List of Existing and Potential Buyer’s

    3.6. Investment Feasibility Matrix

    3.7. Value Chain Analysis

        3.7.1. Profit Margin Analysis

        3.7.2. Wholesalers and Distributors

        3.7.3. Retailers

    3.8. PESTLE and Porter’s Analysis

    3.9. Regulatory Landscape

        3.9.1. By Key Regions

        3.9.2. By Key Countries

    3.10. Regional Parent Market Outlook

    3.11. Production and Consumption Statistics

    3.12. Import and Export Statistics

4. Global Market Analysis 2017-2021 and Forecast, 2022-2032

    4.1. Historical Market Size Value (US$ Mn) & Volume (Tons) Analysis, 2017-2021

    4.2. Current and Future Market Size Value (US$ Mn) & Volume (Tons) Projections, 2022-2032

        4.2.1. Y-o-Y Growth Trend Analysis

        4.2.2. Absolute $ Opportunity Analysis

5. Global Market Analysis 2017-2021 and Forecast 2022-2032, By Product Type

    5.1. Introduction / Key Findings

    5.2. Historical Market Size Value (US$ Mn) & Volume (Tons) Analysis By Product Type, 2017-2021

    5.3. Current and Future Market Size Value (US$ Mn) & Volume (Tons) Analysis and Forecast By Product Type, 2022-2032

        5.3.1. White/Yellow Mustard Seeds

        5.3.2. Black Mustard Seeds

        5.3.3. Sarepta Mustard Seeds

            5.3.3.1. Brown Mustard Seeds

            5.3.3.2. Oriental Mustard Seeds

    5.4. Y-o-Y Growth Trend Analysis By Product Type, 2017-2021

    5.5. Absolute $ Opportunity Analysis By Product Type, 2022-2032

6. Global Market Analysis 2017-2021 and Forecast 2022-2032, By Application

    6.1. Introduction / Key Findings

    6.2. Historical Market Size Value (US$ Mn) & Volume (Tons) Analysis By Application, 2017-2021

    6.3. Current and Future Market Size Value (US$ Mn) & Volume (Tons) Analysis and Forecast By Application, 2022-2032

        6.3.1. Industrial Application

        6.3.2. Commercial Application

        6.3.3. Household

    6.4. Y-o-Y Growth Trend Analysis By Application, 2017-2021

    6.5. Absolute $ Opportunity Analysis By Application, 2022-2032

7. Global Market Analysis 2017-2021 and Forecast 2022-2032, By Sales Channel

    7.1. Introduction / Key Findings

    7.2. Historical Market Size Value (US$ Mn) & Volume (Tons) Analysis By Sales Channel, 2017-2021

    7.3. Current and Future Market Size Value (US$ Mn) & Volume (Tons) Analysis and Forecast By Sales Channel, 2022-2032

        7.3.1. Direct

        7.3.2. Indirect

            7.3.2.1. Hypermarkets/Supermarkets

            7.3.2.2. Convenience Stores

            7.3.2.3. Specialty Store

            7.3.2.4. E-commerce

            7.3.2.5. Other Retail Formats

    7.4. Y-o-Y Growth Trend Analysis By Sales Channel, 2017-2021

    7.5. Absolute $ Opportunity Analysis By Sales Channel, 2022-2032

8. Global Market Analysis 2017-2021 and Forecast 2022-2032, By Region

    8.1. Introduction

    8.2. Historical Market Size Value (US$ Mn) & Volume (Tons) Analysis By Region, 2017-2021

    8.3. Current Market Size Value (US$ Mn) & Volume (Tons) Analysis and Forecast By Region, 2022-2032

        8.3.1. North America

        8.3.2. Latin America

        8.3.3. Europe

        8.3.4. Asia Pacific

        8.3.5. MEA

    8.4. Market Attractiveness Analysis By Region

9. North America Market Analysis 2017-2021 and Forecast 2022-2032, By Country

    9.1. Historical Market Size Value (US$ Mn) & Volume (Tons) Trend Analysis By Market Taxonomy, 2017-2021

    9.2. Market Size Value (US$ Mn) & Volume (Tons) Forecast By Market Taxonomy, 2022-2032

        9.2.1. By Country

            9.2.1.1. U.S.

            9.2.1.2. Canada

        9.2.2. By Product Type

        9.2.3. By Application

        9.2.4. By Sales Channel

    9.3. Market Attractiveness Analysis

        9.3.1. By Country

        9.3.2. By Product Type

        9.3.3. By Application

        9.3.4. By Sales Channel

    9.4. Key Takeaways

10. Latin America Market Analysis 2017-2021 and Forecast 2022-2032, By Country

    10.1. Historical Market Size Value (US$ Mn) & Volume (Tons) Trend Analysis By Market Taxonomy, 2017-2021

    10.2. Market Size Value (US$ Mn) & Volume (Tons) Forecast By Market Taxonomy, 2022-2032

        10.2.1. By Country

            10.2.1.1. Brazil

            10.2.1.2. Mexico

            10.2.1.3. Rest of Latin America

        10.2.2. By Product Type

        10.2.3. By Application

        10.2.4. By Sales Channel

    10.3. Market Attractiveness Analysis

        10.3.1. By Country

        10.3.2. By Product Type

        10.3.3. By Application

        10.3.4. By Sales Channel

    10.4. Key Takeaways

11. Europe Market Analysis 2017-2021 and Forecast 2022-2032, By Country

    11.1. Historical Market Size Value (US$ Mn) & Volume (Tons) Trend Analysis By Market Taxonomy, 2017-2021

    11.2. Market Size Value (US$ Mn) & Volume (Tons) Forecast By Market Taxonomy, 2022-2032

        11.2.1. By Country

            11.2.1.1. Germany

            11.2.1.2. U.K.

            11.2.1.3. France

            11.2.1.4. Spain

            11.2.1.5. Italy

            11.2.1.6. Rest of Europe

        11.2.2. By Product Type

        11.2.3. By Application

        11.2.4. By Sales Channel

    11.3. Market Attractiveness Analysis

        11.3.1. By Country

        11.3.2. By Product Type

        11.3.3. By Application

        11.3.4. By Sales Channel

    11.4. Key Takeaways

12. Asia Pacific Market Analysis 2017-2021 and Forecast 2022-2032, By Country

    12.1. Historical Market Size Value (US$ Mn) & Volume (Tons) Trend Analysis By Market Taxonomy, 2017-2021

    12.2. Market Size Value (US$ Mn) & Volume (Tons) Forecast By Market Taxonomy, 2022-2032

        12.2.1. By Country

            12.2.1.1. China

            12.2.1.2. Japan

            12.2.1.3. South Korea

            12.2.1.4. Malaysia

            12.2.1.5. Singapore

            12.2.1.6. Australia

            12.2.1.7. New Zealand

            12.2.1.8. Rest of APAC

        12.2.2. By Product Type

        12.2.3. By Application

        12.2.4. By Sales Channel

    12.3. Market Attractiveness Analysis

        12.3.1. By Country

        12.3.2. By Product Type

        12.3.3. By Application

        12.3.4. By Sales Channel

    12.4. Key Takeaways

13. MEA Market Analysis 2017-2021 and Forecast 2022-2032, By Country

    13.1. Historical Market Size Value (US$ Mn) & Volume (Tons) Trend Analysis By Market Taxonomy, 2017-2021

    13.2. Market Size Value (US$ Mn) & Volume (Tons) Forecast By Market Taxonomy, 2022-2032

        13.2.1. By Country

            13.2.1.1. GCC Countries

            13.2.1.2. South Africa

            13.2.1.3. Israel

            13.2.1.4. Rest of MEA

        13.2.2. By Product Type

        13.2.3. By Application

        13.2.4. By Sales Channel

    13.3. Market Attractiveness Analysis

        13.3.1. By Country

        13.3.2. By Product Type

        13.3.3. By Application

        13.3.4. By Sales Channel

    13.4. Key Takeaways

14. Key Countries Market Analysis

    14.1. U.S.

        14.1.1. Pricing Analysis

        14.1.2. Market Share Analysis, 2021

            14.1.2.1. By Product Type

            14.1.2.2. By Application

            14.1.2.3. By Sales Channel

    14.2. Canada

        14.2.1. Pricing Analysis

        14.2.2. Market Share Analysis, 2021

            14.2.2.1. By Product Type

            14.2.2.2. By Application

            14.2.2.3. By Sales Channel

    14.3. Brazil

        14.3.1. Pricing Analysis

        14.3.2. Market Share Analysis, 2021

            14.3.2.1. By Product Type

            14.3.2.2. By Application

            14.3.2.3. By Sales Channel

    14.4. Mexico

        14.4.1. Pricing Analysis

        14.4.2. Market Share Analysis, 2021

            14.4.2.1. By Product Type

            14.4.2.2. By Application

            14.4.2.3. By Sales Channel

    14.5. Germany

        14.5.1. Pricing Analysis

        14.5.2. Market Share Analysis, 2021

            14.5.2.1. By Product Type

            14.5.2.2. By Application

            14.5.2.3. By Sales Channel

    14.6. U.K.

        14.6.1. Pricing Analysis

        14.6.2. Market Share Analysis, 2021

            14.6.2.1. By Product Type

            14.6.2.2. By Application

            14.6.2.3. By Sales Channel

    14.7. France

        14.7.1. Pricing Analysis

        14.7.2. Market Share Analysis, 2021

            14.7.2.1. By Product Type

            14.7.2.2. By Application

            14.7.2.3. By Sales Channel

    14.8. Spain

        14.8.1. Pricing Analysis

        14.8.2. Market Share Analysis, 2021

            14.8.2.1. By Product Type

            14.8.2.2. By Application

            14.8.2.3. By Sales Channel

    14.9. Italy

        14.9.1. Pricing Analysis

        14.9.2. Market Share Analysis, 2021

            14.9.2.1. By Product Type

            14.9.2.2. By Application

            14.9.2.3. By Sales Channel

    14.10. China

        14.10.1. Pricing Analysis

        14.10.2. Market Share Analysis, 2021

            14.10.2.1. By Product Type

            14.10.2.2. By Application

            14.10.2.3. By Sales Channel

    14.11. Japan

        14.11.1. Pricing Analysis

        14.11.2. Market Share Analysis, 2021

            14.11.2.1. By Product Type

            14.11.2.2. By Application

            14.11.2.3. By Sales Channel

    14.12. South Korea

        14.12.1. Pricing Analysis

        14.12.2. Market Share Analysis, 2021

            14.12.2.1. By Product Type

            14.12.2.2. By Application

            14.12.2.3. By Sales Channel

    14.13. Malaysia

        14.13.1. Pricing Analysis

        14.13.2. Market Share Analysis, 2021

            14.13.2.1. By Product Type

            14.13.2.2. By Application

            14.13.2.3. By Sales Channel

    14.14. Singapore

        14.14.1. Pricing Analysis

        14.14.2. Market Share Analysis, 2021

            14.14.2.1. By Product Type

            14.14.2.2. By Application

            14.14.2.3. By Sales Channel

    14.15. Australia

        14.15.1. Pricing Analysis

        14.15.2. Market Share Analysis, 2021

            14.15.2.1. By Product Type

            14.15.2.2. By Application

            14.15.2.3. By Sales Channel

    14.16. New Zealand

        14.16.1. Pricing Analysis

        14.16.2. Market Share Analysis, 2021

            14.16.2.1. By Product Type

            14.16.2.2. By Application

            14.16.2.3. By Sales Channel

    14.17. GCC Countries

        14.17.1. Pricing Analysis

        14.17.2. Market Share Analysis, 2021

            14.17.2.1. By Product Type

            14.17.2.2. By Application

            14.17.2.3. By Sales Channel

    14.18. South Africa

        14.18.1. Pricing Analysis

        14.18.2. Market Share Analysis, 2021

            14.18.2.1. By Product Type

            14.18.2.2. By Application

            14.18.2.3. By Sales Channel

    14.19. Israel

        14.19.1. Pricing Analysis

        14.19.2. Market Share Analysis, 2021

            14.19.2.1. By Product Type

            14.19.2.2. By Application

            14.19.2.3. By Sales Channel

15. Market Structure Analysis

    15.1. Competition Dashboard

    15.2. Competition Benchmarking

    15.3. Market Share Analysis of Top Players

        15.3.1. By Regional

        15.3.2. By Product Type

        15.3.3. By Application

        15.3.4. By Sales Channel

16. Competition Analysis

    16.1. Competition Deep Dive

        16.1.1. McCormick & Company

            16.1.1.1. Overview

            16.1.1.2. Product Portfolio

            16.1.1.3. Profitability by Market Segments

            16.1.1.4. Sales Footprint

            16.1.1.5. Strategy Overview

                16.1.1.5.1. Marketing Strategy

                16.1.1.5.2. Product Strategy

                16.1.1.5.3. Channel Strategy

        16.1.2. The Tracklement Company Ltd

            16.1.2.1. Overview

            16.1.2.2. Product Portfolio

            16.1.2.3. Profitability by Market Segments

            16.1.2.4. Sales Footprint

            16.1.2.5. Strategy Overview

                16.1.2.5.1. Marketing Strategy

                16.1.2.5.2. Product Strategy

                16.1.2.5.3. Channel Strategy

        16.1.3. Kaveri Seeds

            16.1.3.1. Overview

            16.1.3.2. Product Portfolio

            16.1.3.3. Profitability by Market Segments

            16.1.3.4. Sales Footprint

            16.1.3.5. Strategy Overview

                16.1.3.5.1. Marketing Strategy

                16.1.3.5.2. Product Strategy

                16.1.3.5.3. Channel Strategy

        16.1.4. Sakai Spice

            16.1.4.1. Overview

            16.1.4.2. Product Portfolio

            16.1.4.3. Profitability by Market Segments

            16.1.4.4. Sales Footprint

            16.1.4.5. Strategy Overview

                16.1.4.5.1. Marketing Strategy

                16.1.4.5.2. Product Strategy

                16.1.4.5.3. Channel Strategy

        16.1.5. Megha Corporation

            16.1.5.1. Overview

            16.1.5.2. Product Portfolio

            16.1.5.3. Profitability by Market Segments

            16.1.5.4. Sales Footprint

            16.1.5.5. Strategy Overview

                16.1.5.5.1. Marketing Strategy

                16.1.5.5.2. Product Strategy

                16.1.5.5.3. Channel Strategy

        16.1.6. Organic Products India ltd

            16.1.6.1. Overview

            16.1.6.2. Product Portfolio

            16.1.6.3. Profitability by Market Segments

            16.1.6.4. Sales Footprint

            16.1.6.5. Strategy Overview

                16.1.6.5.1. Marketing Strategy

                16.1.6.5.2. Product Strategy

                16.1.6.5.3. Channel Strategy

        16.1.7. Sun Impex

            16.1.7.1. Overview

            16.1.7.2. Product Portfolio

            16.1.7.3. Profitability by Market Segments

            16.1.7.4. Sales Footprint

            16.1.7.5. Strategy Overview

                16.1.7.5.1. Marketing Strategy

                16.1.7.5.2. Product Strategy

                16.1.7.5.3. Channel Strategy

17. Assumptions & Acronyms Used

18. Research Methodology

List of Tables

Table 1: Global Market Value (US$ Mn) Forecast by Region, 2017-2032

Table 2: Global Market Volume (Tons) Forecast by Region, 2017-2032

Table 3: Global Market Value (US$ Mn) Forecast by Product Type, 2017-2032

Table 4: Global Market Volume (Tons) Forecast by Product Type, 2017-2032

Table 5: Global Market Value (US$ Mn) Forecast by Application, 2017-2032

Table 6: Global Market Volume (Tons) Forecast by Application, 2017-2032

Table 7: Global Market Value (US$ Mn) Forecast by Sales Channel, 2017-2032

Table 8: Global Market Volume (Tons) Forecast by Sales Channel, 2017-2032

Table 9: North America Market Value (US$ Mn) Forecast by Country, 2017-2032

Table 10: North America Market Volume (Tons) Forecast by Country, 2017-2032

Table 11: North America Market Value (US$ Mn) Forecast by Product Type, 2017-2032

Table 12: North America Market Volume (Tons) Forecast by Product Type, 2017-2032

Table 13: North America Market Value (US$ Mn) Forecast by Application, 2017-2032

Table 14: North America Market Volume (Tons) Forecast by Application, 2017-2032

Table 15: North America Market Value (US$ Mn) Forecast by Sales Channel, 2017-2032

Table 16: North America Market Volume (Tons) Forecast by Sales Channel, 2017-2032

Table 17: Latin America Market Value (US$ Mn) Forecast by Country, 2017-2032

Table 18: Latin America Market Volume (Tons) Forecast by Country, 2017-2032

Table 19: Latin America Market Value (US$ Mn) Forecast by Product Type, 2017-2032

Table 20: Latin America Market Volume (Tons) Forecast by Product Type, 2017-2032

Table 21: Latin America Market Value (US$ Mn) Forecast by Application, 2017-2032

Table 22: Latin America Market Volume (Tons) Forecast by Application, 2017-2032

Table 23: Latin America Market Value (US$ Mn) Forecast by Sales Channel, 2017-2032

Table 24: Latin America Market Volume (Tons) Forecast by Sales Channel, 2017-2032

Table 25: Europe Market Value (US$ Mn) Forecast by Country, 2017-2032

Table 26: Europe Market Volume (Tons) Forecast by Country, 2017-2032

Table 27: Europe Market Value (US$ Mn) Forecast by Product Type, 2017-2032

Table 28: Europe Market Volume (Tons) Forecast by Product Type, 2017-2032

Table 29: Europe Market Value (US$ Mn) Forecast by Application, 2017-2032

Table 30: Europe Market Volume (Tons) Forecast by Application, 2017-2032

Table 31: Europe Market Value (US$ Mn) Forecast by Sales Channel, 2017-2032

Table 32: Europe Market Volume (Tons) Forecast by Sales Channel, 2017-2032

Table 33: Asia Pacific Market Value (US$ Mn) Forecast by Country, 2017-2032

Table 34: Asia Pacific Market Volume (Tons) Forecast by Country, 2017-2032

Table 35: Asia Pacific Market Value (US$ Mn) Forecast by Product Type, 2017-2032

Table 36: Asia Pacific Market Volume (Tons) Forecast by Product Type, 2017-2032

Table 37: Asia Pacific Market Value (US$ Mn) Forecast by Application, 2017-2032

Table 38: Asia Pacific Market Volume (Tons) Forecast by Application, 2017-2032

Table 39: Asia Pacific Market Value (US$ Mn) Forecast by Sales Channel, 2017-2032

Table 40: Asia Pacific Market Volume (Tons) Forecast by Sales Channel, 2017-2032

Table 41: MEA Market Value (US$ Mn) Forecast by Country, 2017-2032

Table 42: MEA Market Volume (Tons) Forecast by Country, 2017-2032

Table 43: MEA Market Value (US$ Mn) Forecast by Product Type, 2017-2032

Table 44: MEA Market Volume (Tons) Forecast by Product Type, 2017-2032

Table 45: MEA Market Value (US$ Mn) Forecast by Application, 2017-2032

Table 46: MEA Market Volume (Tons) Forecast by Application, 2017-2032

Table 47: MEA Market Value (US$ Mn) Forecast by Sales Channel, 2017-2032

Table 48: MEA Market Volume (Tons) Forecast by Sales Channel, 2017-2032

List of Charts

Figure 1: Global Market Value (US$ Mn) by Product Type, 2022-2032

Figure 2: Global Market Value (US$ Mn) by Application, 2022-2032

Figure 3: Global Market Value (US$ Mn) by Sales Channel, 2022-2032

Figure 4: Global Market Value (US$ Mn) by Region, 2022-2032

Figure 5: Global Market Value (US$ Mn) Analysis by Region, 2017-2032

Figure 6: Global Market Volume (Tons) Analysis by Region, 2017-2032

Figure 7: Global Market Value Share (%) and BPS Analysis by Region, 2022-2032

Figure 8: Global Market Y-o-Y Growth (%) Projections by Region, 2022-2032

Figure 9: Global Market Value (US$ Mn) Analysis by Product Type, 2017-2032

Figure 10: Global Market Volume (Tons) Analysis by Product Type, 2017-2032

Figure 11: Global Market Value Share (%) and BPS Analysis by Product Type, 2022-2032

Figure 12: Global Market Y-o-Y Growth (%) Projections by Product Type, 2022-2032

Figure 13: Global Market Value (US$ Mn) Analysis by Application, 2017-2032

Figure 14: Global Market Volume (Tons) Analysis by Application, 2017-2032

Figure 15: Global Market Value Share (%) and BPS Analysis by Application, 2022-2032

Figure 16: Global Market Y-o-Y Growth (%) Projections by Application, 2022-2032

Figure 17: Global Market Value (US$ Mn) Analysis by Sales Channel, 2017-2032

Figure 18: Global Market Volume (Tons) Analysis by Sales Channel, 2017-2032

Figure 19: Global Market Value Share (%) and BPS Analysis by Sales Channel, 2022-2032

Figure 20: Global Market Y-o-Y Growth (%) Projections by Sales Channel, 2022-2032

Figure 21: Global Market Attractiveness by Product Type, 2022-2032

Figure 22: Global Market Attractiveness by Application, 2022-2032

Figure 23: Global Market Attractiveness by Sales Channel, 2022-2032

Figure 24: Global Market Attractiveness by Region, 2022-2032

Figure 25: North America Market Value (US$ Mn) by Product Type, 2022-2032

Figure 26: North America Market Value (US$ Mn) by Application, 2022-2032

Figure 27: North America Market Value (US$ Mn) by Sales Channel, 2022-2032

Figure 28: North America Market Value (US$ Mn) by Country, 2022-2032

Figure 29: North America Market Value (US$ Mn) Analysis by Country, 2017-2032

Figure 30: North America Market Volume (Tons) Analysis by Country, 2017-2032

Figure 31: North America Market Value Share (%) and BPS Analysis by Country, 2022-2032

Figure 32: North America Market Y-o-Y Growth (%) Projections by Country, 2022-2032

Figure 33: North America Market Value (US$ Mn) Analysis by Product Type, 2017-2032

Figure 34: North America Market Volume (Tons) Analysis by Product Type, 2017-2032

Figure 35: North America Market Value Share (%) and BPS Analysis by Product Type, 2022-2032

Figure 36: North America Market Y-o-Y Growth (%) Projections by Product Type, 2022-2032

Figure 37: North America Market Value (US$ Mn) Analysis by Application, 2017-2032

Figure 38: North America Market Volume (Tons) Analysis by Application, 2017-2032

Figure 39: North America Market Value Share (%) and BPS Analysis by Application, 2022-2032

Figure 40: North America Market Y-o-Y Growth (%) Projections by Application, 2022-2032

Figure 41: North America Market Value (US$ Mn) Analysis by Sales Channel, 2017-2032

Figure 42: North America Market Volume (Tons) Analysis by Sales Channel, 2017-2032

Figure 43: North America Market Value Share (%) and BPS Analysis by Sales Channel, 2022-2032

Figure 44: North America Market Y-o-Y Growth (%) Projections by Sales Channel, 2022-2032

Figure 45: North America Market Attractiveness by Product Type, 2022-2032

Figure 46: North America Market Attractiveness by Application, 2022-2032

Figure 47: North America Market Attractiveness by Sales Channel, 2022-2032

Figure 48: North America Market Attractiveness by Country, 2022-2032

Figure 49: Latin America Market Value (US$ Mn) by Product Type, 2022-2032

Figure 50: Latin America Market Value (US$ Mn) by Application, 2022-2032

Figure 51: Latin America Market Value (US$ Mn) by Sales Channel, 2022-2032

Figure 52: Latin America Market Value (US$ Mn) by Country, 2022-2032

Figure 53: Latin America Market Value (US$ Mn) Analysis by Country, 2017-2032

Figure 54: Latin America Market Volume (Tons) Analysis by Country, 2017-2032

Figure 55: Latin America Market Value Share (%) and BPS Analysis by Country, 2022-2032

Figure 56: Latin America Market Y-o-Y Growth (%) Projections by Country, 2022-2032

Figure 57: Latin America Market Value (US$ Mn) Analysis by Product Type, 2017-2032

Figure 58: Latin America Market Volume (Tons) Analysis by Product Type, 2017-2032

Figure 59: Latin America Market Value Share (%) and BPS Analysis by Product Type, 2022-2032

Figure 60: Latin America Market Y-o-Y Growth (%) Projections by Product Type, 2022-2032

Figure 61: Latin America Market Value (US$ Mn) Analysis by Application, 2017-2032

Figure 62: Latin America Market Volume (Tons) Analysis by Application, 2017-2032

Figure 63: Latin America Market Value Share (%) and BPS Analysis by Application, 2022-2032

Figure 64: Latin America Market Y-o-Y Growth (%) Projections by Application, 2022-2032

Figure 65: Latin America Market Value (US$ Mn) Analysis by Sales Channel, 2017-2032

Figure 66: Latin America Market Volume (Tons) Analysis by Sales Channel, 2017-2032

Figure 67: Latin America Market Value Share (%) and BPS Analysis by Sales Channel, 2022-2032

Figure 68: Latin America Market Y-o-Y Growth (%) Projections by Sales Channel, 2022-2032

Figure 69: Latin America Market Attractiveness by Product Type, 2022-2032

Figure 70: Latin America Market Attractiveness by Application, 2022-2032

Figure 71: Latin America Market Attractiveness by Sales Channel, 2022-2032

Figure 72: Latin America Market Attractiveness by Country, 2022-2032

Figure 73: Europe Market Value (US$ Mn) by Product Type, 2022-2032

Figure 74: Europe Market Value (US$ Mn) by Application, 2022-2032

Figure 75: Europe Market Value (US$ Mn) by Sales Channel, 2022-2032

Figure 76: Europe Market Value (US$ Mn) by Country, 2022-2032

Figure 77: Europe Market Value (US$ Mn) Analysis by Country, 2017-2032

Figure 78: Europe Market Volume (Tons) Analysis by Country, 2017-2032

Figure 79: Europe Market Value Share (%) and BPS Analysis by Country, 2022-2032

Figure 80: Europe Market Y-o-Y Growth (%) Projections by Country, 2022-2032

Figure 81: Europe Market Value (US$ Mn) Analysis by Product Type, 2017-2032

Figure 82: Europe Market Volume (Tons) Analysis by Product Type, 2017-2032

Figure 83: Europe Market Value Share (%) and BPS Analysis by Product Type, 2022-2032

Figure 84: Europe Market Y-o-Y Growth (%) Projections by Product Type, 2022-2032

Figure 85: Europe Market Value (US$ Mn) Analysis by Application, 2017-2032

Figure 86: Europe Market Volume (Tons) Analysis by Application, 2017-2032

Figure 87: Europe Market Value Share (%) and BPS Analysis by Application, 2022-2032

Figure 88: Europe Market Y-o-Y Growth (%) Projections by Application, 2022-2032

Figure 89: Europe Market Value (US$ Mn) Analysis by Sales Channel, 2017-2032

Figure 90: Europe Market Volume (Tons) Analysis by Sales Channel, 2017-2032

Figure 91: Europe Market Value Share (%) and BPS Analysis by Sales Channel, 2022-2032

Figure 92: Europe Market Y-o-Y Growth (%) Projections by Sales Channel, 2022-2032

Figure 93: Europe Market Attractiveness by Product Type, 2022-2032

Figure 94: Europe Market Attractiveness by Application, 2022-2032

Figure 95: Europe Market Attractiveness by Sales Channel, 2022-2032

Figure 96: Europe Market Attractiveness by Country, 2022-2032

Figure 97: Asia Pacific Market Value (US$ Mn) by Product Type, 2022-2032

Figure 98: Asia Pacific Market Value (US$ Mn) by Application, 2022-2032

Figure 99: Asia Pacific Market Value (US$ Mn) by Sales Channel, 2022-2032

Figure 100: Asia Pacific Market Value (US$ Mn) by Country, 2022-2032

Figure 101: Asia Pacific Market Value (US$ Mn) Analysis by Country, 2017-2032

Figure 102: Asia Pacific Market Volume (Tons) Analysis by Country, 2017-2032

Figure 103: Asia Pacific Market Value Share (%) and BPS Analysis by Country, 2022-2032

Figure 104: Asia Pacific Market Y-o-Y Growth (%) Projections by Country, 2022-2032

Figure 105: Asia Pacific Market Value (US$ Mn) Analysis by Product Type, 2017-2032

Figure 106: Asia Pacific Market Volume (Tons) Analysis by Product Type, 2017-2032

Figure 107: Asia Pacific Market Value Share (%) and BPS Analysis by Product Type, 2022-2032

Figure 108: Asia Pacific Market Y-o-Y Growth (%) Projections by Product Type, 2022-2032

Figure 109: Asia Pacific Market Value (US$ Mn) Analysis by Application, 2017-2032

Figure 110: Asia Pacific Market Volume (Tons) Analysis by Application, 2017-2032

Figure 111: Asia Pacific Market Value Share (%) and BPS Analysis by Application, 2022-2032

Figure 112: Asia Pacific Market Y-o-Y Growth (%) Projections by Application, 2022-2032

Figure 113: Asia Pacific Market Value (US$ Mn) Analysis by Sales Channel, 2017-2032

Figure 114: Asia Pacific Market Volume (Tons) Analysis by Sales Channel, 2017-2032

Figure 115: Asia Pacific Market Value Share (%) and BPS Analysis by Sales Channel, 2022-2032

Figure 116: Asia Pacific Market Y-o-Y Growth (%) Projections by Sales Channel, 2022-2032

Figure 117: Asia Pacific Market Attractiveness by Product Type, 2022-2032

Figure 118: Asia Pacific Market Attractiveness by Application, 2022-2032

Figure 119: Asia Pacific Market Attractiveness by Sales Channel, 2022-2032

Figure 120: Asia Pacific Market Attractiveness by Country, 2022-2032

Figure 121: MEA Market Value (US$ Mn) by Product Type, 2022-2032

Figure 122: MEA Market Value (US$ Mn) by Application, 2022-2032

Figure 123: MEA Market Value (US$ Mn) by Sales Channel, 2022-2032

Figure 124: MEA Market Value (US$ Mn) by Country, 2022-2032

Figure 125: MEA Market Value (US$ Mn) Analysis by Country, 2017-2032

Figure 126: MEA Market Volume (Tons) Analysis by Country, 2017-2032

Figure 127: MEA Market Value Share (%) and BPS Analysis by Country, 2022-2032

Figure 128: MEA Market Y-o-Y Growth (%) Projections by Country, 2022-2032

Figure 129: MEA Market Value (US$ Mn) Analysis by Product Type, 2017-2032

Figure 130: MEA Market Volume (Tons) Analysis by Product Type, 2017-2032

Figure 131: MEA Market Value Share (%) and BPS Analysis by Product Type, 2022-2032

Figure 132: MEA Market Y-o-Y Growth (%) Projections by Product Type, 2022-2032

Figure 133: MEA Market Value (US$ Mn) Analysis by Application, 2017-2032

Figure 134: MEA Market Volume (Tons) Analysis by Application, 2017-2032

Figure 135: MEA Market Value Share (%) and BPS Analysis by Application, 2022-2032

Figure 136: MEA Market Y-o-Y Growth (%) Projections by Application, 2022-2032

Figure 137: MEA Market Value (US$ Mn) Analysis by Sales Channel, 2017-2032

Figure 138: MEA Market Volume (Tons) Analysis by Sales Channel, 2017-2032

Figure 139: MEA Market Value Share (%) and BPS Analysis by Sales Channel, 2022-2032

Figure 140: MEA Market Y-o-Y Growth (%) Projections by Sales Channel, 2022-2032

Figure 141: MEA Market Attractiveness by Product Type, 2022-2032

Figure 142: MEA Market Attractiveness by Application, 2022-2032

Figure 143: MEA Market Attractiveness by Sales Channel, 2022-2032

Figure 144: MEA Market Attractiveness by Country, 2022-2032

Recommendations

Food and Beverage

Cassia Seed Extract Market

Published : July 2023

Food and Beverage

Forage Seeds Market

Published : February 2023

Food and Beverage

Seed Polymers Market

Published : October 2022

Food and Beverage

Psyllium Seed Market

Published : October 2022

Explore Food and Beverage Insights

View Reports