Reports

- Global Locations -

Headquarters

Future Market Insights, Inc.

Christiana Corporate, 200
Continental Drive, Suite 401,
Newark, Delaware - 19713,
United States

T: +1-845-579-5705

Americas

Future Market Insights, Inc.

616 Corporate Way, Suite 2-9018,
Valley Cottage, NY 10989, United States

T: +1-347-918-3531

MEA

Future Market Insights

1602-6 Jumeirah Bay X2 Tower, Plot No: JLT-PH2-X2A,
Jumeirah Lakes Towers, Dubai,
United Arab Emirates

Europe

Future Market Insights

3rd Floor, 207 Regent Street,
W1B 3HH London
United Kingdom

T: + 44 (0) 20 8123 9659
D: +44 (0) 20 3287 4268

Asia Pacific

Future Market Insights

IndiaLand Global Tech Park, Unit UG-1, Behind Grand HighStreet, Phase 1, Hinjawadi, MH, Pune – 411057, India

Nano Dentistry Market Snapshot (2023 to 2033)

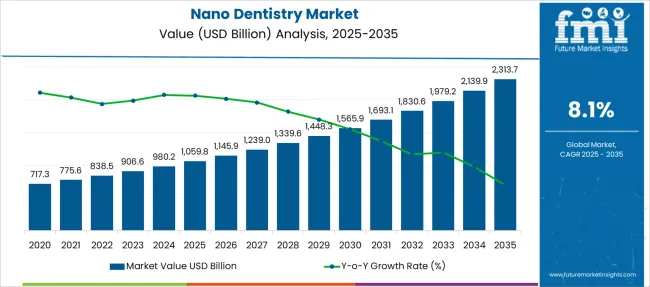
The global nano dentistry market was valued at US$ 838.54 Million in 2022 and is anticipated to achieve a market valuation of US$ 906.66 Million in 2023. It is further estimated to reach a market valuation of US$ 1.98 Billion by the end of the forecast period while exhibiting a CAGR of 8.12%. The rising prevalence of dental diseases, growing demand for nano dentistry products, increasing oral hygiene awareness, and rising adoption of advanced dental technology is propelling the market growth.

The COVID-19 pandemic has disrupted the dental industry and negatively impacted patient care services. According to British Dental Association, nearly 19 million dental appointments were postponed or canceled in 2020 out of a probable total of 40 million. Moreover, due to the stringent guidelines during the COVID-19 pandemic, the United Kingdom government enforced several restrictions on dental procedures and surgeries that could be performed during the summer of 2020. Companies such as Dentsply Sirona reported a decline of around 50% in net sales and sales of dental consumables declined by 58.5%, leading to an operating loss of USD 42.01 million in the second quarter. However, the market recovered steadily post-pandemic owing to the increasing demand for dental procedures due to the rise in dental diseases.

Nano dentistry utilizes nanotechnology for treating dental diseases. Nano dentistry facilitates faster and more accurate diagnosis. It augments the properties of dental materials due to their excellent handling properties and makes the material more durable. Nano-dental techniques for major tooth repair may evolve through many stages of technological growth using tissue engineering, genetic engineering, and tissue regeneration.

Nano dentistry is the future of the dental industry in which every procedure will be performed using advanced equipment and devices based on nanotechnology. Also, it can simplify teeth replacement within a single procedure with correction and precision, combining nanomedicine and biotechnology. The diagnoses and treatments are possible through nanorobots and nanoscale-structured materials which will further develop the robotics and nano dentistry industry.

It has become possible to develop materials that are durable with the help of nanotechnology. These products are made for numerous dental procedures and will have more hardness, elasticity, and strength than traditional dental materials. The technological advancement in the manufacture of nanoparticles for implant surface coating and nano formatting leads to better osseointegration and enhanced functions of implants.

Report Attribute Details
Expected Market Value (2023) US$ 906.66 Million
Anticipated Forecast Value (2033) US$ 1.98 Billion
Projected Growth Rate (2023 to 2033) 8.12%

Don't pay for what you don't need

Customize your report by selecting specific countries or regions and save 30%!

Nano Dentistry Market Historical Period (2018 to 2022) vs. Nano Dentistry Market Industry Forecast 2023 to 2033

The Global nano dentistry market size was valued at US$ 838.54 Million in 2022 while exhibiting a CAGR of 9.1% during the historical period. The rising prevalence of dental diseases, growing demand for nano dentistry products, increasing oral hygiene awareness, and increasing adoption of advanced dental technology is augmenting the market growth.

Considering these factors, the global nano dentistry market is projected to garner a valuation of US$ 1.98 Billion by the end of the forecast period, exhibiting a CAGR of 8.12%.

What are the key Drivers for the Nano dentistry market?

Technological Advancements will fuel the market growth of Nano Dentistry

According to nano-dentistry research, nanorobots can insert periodontal tissue directly, making it more convenient to reposition, orthodontic, and rotate teeth quickly. This advancement helps orthodontists treat molars, which can take weeks or months to complete the procedure. In summary, the market objective for nano-dentistry is to bring progress in monitoring, controlling, engineering, repairing, and enhancing the patient's overall oral health. This technology has wonderful potential to change the healthcare industry. Better technology, advanced medicines and solutions, and long-term impression will prioritize the demand for nano-dentistry. All these factors are expected to augment the nano-dentistry market growth during the forecast period.

Sabyasachi Ghosh
Sabyasachi Ghosh

Principal Consultant

Talk to Analyst

Find your sweet spots for generating winning opportunities in this market.

What are the Challenges likely to be Faced by the Market?

A decline in patient awareness and education regarding nano-dentistry is one of the challenges in the expansion of the nano-dentistry market. There is growing concerned about the safety of non-materials in various products. Nanoparticles have a high surface area-to-volume ratio. The larger the specific surface area, the more likely it is to be absorbed through the skin, lungs, or gastrointestinal tract. This can have unsought effects on the lungs and other organs throughout the body due to the potential for the accumulation of non-degradable nanoparticles.
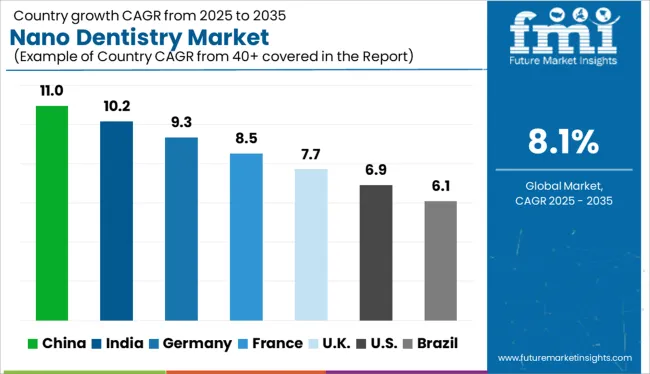
Region-Wise Insights

Rising Dental Diseases are leading to Market Expansion in North America

In 2022, North America dominated the market with a revenue share of over 38.4% because of factors including growing Research and Development activities in dentistry, increasing disposable income, and the presence of independent clinics. Moreover, the rising government funding for dental programs is likely to contribute to market growth.

According to CDC, in 2019, 47.20% of adults aged 30 years in the USA had some form of periodontal disease, with the condition being more commonly present in men than women, as they are more prone to smoking & health conditions such as diabetes. The rising prevalence of oral diseases is anticipated to boost the growth of the nano dentistry market. Adult education, sensitization on oral hygiene, and the need for treatment have stimulated local demand in the region.

Better Dental Service at a Lower Cost makes Asia Pacific the Most Lucrative Market for Nano Dentistry

Asia Pacific is expected to witness the fastest growth of 8.4% from 2023 to 2033 as this region is densely populated, with a growing geriatric population and prevalent oral diseases. Asia-Pacific countries are also known for their low-cost dental treatment, making them a target medical tourism market. Asia Pacific is likely to record significant growth owing to the medical tourism industry expansion. Better services at comparatively lower costs and improvement in healthcare infrastructure will fuel regional growth. However, high costs for the local population and limited awareness regarding novel techniques may hinder the market growth.

Get the data you need at a Fraction of the cost

Personalize your report by choosing insights you need
and save 40%!

Category-Wise Insights

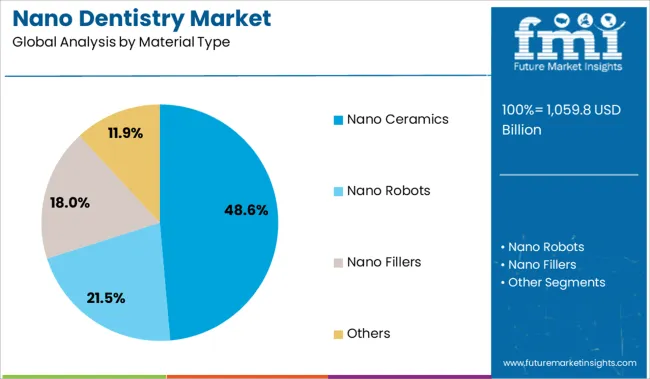
Nanoceramics dominates the segment with a revenue share of 38.1%

In 2022, the nanoceramics segment dominated the market and held a revenue share of over 38.1%. Nanoceramics possess chemical, physical, and mechanical properties that contrast them from other materials such as traditional ceramic materials, metals, and plastics. Nanoceramics are tremendously strong and display great resistance against bending and compression. This material improves the overall functionality of various dental materials and dental prostheses in the oral cavity.

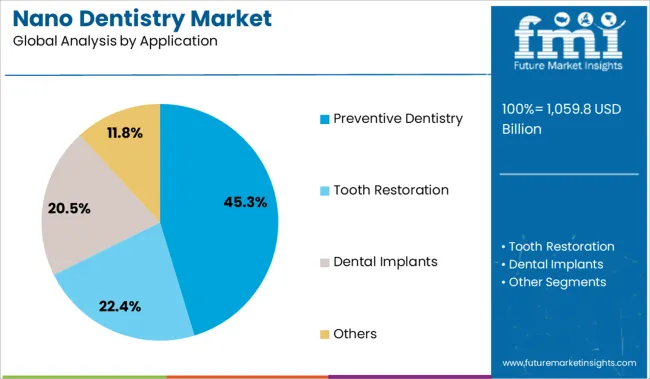
With a Revenue Share of 35.25%, the tooth restoration segment dominates the market by Application

In 2022, the tooth restoration segment dominated the market with a revenue share of 35.25% and is likely to grow at a CAGR of 8% from 2023 to 2033 as it restores the natural function of the teeth and prevents additional damage from decay. Tooth restoration involves restorative materials generally used to replace a loss of tooth structure due to dental caries, or tooth wear due to dental trauma.

Additionally, they may be used to change the cosmetic appearance of an individual’s teeth. Restorative materials are anticipated to possess several properties such as resistance to chemical erosion & wear, low thermal conductivity & expansion, biocompatibility, and aesthetics among others.

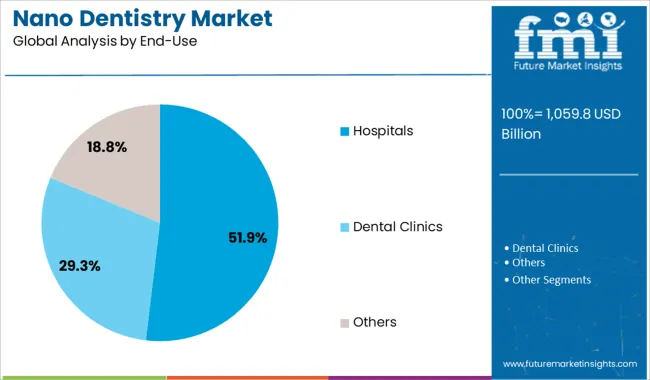
Dental Clinic Segment to grow with the highest CAGR of 11%

In 2022, the dental clinic segment dominated the market and held a revenue share of 51.7%. The dental clinic’s segment is also anticipated to witness the highest growth rate of 8.3% over the forecast period. owing to many dental colleges and clinics that have started in recent years. The increasing enrolment in dental courses is also propelling the growth of the segment.

For instance, as per the NCBI in 2019 2.7 lakh are registered with the Dental Council of India (DCI). The country achieved more than the ideal dentists-to-population ratio of 1:5,000, as against the 1:7,500 suggested by the WHO in 2020. The growing number of dental clinics and a high number of freshly passed-out dental students per year are likely to propel the segment growth.
Start-ups in the Nano Dentistry Market

  • Founded in 2012, Florida start-up Neocis has raised $17.4 million to develop a dental implant assistance robot called Yomi. One of their first investors was entrepreneur Fred Moll who co-founded the most well-known robotic surgery company today, Intuitive Surgical (NASDAQ: ISRG). Yomi is an integrated system that plans the treatment, monitors the patient, and helps the dentist be more precise. It starts with a CT scan of the jaw that helps determine the optimal location for the implant, then provides on-screen guidance during the surgery. The attached robotic arm guides the dentist’s movements so they exactly match the treatment plan. The result is a minimally invasive procedure that leads to faster recovery. Neocis received FDA clearance in March 2017 and signed its first client in Florida the same month.
  • Founded in 2013, Silicon Valley start-up Carbon has raised $422 million so far. Their Series D funding netted the company $200 million by the end of last year, making Carbon the most funded 3D printing startup of 2017. This latest round of funding (which included Sequoia Capital, Fidelity, and Baillie Gifford) will be used to expand the technology into new categories - like consumer electronics, medical and dental - that are already popular applications for 3D printing. Carbon claims their technology lowers costs by 12 to 25% and increases production turnaround by up to 40% for dental practices, which results in better cost management and happier clients. The company has declared partnerships with dental specialists DENTCA and DREVE to manufacture special resins for dentures, artificial gums, and dental impression trays. These collaborations will give the company a strong position in the competitive space of dental applications for 3D printing.
  • Founded in 2006, Laguna Hills, California start-up Sonendo has raised $170 million to develop an efficient and long-lasting root canal treatment. When the inside of a tooth called pulp becomes inflamed or infected, it needs to be removed, and the resulting cavity must be cleaned and disinfected. Traditional treatments use a series of files to reach inside the tooth and mechanically remove infected tissue. These files cannot reach all the twists, turns, and microscopic places along the canal walls where bacteria hide, increasing the risk of renewed infection and repeated procedures. Sonendo’s GentleWave technology injects a vortex of fluids into the tooth canal and uses sound waves to clean debris and thoroughly disinfect the cavity. Unlike ultrasound which is a single frequency, this tool delivers various wavelengths ranging from large (tissue scale) to small (cellular scale). Backed by clinical research and positive user testimonials, Sonendo currently offers the fourth generation of their root canal treatment system to USA dental practices.
  • Founded in 2008, Opencell Biomedical is a Canada-based start-up that develops nanotechnology-based implantable medical devices for the dental market. As of June 2017, the company is in the process of commercializing its nanotechnology-based dental implant which utilizes a titanium foam substrate and bone growth factors at a nano level to supercharge the tooth replacement process.

Market Competition

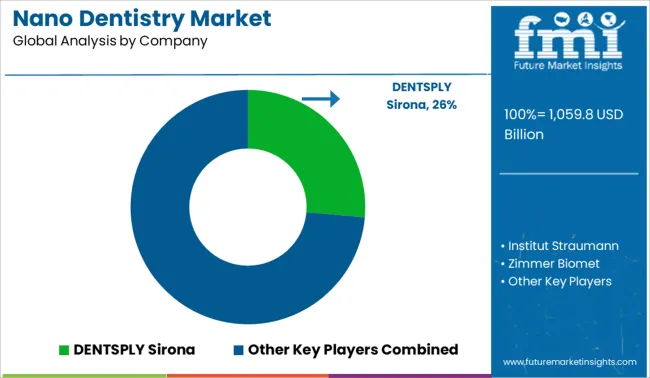
The global nano dentistry market is consolidated with few large and medium-sized players accounting for most of the market revenue. Major players are deploying various strategies, entering into mergers and acquisitions, strategic agreements and contracts, developing testing, and introducing more effective veterinary rehabilitation services solutions. Some of the major company profiles included in the global Nano dentistry market report are-

DENTSPLY Sirona, Institut Straumann, Zimmer Biomet, Ivoclar Vivadent, aap Implantate AG, Heraeus Kulzer, BioHorizons IPH, 3M, Danaher Corporation, Biotronik

  • In February 2021, Zimmer Biomet Holdings, Inc. announced its plan to spin off its Spine and Dental operations to become a new, independent, publicly listed company (NewCo). The anticipated deal would sharpen both Zimmer Biomet and NewCo's emphasis on meeting the demands of patients and consumers, resulting in quicker growth and more value for all stakeholders.
  • In November 2020, Doceram Medical Ceramics and Nobel Biocare announced an extended partnership in developing high-end restorative products. To provide more high-quality, beneficial solutions with convenience and flexibility for clients, both companies are merging their expertise.
  • In February 2022, Exocad, Align Technology Inc. announced its participation in the 2022 Dental South China (DSC) trade show in Guangzhou, China. Exocad showcased its software release DentalCAD3.0 Galway, plus other open software solutions.
  • In November 2021, Keystone Dental Inc. announced that it completed the acquisition of Osteon Medical, a Melbourne, Australia-based technology company providing digital solutions for clinicians and dental laboratories leveraging proprietary software and unique hardware developments, significantly improving digital dentistry market grip.

Report Scope

Report Attribute Details
Market Value in 2023 US$ 906.66 Million
Market Value in 2033 US$ 1.98 Billion
Growth Rate CAGR of 8.12% from 2023 to 2033
Base Year for Estimation 2022
Historical Data 2018 to 2022
Forecast Period 2023 to 2033
Quantitative Units Revenue in US$ Million and Billion and CAGR from 2023 to 2033
Report Coverage Revenue Forecast, Volume Forecast, Company Ranking, Competitive Landscape, Growth Factors, Challenges, Trends, and Pricing Analysis
Segments Covered
  • Material
  • Application
  • End User
  • Region
Regions Covered
  • North America
  • Latin America
  • Europe
  • Asia Pacific
  • Middle East & Africa
Key Countries Profiled
  • USA
  • Canada
  • Brazil
  • Mexico
  • Germany
  • United Kingdom
  • France
  • Spain
  • Italy
  • China
  • Japan
  • South Korea
  • Indonesia
  • Singapore
  • Thailand
  • Australia
  • New Zealand
  • GCC Countries
  • South Africa
  • Israel
Key Companies Profiled
  • DENTSPLY Sirona
  • Institut Straumann
  • Zimmer Biomet
  • Ivoclar Vivadent
  • aap Implantate AG
  • Heraeus Kulzer
  • BioHorizons IPH
  • 3M
  • Danaher Corporation
  • Biotronik
Customization Available Upon Request

Key Segments Profiled in the Nano Dentistry Industry Survey

Nano Dentistry Market by Material Type:

  • Nano Ceramics
  • Nano Robots
  • Nano Fillers
  • Others

Nano Dentistry Market by Application:

  • Preventive Dentistry
  • Tooth Restoration
  • Dental Implants
  • Others

Nano Dentistry Market by End-Use:

  • Hospitals
  • Dental Clinics
  • Others

Nano Dentistry Market by Region:

  • North America
  • Europe
  • Asia Pacific
  • Latin America
  • Middle East and Africa (MEA)

Frequently Asked Questions

What is the anticipated growth rate for the Nano dentistry market until 2033?

FMI projects the global nano dentistry market to expand at an 8.12% value CAGR by 2033

What is the estimated market value of the nano dentistry market expected in 2023?

The global Nano dentistry market is estimated at a market value of US$ 906.66 Million

Which region will witness the highest CAGR growth in the nano dentistry market?

Asia Pacific is anticipated to witness the fastest CAGR of 8.4% during the forecast period.

By material type, which segment is going to dominate the Nano dentistry market?

The nanoceramics segment is expected to dominate the material segment with a market revenue share of around 38.1%

By Application, which segment is expected to dominate the Nano dentistry market by 2033?

The tooth restoration segment is expected to dominate the segment with a revenue share of 35.25%

Table of Content

1. Executive Summary | Nano Dentistry Market

    1.1. Global Market Outlook

    1.2. Demand-side Trends

    1.3. Supply-side Trends

    1.4. Technology Roadmap Analysis

    1.5. Analysis and Recommendations

2. Market Overview

    2.1. Market Coverage / Taxonomy

    2.2. Market Definition / Scope / Limitations

3. Market Background

    3.1. Market Dynamics

        3.1.1. Drivers

        3.1.2. Restraints

        3.1.3. Opportunity

        3.1.4. Trends

    3.2. Scenario Forecast

        3.2.1. Demand in Optimistic Scenario

        3.2.2. Demand in Likely Scenario

        3.2.3. Demand in Conservative Scenario

    3.3. Opportunity Map Analysis

    3.4. Investment Feasibility Matrix

    3.5. PESTLE and Porter’s Analysis

    3.6. Regulatory Landscape

        3.6.1. By Key Regions

        3.6.2. By Key Countries

    3.7. Regional Parent Market Outlook

4. Global Market Analysis 2018 to 2022 and Forecast, 2023 to 2033

    4.1. Historical Market Size Value (US$ Million) Analysis, 2018 to 2022

    4.2. Current and Future Market Size Value (US$ Million) Projections, 2023 to 2033

        4.2.1. Y-o-Y Growth Trend Analysis

        4.2.2. Absolute $ Opportunity Analysis

5. Global Market Analysis 2018 to 2022 and Forecast 2023 to 2033, By Material Type

    5.1. Introduction / Key Findings

    5.2. Historical Market Size Value (US$ Million) Analysis By Material Type, 2018 to 2022

    5.3. Current and Future Market Size Value (US$ Million) Analysis and Forecast By Material Type, 2023 to 2033

        5.3.1. Nano Ceramics

        5.3.2. Nano Fillers

        5.3.3. Nano Robots

        5.3.4. Others

    5.4. Y-o-Y Growth Trend Analysis By Material Type, 2018 to 2022

    5.5. Absolute $ Opportunity Analysis By Material Type, 2023 to 2033

6. Global Market Analysis 2018 to 2022 and Forecast 2023 to 2033, By Application

    6.1. Introduction / Key Findings

    6.2. Historical Market Size Value (US$ Million) Analysis By Application, 2018 to 2022

    6.3. Current and Future Market Size Value (US$ Million) Analysis and Forecast By Application, 2023 to 2033

        6.3.1. Preventive Dentistry

        6.3.2. Tooth Restoration

        6.3.3. Dental Implants

        6.3.4. Others

    6.4. Y-o-Y Growth Trend Analysis By Application, 2018 to 2022

    6.5. Absolute $ Opportunity Analysis By Application, 2023 to 2033

7. Global Market Analysis 2018 to 2022 and Forecast 2023 to 2033, By End-use

    7.1. Introduction / Key Findings

    7.2. Historical Market Size Value (US$ Million) Analysis By End-use, 2018 to 2022

    7.3. Current and Future Market Size Value (US$ Million) Analysis and Forecast By End-use, 2023 to 2033

        7.3.1. Hospitals

        7.3.2. Dental Clinics

        7.3.3. Others

    7.4. Y-o-Y Growth Trend Analysis By End-use, 2018 to 2022

    7.5. Absolute $ Opportunity Analysis By End-use, 2023 to 2033

8. Global Market Analysis 2018 to 2022 and Forecast 2023 to 2033, By Region

    8.1. Introduction

    8.2. Historical Market Size Value (US$ Million) Analysis By Region, 2018 to 2022

    8.3. Current Market Size Value (US$ Million) Analysis and Forecast By Region, 2023 to 2033

        8.3.1. North America

        8.3.2. Latin America

        8.3.3. Europe

        8.3.4. Asia Pacific

        8.3.5. Middle East and Africa(MEA)

    8.4. Market Attractiveness Analysis By Region

9. North America Market Analysis 2018 to 2022 and Forecast 2023 to 2033, By Country

    9.1. Historical Market Size Value (US$ Million) Trend Analysis By Market Taxonomy, 2018 to 2022

    9.2. Market Size Value (US$ Million) Forecast By Market Taxonomy, 2023 to 2033

        9.2.1. By Country

            9.2.1.1. USA

            9.2.1.2. Canada

        9.2.2. By Material Type

        9.2.3. By Application

        9.2.4. By End-use

    9.3. Market Attractiveness Analysis

        9.3.1. By Country

        9.3.2. By Material Type

        9.3.3. By Application

        9.3.4. By End-use

    9.4. Key Takeaways

10. Latin America Market Analysis 2018 to 2022 and Forecast 2023 to 2033, By Country

    10.1. Historical Market Size Value (US$ Million) Trend Analysis By Market Taxonomy, 2018 to 2022

    10.2. Market Size Value (US$ Million) Forecast By Market Taxonomy, 2023 to 2033

        10.2.1. By Country

            10.2.1.1. Brazil

            10.2.1.2. Mexico

            10.2.1.3. Rest of Latin America

        10.2.2. By Material Type

        10.2.3. By Application

        10.2.4. By End-use

    10.3. Market Attractiveness Analysis

        10.3.1. By Country

        10.3.2. By Material Type

        10.3.3. By Application

        10.3.4. By End-use

    10.4. Key Takeaways

11. Europe Market Analysis 2018 to 2022 and Forecast 2023 to 2033, By Country

    11.1. Historical Market Size Value (US$ Million) Trend Analysis By Market Taxonomy, 2018 to 2022

    11.2. Market Size Value (US$ Million) Forecast By Market Taxonomy, 2023 to 2033

        11.2.1. By Country

            11.2.1.1. Germany

            11.2.1.2. United Kingdom

            11.2.1.3. France

            11.2.1.4. Spain

            11.2.1.5. Italy

            11.2.1.6. Rest of Europe

        11.2.2. By Material Type

        11.2.3. By Application

        11.2.4. By End-use

    11.3. Market Attractiveness Analysis

        11.3.1. By Country

        11.3.2. By Material Type

        11.3.3. By Application

        11.3.4. By End-use

    11.4. Key Takeaways

12. Asia Pacific Market Analysis 2018 to 2022 and Forecast 2023 to 2033, By Country

    12.1. Historical Market Size Value (US$ Million) Trend Analysis By Market Taxonomy, 2018 to 2022

    12.2. Market Size Value (US$ Million) Forecast By Market Taxonomy, 2023 to 2033

        12.2.1. By Country

            12.2.1.1. China

            12.2.1.2. Japan

            12.2.1.3. South Korea

            12.2.1.4. Singapore

            12.2.1.5. Thailand

            12.2.1.6. Indonesia

            12.2.1.7. Australia

            12.2.1.8. New Zealand

            12.2.1.9. Rest of Asia Pacific

        12.2.2. By Material Type

        12.2.3. By Application

        12.2.4. By End-use

    12.3. Market Attractiveness Analysis

        12.3.1. By Country

        12.3.2. By Material Type

        12.3.3. By Application

        12.3.4. By End-use

    12.4. Key Takeaways

13. MEA Market Analysis 2018 to 2022 and Forecast 2023 to 2033, By Country

    13.1. Historical Market Size Value (US$ Million) Trend Analysis By Market Taxonomy, 2018 to 2022

    13.2. Market Size Value (US$ Million) Forecast By Market Taxonomy, 2023 to 2033

        13.2.1. By Country

            13.2.1.1. GCC Countries

            13.2.1.2. South Africa

            13.2.1.3. Israel

            13.2.1.4. Rest of Middle East and Africa(MEA)

        13.2.2. By Material Type

        13.2.3. By Application

        13.2.4. By End-use

    13.3. Market Attractiveness Analysis

        13.3.1. By Country

        13.3.2. By Material Type

        13.3.3. By Application

        13.3.4. By End-use

    13.4. Key Takeaways

14. Key Countries Market Analysis

    14.1. USA

        14.1.1. Pricing Analysis

        14.1.2. Market Share Analysis, 2021

            14.1.2.1. By Material Type

            14.1.2.2. By Application

            14.1.2.3. By End-use

    14.2. Canada

        14.2.1. Pricing Analysis

        14.2.2. Market Share Analysis, 2021

            14.2.2.1. By Material Type

            14.2.2.2. By Application

            14.2.2.3. By End-use

    14.3. Brazil

        14.3.1. Pricing Analysis

        14.3.2. Market Share Analysis, 2021

            14.3.2.1. By Material Type

            14.3.2.2. By Application

            14.3.2.3. By End-use

    14.4. Mexico

        14.4.1. Pricing Analysis

        14.4.2. Market Share Analysis, 2021

            14.4.2.1. By Material Type

            14.4.2.2. By Application

            14.4.2.3. By End-use

    14.5. Germany

        14.5.1. Pricing Analysis

        14.5.2. Market Share Analysis, 2021

            14.5.2.1. By Material Type

            14.5.2.2. By Application

            14.5.2.3. By End-use

    14.6. United Kingdom

        14.6.1. Pricing Analysis

        14.6.2. Market Share Analysis, 2021

            14.6.2.1. By Material Type

            14.6.2.2. By Application

            14.6.2.3. By End-use

    14.7. France

        14.7.1. Pricing Analysis

        14.7.2. Market Share Analysis, 2021

            14.7.2.1. By Material Type

            14.7.2.2. By Application

            14.7.2.3. By End-use

    14.8. Spain

        14.8.1. Pricing Analysis

        14.8.2. Market Share Analysis, 2021

            14.8.2.1. By Material Type

            14.8.2.2. By Application

            14.8.2.3. By End-use

    14.9. Italy

        14.9.1. Pricing Analysis

        14.9.2. Market Share Analysis, 2021

            14.9.2.1. By Material Type

            14.9.2.2. By Application

            14.9.2.3. By End-use

    14.10. China

        14.10.1. Pricing Analysis

        14.10.2. Market Share Analysis, 2021

            14.10.2.1. By Material Type

            14.10.2.2. By Application

            14.10.2.3. By End-use

    14.11. Japan

        14.11.1. Pricing Analysis

        14.11.2. Market Share Analysis, 2021

            14.11.2.1. By Material Type

            14.11.2.2. By Application

            14.11.2.3. By End-use

    14.12. South Korea

        14.12.1. Pricing Analysis

        14.12.2. Market Share Analysis, 2021

            14.12.2.1. By Material Type

            14.12.2.2. By Application

            14.12.2.3. By End-use

    14.13. Singapore

        14.13.1. Pricing Analysis

        14.13.2. Market Share Analysis, 2021

            14.13.2.1. By Material Type

            14.13.2.2. By Application

            14.13.2.3. By End-use

    14.14. Thailand

        14.14.1. Pricing Analysis

        14.14.2. Market Share Analysis, 2021

            14.14.2.1. By Material Type

            14.14.2.2. By Application

            14.14.2.3. By End-use

    14.15. Indonesia

        14.15.1. Pricing Analysis

        14.15.2. Market Share Analysis, 2021

            14.15.2.1. By Material Type

            14.15.2.2. By Application

            14.15.2.3. By End-use

    14.16. Australia

        14.16.1. Pricing Analysis

        14.16.2. Market Share Analysis, 2021

            14.16.2.1. By Material Type

            14.16.2.2. By Application

            14.16.2.3. By End-use

    14.17. New Zealand

        14.17.1. Pricing Analysis

        14.17.2. Market Share Analysis, 2021

            14.17.2.1. By Material Type

            14.17.2.2. By Application

            14.17.2.3. By End-use

    14.18. GCC Countries

        14.18.1. Pricing Analysis

        14.18.2. Market Share Analysis, 2021

            14.18.2.1. By Material Type

            14.18.2.2. By Application

            14.18.2.3. By End-use

    14.19. South Africa

        14.19.1. Pricing Analysis

        14.19.2. Market Share Analysis, 2021

            14.19.2.1. By Material Type

            14.19.2.2. By Application

            14.19.2.3. By End-use

    14.20. Israel

        14.20.1. Pricing Analysis

        14.20.2. Market Share Analysis, 2021

            14.20.2.1. By Material Type

            14.20.2.2. By Application

            14.20.2.3. By End-use

15. Market Structure Analysis

    15.1. Competition Dashboard

    15.2. Competition Benchmarking

    15.3. Market Share Analysis of Top Players

        15.3.1. By Regional

        15.3.2. By Material Type

        15.3.3. By Application

        15.3.4. By End-use

16. Competition Analysis

    16.1. Competition Deep Dive

        16.1.1. DENTSPLY Sirona

            16.1.1.1. Overview

            16.1.1.2. Product Portfolio

            16.1.1.3. Profitability by Market Segments

            16.1.1.4. Sales Footprint

            16.1.1.5. Strategy Overview

                16.1.1.5.1. Marketing Strategy

        16.1.2. Institut Straumann

            16.1.2.1. Overview

            16.1.2.2. Product Portfolio

            16.1.2.3. Profitability by Market Segments

            16.1.2.4. Sales Footprint

            16.1.2.5. Strategy Overview

                16.1.2.5.1. Marketing Strategy

        16.1.3. Zimmer Biomet

            16.1.3.1. Overview

            16.1.3.2. Product Portfolio

            16.1.3.3. Profitability by Market Segments

            16.1.3.4. Sales Footprint

            16.1.3.5. Strategy Overview

                16.1.3.5.1. Marketing Strategy

        16.1.4. Ivoclar Vivadent

            16.1.4.1. Overview

            16.1.4.2. Product Portfolio

            16.1.4.3. Profitability by Market Segments

            16.1.4.4. Sales Footprint

            16.1.4.5. Strategy Overview

                16.1.4.5.1. Marketing Strategy

        16.1.5. aap Implantate AG

            16.1.5.1. Overview

            16.1.5.2. Product Portfolio

            16.1.5.3. Profitability by Market Segments

            16.1.5.4. Sales Footprint

            16.1.5.5. Strategy Overview

                16.1.5.5.1. Marketing Strategy

        16.1.6. Heraeus Kulzer

            16.1.6.1. Overview

            16.1.6.2. Product Portfolio

            16.1.6.3. Profitability by Market Segments

            16.1.6.4. Sales Footprint

            16.1.6.5. Strategy Overview

                16.1.6.5.1. Marketing Strategy

        16.1.7. BioHorizons IPH

            16.1.7.1. Overview

            16.1.7.2. Product Portfolio

            16.1.7.3. Profitability by Market Segments

            16.1.7.4. Sales Footprint

            16.1.7.5. Strategy Overview

                16.1.7.5.1. Marketing Strategy

        16.1.8. 3M

            16.1.8.1. Overview

            16.1.8.2. Product Portfolio

            16.1.8.3. Profitability by Market Segments

            16.1.8.4. Sales Footprint

            16.1.8.5. Strategy Overview

                16.1.8.5.1. Marketing Strategy

        16.1.9. Danaher Corporation

            16.1.9.1. Overview

            16.1.9.2. Product Portfolio

            16.1.9.3. Profitability by Market Segments

            16.1.9.4. Sales Footprint

            16.1.9.5. Strategy Overview

                16.1.9.5.1. Marketing Strategy

        16.1.10. Biotronik

            16.1.10.1. Overview

            16.1.10.2. Product Portfolio

            16.1.10.3. Profitability by Market Segments

            16.1.10.4. Sales Footprint

            16.1.10.5. Strategy Overview

                16.1.10.5.1. Marketing Strategy

17. Assumptions & Acronyms Used

18. Research Methodology

List of Tables

Table 1: Global Market Value (US$ Million) Forecast by Region, 2018 to 2033

Table 2: Global Market Value (US$ Million) Forecast by Material Type, 2018 to 2033

Table 3: Global Market Value (US$ Million) Forecast by Application, 2018 to 2033

Table 4: Global Market Value (US$ Million) Forecast by End-use, 2018 to 2033

Table 5: North America Market Value (US$ Million) Forecast by Country, 2018 to 2033

Table 6: North America Market Value (US$ Million) Forecast by Material Type, 2018 to 2033

Table 7: North America Market Value (US$ Million) Forecast by Application, 2018 to 2033

Table 8: North America Market Value (US$ Million) Forecast by End-use, 2018 to 2033

Table 9: Latin America Market Value (US$ Million) Forecast by Country, 2018 to 2033

Table 10: Latin America Market Value (US$ Million) Forecast by Material Type, 2018 to 2033

Table 11: Latin America Market Value (US$ Million) Forecast by Application, 2018 to 2033

Table 12: Latin America Market Value (US$ Million) Forecast by End-use, 2018 to 2033

Table 13: Europe Market Value (US$ Million) Forecast by Country, 2018 to 2033

Table 14: Europe Market Value (US$ Million) Forecast by Material Type, 2018 to 2033

Table 15: Europe Market Value (US$ Million) Forecast by Application, 2018 to 2033

Table 16: Europe Market Value (US$ Million) Forecast by End-use, 2018 to 2033

Table 17: Asia Pacific Market Value (US$ Million) Forecast by Country, 2018 to 2033

Table 18: Asia Pacific Market Value (US$ Million) Forecast by Material Type, 2018 to 2033

Table 19: Asia Pacific Market Value (US$ Million) Forecast by Application, 2018 to 2033

Table 20: Asia Pacific Market Value (US$ Million) Forecast by End-use, 2018 to 2033

Table 21: MEA Market Value (US$ Million) Forecast by Country, 2018 to 2033

Table 22: MEA Market Value (US$ Million) Forecast by Material Type, 2018 to 2033

Table 23: MEA Market Value (US$ Million) Forecast by Application, 2018 to 2033

Table 24: MEA Market Value (US$ Million) Forecast by End-use, 2018 to 2033

List of Charts

Figure 1: Global Market Value (US$ Million) by Material Type, 2023 to 2033

Figure 2: Global Market Value (US$ Million) by Application, 2023 to 2033

Figure 3: Global Market Value (US$ Million) by End-use, 2023 to 2033

Figure 4: Global Market Value (US$ Million) by Region, 2023 to 2033

Figure 5: Global Market Value (US$ Million) Analysis by Region, 2018 to 2033

Figure 6: Global Market Value Share (%) and BPS Analysis by Region, 2023 to 2033

Figure 7: Global Market Y-o-Y Growth (%) Projections by Region, 2023 to 2033

Figure 8: Global Market Value (US$ Million) Analysis by Material Type, 2018 to 2033

Figure 9: Global Market Value Share (%) and BPS Analysis by Material Type, 2023 to 2033

Figure 10: Global Market Y-o-Y Growth (%) Projections by Material Type, 2023 to 2033

Figure 11: Global Market Value (US$ Million) Analysis by Application, 2018 to 2033

Figure 12: Global Market Value Share (%) and BPS Analysis by Application, 2023 to 2033

Figure 13: Global Market Y-o-Y Growth (%) Projections by Application, 2023 to 2033

Figure 14: Global Market Value (US$ Million) Analysis by End-use, 2018 to 2033

Figure 15: Global Market Value Share (%) and BPS Analysis by End-use, 2023 to 2033

Figure 16: Global Market Y-o-Y Growth (%) Projections by End-use, 2023 to 2033

Figure 17: Global Market Attractiveness by Material Type, 2023 to 2033

Figure 18: Global Market Attractiveness by Application, 2023 to 2033

Figure 19: Global Market Attractiveness by End-use, 2023 to 2033

Figure 20: Global Market Attractiveness by Region, 2023 to 2033

Figure 21: North America Market Value (US$ Million) by Material Type, 2023 to 2033

Figure 22: North America Market Value (US$ Million) by Application, 2023 to 2033

Figure 23: North America Market Value (US$ Million) by End-use, 2023 to 2033

Figure 24: North America Market Value (US$ Million) by Country, 2023 to 2033

Figure 25: North America Market Value (US$ Million) Analysis by Country, 2018 to 2033

Figure 26: North America Market Value Share (%) and BPS Analysis by Country, 2023 to 2033

Figure 27: North America Market Y-o-Y Growth (%) Projections by Country, 2023 to 2033

Figure 28: North America Market Value (US$ Million) Analysis by Material Type, 2018 to 2033

Figure 29: North America Market Value Share (%) and BPS Analysis by Material Type, 2023 to 2033

Figure 30: North America Market Y-o-Y Growth (%) Projections by Material Type, 2023 to 2033

Figure 31: North America Market Value (US$ Million) Analysis by Application, 2018 to 2033

Figure 32: North America Market Value Share (%) and BPS Analysis by Application, 2023 to 2033

Figure 33: North America Market Y-o-Y Growth (%) Projections by Application, 2023 to 2033

Figure 34: North America Market Value (US$ Million) Analysis by End-use, 2018 to 2033

Figure 35: North America Market Value Share (%) and BPS Analysis by End-use, 2023 to 2033

Figure 36: North America Market Y-o-Y Growth (%) Projections by End-use, 2023 to 2033

Figure 37: North America Market Attractiveness by Material Type, 2023 to 2033

Figure 38: North America Market Attractiveness by Application, 2023 to 2033

Figure 39: North America Market Attractiveness by End-use, 2023 to 2033

Figure 40: North America Market Attractiveness by Country, 2023 to 2033

Figure 41: Latin America Market Value (US$ Million) by Material Type, 2023 to 2033

Figure 42: Latin America Market Value (US$ Million) by Application, 2023 to 2033

Figure 43: Latin America Market Value (US$ Million) by End-use, 2023 to 2033

Figure 44: Latin America Market Value (US$ Million) by Country, 2023 to 2033

Figure 45: Latin America Market Value (US$ Million) Analysis by Country, 2018 to 2033

Figure 46: Latin America Market Value Share (%) and BPS Analysis by Country, 2023 to 2033

Figure 47: Latin America Market Y-o-Y Growth (%) Projections by Country, 2023 to 2033

Figure 48: Latin America Market Value (US$ Million) Analysis by Material Type, 2018 to 2033

Figure 49: Latin America Market Value Share (%) and BPS Analysis by Material Type, 2023 to 2033

Figure 50: Latin America Market Y-o-Y Growth (%) Projections by Material Type, 2023 to 2033

Figure 51: Latin America Market Value (US$ Million) Analysis by Application, 2018 to 2033

Figure 52: Latin America Market Value Share (%) and BPS Analysis by Application, 2023 to 2033

Figure 53: Latin America Market Y-o-Y Growth (%) Projections by Application, 2023 to 2033

Figure 54: Latin America Market Value (US$ Million) Analysis by End-use, 2018 to 2033

Figure 55: Latin America Market Value Share (%) and BPS Analysis by End-use, 2023 to 2033

Figure 56: Latin America Market Y-o-Y Growth (%) Projections by End-use, 2023 to 2033

Figure 57: Latin America Market Attractiveness by Material Type, 2023 to 2033

Figure 58: Latin America Market Attractiveness by Application, 2023 to 2033

Figure 59: Latin America Market Attractiveness by End-use, 2023 to 2033

Figure 60: Latin America Market Attractiveness by Country, 2023 to 2033

Figure 61: Europe Market Value (US$ Million) by Material Type, 2023 to 2033

Figure 62: Europe Market Value (US$ Million) by Application, 2023 to 2033

Figure 63: Europe Market Value (US$ Million) by End-use, 2023 to 2033

Figure 64: Europe Market Value (US$ Million) by Country, 2023 to 2033

Figure 65: Europe Market Value (US$ Million) Analysis by Country, 2018 to 2033

Figure 66: Europe Market Value Share (%) and BPS Analysis by Country, 2023 to 2033

Figure 67: Europe Market Y-o-Y Growth (%) Projections by Country, 2023 to 2033

Figure 68: Europe Market Value (US$ Million) Analysis by Material Type, 2018 to 2033

Figure 69: Europe Market Value Share (%) and BPS Analysis by Material Type, 2023 to 2033

Figure 70: Europe Market Y-o-Y Growth (%) Projections by Material Type, 2023 to 2033

Figure 71: Europe Market Value (US$ Million) Analysis by Application, 2018 to 2033

Figure 72: Europe Market Value Share (%) and BPS Analysis by Application, 2023 to 2033

Figure 73: Europe Market Y-o-Y Growth (%) Projections by Application, 2023 to 2033

Figure 74: Europe Market Value (US$ Million) Analysis by End-use, 2018 to 2033

Figure 75: Europe Market Value Share (%) and BPS Analysis by End-use, 2023 to 2033

Figure 76: Europe Market Y-o-Y Growth (%) Projections by End-use, 2023 to 2033

Figure 77: Europe Market Attractiveness by Material Type, 2023 to 2033

Figure 78: Europe Market Attractiveness by Application, 2023 to 2033

Figure 79: Europe Market Attractiveness by End-use, 2023 to 2033

Figure 80: Europe Market Attractiveness by Country, 2023 to 2033

Figure 81: Asia Pacific Market Value (US$ Million) by Material Type, 2023 to 2033

Figure 82: Asia Pacific Market Value (US$ Million) by Application, 2023 to 2033

Figure 83: Asia Pacific Market Value (US$ Million) by End-use, 2023 to 2033

Figure 84: Asia Pacific Market Value (US$ Million) by Country, 2023 to 2033

Figure 85: Asia Pacific Market Value (US$ Million) Analysis by Country, 2018 to 2033

Figure 86: Asia Pacific Market Value Share (%) and BPS Analysis by Country, 2023 to 2033

Figure 87: Asia Pacific Market Y-o-Y Growth (%) Projections by Country, 2023 to 2033

Figure 88: Asia Pacific Market Value (US$ Million) Analysis by Material Type, 2018 to 2033

Figure 89: Asia Pacific Market Value Share (%) and BPS Analysis by Material Type, 2023 to 2033

Figure 90: Asia Pacific Market Y-o-Y Growth (%) Projections by Material Type, 2023 to 2033

Figure 91: Asia Pacific Market Value (US$ Million) Analysis by Application, 2018 to 2033

Figure 92: Asia Pacific Market Value Share (%) and BPS Analysis by Application, 2023 to 2033

Figure 93: Asia Pacific Market Y-o-Y Growth (%) Projections by Application, 2023 to 2033

Figure 94: Asia Pacific Market Value (US$ Million) Analysis by End-use, 2018 to 2033

Figure 95: Asia Pacific Market Value Share (%) and BPS Analysis by End-use, 2023 to 2033

Figure 96: Asia Pacific Market Y-o-Y Growth (%) Projections by End-use, 2023 to 2033

Figure 97: Asia Pacific Market Attractiveness by Material Type, 2023 to 2033

Figure 98: Asia Pacific Market Attractiveness by Application, 2023 to 2033

Figure 99: Asia Pacific Market Attractiveness by End-use, 2023 to 2033

Figure 100: Asia Pacific Market Attractiveness by Country, 2023 to 2033

Figure 101: MEA Market Value (US$ Million) by Material Type, 2023 to 2033

Figure 102: MEA Market Value (US$ Million) by Application, 2023 to 2033

Figure 103: MEA Market Value (US$ Million) by End-use, 2023 to 2033

Figure 104: MEA Market Value (US$ Million) by Country, 2023 to 2033

Figure 105: MEA Market Value (US$ Million) Analysis by Country, 2018 to 2033

Figure 106: MEA Market Value Share (%) and BPS Analysis by Country, 2023 to 2033

Figure 107: MEA Market Y-o-Y Growth (%) Projections by Country, 2023 to 2033

Figure 108: MEA Market Value (US$ Million) Analysis by Material Type, 2018 to 2033

Figure 109: MEA Market Value Share (%) and BPS Analysis by Material Type, 2023 to 2033

Figure 110: MEA Market Y-o-Y Growth (%) Projections by Material Type, 2023 to 2033

Figure 111: MEA Market Value (US$ Million) Analysis by Application, 2018 to 2033

Figure 112: MEA Market Value Share (%) and BPS Analysis by Application, 2023 to 2033

Figure 113: MEA Market Y-o-Y Growth (%) Projections by Application, 2023 to 2033

Figure 114: MEA Market Value (US$ Million) Analysis by End-use, 2018 to 2033

Figure 115: MEA Market Value Share (%) and BPS Analysis by End-use, 2023 to 2033

Figure 116: MEA Market Y-o-Y Growth (%) Projections by End-use, 2023 to 2033

Figure 117: MEA Market Attractiveness by Material Type, 2023 to 2033

Figure 118: MEA Market Attractiveness by Application, 2023 to 2033

Figure 119: MEA Market Attractiveness by End-use, 2023 to 2033

Figure 120: MEA Market Attractiveness by Country, 2023 to 2033

Recommendations

Healthcare

Dental Imaging Equipment Market

Published : February 2024

Healthcare

Teledentistry Market

Published : November 2022

Healthcare

Dental Flap Surgery Market

Published : November 2022

Healthcare

Dental Diagnostic and Surgical Equipment Market

Published : September 2022

Explore Healthcare Insights

View Reports