Next Generation Packaging Market Size and Share Forecast Outlook 2025 to 2035

The next generation packaging market is set to grow from USD 14.5 billion in 2025 to USD 27 billion by 2035, registering a CAGR of 6.4% during the forecast period.
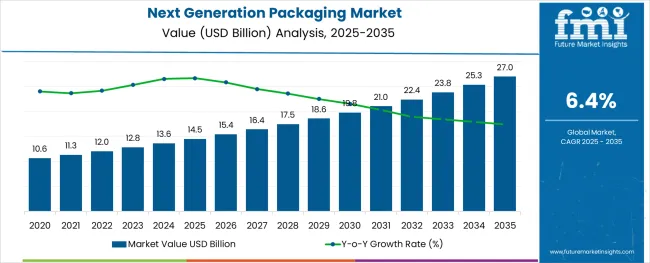
Quick Stats in Next Generation Packaging Market

  • Next Generation Packaging Market Size (2025): USD 14.5 billion
  • Projected Next Generation Packaging Market (2035): USD 27 billion
  • Forecast CAGR of Next Generation Packaging Market (2025 to 2035): 6.4%
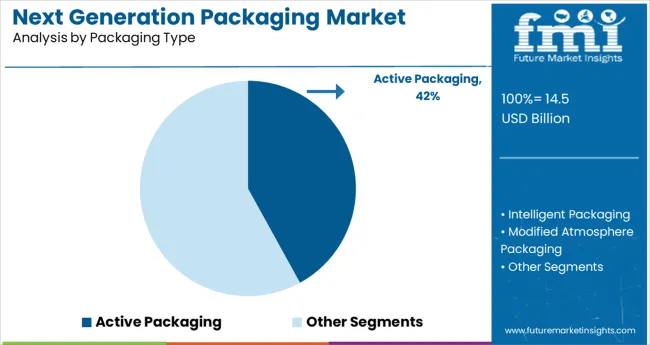
  • Leading Segment by Packaging Type of Next Generation Packaging Market (2025): Active Packaging (42%)
  • Fastest Growing Country in Next Generation Packaging Market (2025): South Korea (6.4% CAGR)
  • Top Key Players in Next Generation Packaging Market: Amcor plc, Avery Dennison Corporation, Sealed Air Corporation, Stora Enso, BASF SE

Next Generation Packaging Market

Metric Value
Industry Size (2025E) USD 14.5 billion
Industry Value (2035F) USD 27 billion
CAGR (2025 to 2035) 6.4%

Smart packaging solutions equipped with sensors and embedded data chips are being used to monitor freshness, improve shelf-life, and reduce spoilage, particularly in temperature-sensitive segments like pharmaceuticals and fresh produce.

Global adoption of connected packaging in food and beverage manufacturing has grown by over 60% in the last five years as firms seek real-time inventory tracking and anti-counterfeit assurance.

The demand for compostable and biodegradable materials is accelerating as regulations tighten on single-use plastics, especially in the EU and North America. In Asia Pacific, market expansion is driven by the need for durable transit packaging in high-growth e-commerce sectors.

Automation in packaging lines is also rising, with deployment of robotic systems improving throughput by 30% in several tier-one manufacturing hubs. The market is evolving from cost-efficiency to value-enhancing design that integrates intelligence into every layer.

The next generation packaging market is carving out a unique space across multiple high-value verticals. Within the USD 1.2 trillion global packaging industry, future-forward formats such as active, smart, and sustainable packaging hold a 6-8% share, supported by rising demand for shelf-life extension and traceability.

In the USD 3.5 trillion food and beverage industry, 10-12% of packaging innovation budgets are now funneled into intelligent solutions like time-temperature indicators and freshness sensors. Pharmaceuticals allocate 8-10% of their packaging spend to tamper-proof and interactive technologies that support patient safety.

The e-commerce players are integrating smart tracking features into 5-7% of their parcels to improve supply chain transparency. Even in the USD 300 billion eco-packaging segment, 6-9% is dedicated to circular-ready next-gen designs.

Analyzing Next Generation Packaging Market by Top Investment Segments

The next generation packaging market is gaining momentum through active packaging innovations and strong demand from the food and beverage sector. Growth is fueled by evolving consumer preferences, safety regulations, and the rise of intelligent, eco-conscious packaging formats.
Active Packaging Leads the Innovation Wave in Next Generation Packaging

Next Generation Packaging Market Analysis By Packaging Type

Active packaging is anticipated to hold a 42% market share by 2025, emerging as the top-performing segment. This packaging type enhances shelf life, quality, and safety by interacting directly with the contents or environment inside the package. The segment is being propelled by advancements in oxygen scavengers, antimicrobial layers, and moisture control systems.
  • Rising demand for extended shelf stability in fresh produce and meat supports adoption.
  • Brands are deploying smart packaging with real-time freshness indicators.
  • Innovation in nanomaterials and sustainable active barriers is accelerating product development cycles.

Food and Beverages Application Dominates Consumer-Centric Packaging Trends

Next Generation Packaging Market Analysis By Application

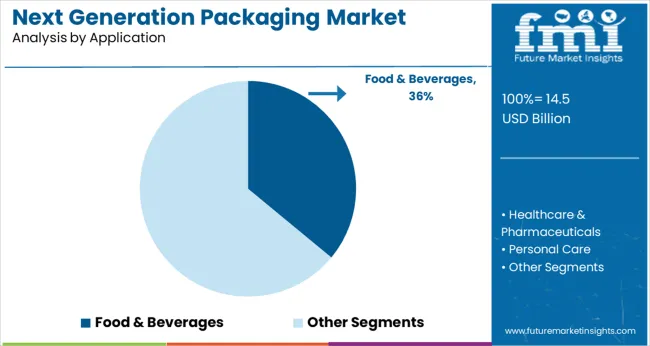
The food and beverages segment is projected to account for 36% of the next generation packaging market by 2025. Growing consumer demand for freshness, convenience, and safety is transforming packaging strategies across the F&B industry. Functional packaging designs are gaining traction for ready-to-eat meals, functional drinks, and organic produce.

  • Retailers are embracing QR-coded packaging for traceability and nutritional transparency.
  • High-performance films and biodegradable containers are replacing conventional plastic formats.
  • Evolving regulatory standards in North America and Europe encourage safe, recyclable F&B packaging formats.

Top Next Generation Packaging Market Dynamics

Next generation packaging is accelerating through integration of freshness indicators, QR-enabled traceability, and smart barrier technologies. Active and intelligent packaging formats are reshaping supply chain visibility, especially in perishable food and pharma.

Smart Label Adoption Transforms Cold Chain Monitoring

Sales of smart labels with time-temperature indicators (TTIs) grew 43% YoY, driven by perishables and vaccine logistics. Retailers using irreversible TTIs on meat products saw spoilage-related returns drop by 28%. QR-based labels integrated with cold chain platforms improved traceability scan rates by 36% at final delivery. Pharmaceutical exporters using NFC-enabled tags reduced temperature excursion incidents by 21%. End-users receiving dynamic freshness alerts via mobile apps increased engagement by 31%, boosting brand loyalty. As regulatory frameworks tighten around pharmaceutical stability and food safety, smart packaging adoption is expanding into mid-tier brands, supported by scalable SaaS platforms and lower per-unit sensor costs.

Antimicrobial Films Reduce Spoilage Across Fresh Produce

Use of antimicrobial active packaging films in fresh-cut fruits and vegetables expanded 39% in 2025. Supermarkets deploying silver-ion infused trays reported a 22% extension in shelf life and 19% reduction in visual decay. Modified atmosphere packs (MAP) incorporating active oxygen scavengers achieved spoilage rate reductions of up to 26% in leafy greens. Trial rollouts in Latin America and Southeast Asia led to a 34% drop in post-distribution waste at retail. Recyclable antimicrobial pouches gained traction among exporters, with 18% higher acceptance in EU customs due to enhanced hygiene claims. These performance gains are driving ROI-focused upgrades in produce packaging lines.
Top Countries Designing, Engineering, Distributing, and Implementing Next Generation Packaging

Country Wise Analysis Of Next Generation Packaging Market

Country CAGR (2025-2035)
South Korea 6.4%
United Kingdom 6.2%
United States 6.1%
Japan 5.9%

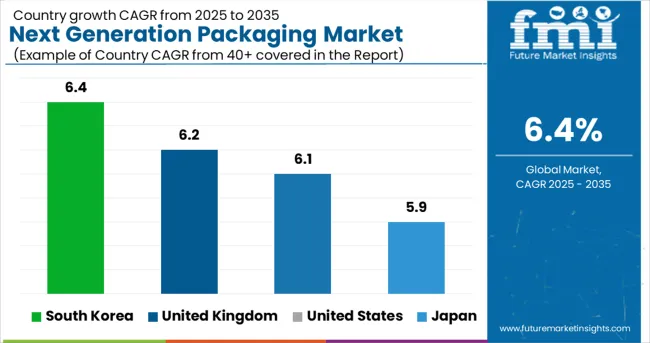
The global market for next generation packaging is expected to grow at a CAGR of 6.4% between 2025 and 2035. South Korea mirrors this global average at 6.4%, supported by strong investments in smart labeling technologies and active packaging systems across the food and pharma sectors.

The United Kingdom follows closely with a 6.2% CAGR, driven by rising sustainability mandates and demand for recyclable, intelligent packaging in consumer goods. The United States reports a 6.1% CAGR, with companies expanding automation and IoT-integrated packaging lines.

Japan’s CAGR stands at 5.9%, just below the global mark, as aging population trends push for increased adoption of easy-to-open and tamper-evident designs. While the OECD countries continue to shape the market with regulatory innovation and advanced R&D capabilities, growth in BRICS and ASEAN regions is expected to intensify post-2030 as infrastructure for smart packaging continues to mature.

The report provides insights across 40+ countries. The four below are highlighted for their strategic influence and growth trajectory.

Demand Outlook for Next Generation Packaging Market in South Korea

Registering a CAGR of 6.4% through 2035, South Korea is emerging as a leader in next generation packaging innovation. From 2020 to 2024, adoption was primarily driven by the cosmetics and consumer electronics sectors. The rapid expansion in smart retail and cold chain logistics is now increasing demand for active and intelligent packaging solutions. Korean tech firms are investing in embedded sensors and NFC-based tracking in packaging.

  • Government funding supports smart packaging R&D under digital economy plans
  • Cosmetic brands shifting to anti-contamination and freshness-indicator designs
  • Cold-chain food exports fueling adoption of temperature-sensitive packaging

Innovation Trends in the Next Generation Packaging Market in the United Kingdom

Expected to grow at a CAGR of 6.2% between 2025 and 2035, the UK market is undergoing a transformation in packaging sustainability. The 2020–2024 period saw a rise in recyclable and compostable materials, driven by retail compliance mandates. Looking ahead, food and beverage brands are incorporating intelligent labelling, oxygen scavengers, and antimicrobial layers to extend shelf life and reduce waste.

  • Major grocers adopting smart labels for real-time freshness tracking
  • FMCG brands deploying QR-coded packaging to improve customer engagement
  • Packaging tax reform accelerating innovation in material recovery systems

Strategic Growth of Next Generation Packaging Market in the United States

The US market is projected to grow at a CAGR of 6.1% through 2035, evolving from the early-stage adoption observed between 2020 and 2024. Growth is now propelled by increasing investment in automation and supply chain traceability across food, healthcare, and e-commerce sectors. Sensor-enabled packaging, RFID tagging, and tamper-evident technologies are gaining traction.

  • E-commerce logistics hubs adopting smart packaging to reduce returns
  • Pharma firms integrating humidity-control solutions in blister packaging
  • USDA-backed pilots exploring intelligent food traceability packaging

Emerging Applications for Next Generation Packaging Market in Japan

Japan is forecast to expand at a CAGR of 5.9% over the next decade. From 2020 to 2024, limited consumer engagement with smart packaging hindered growth, but momentum is building as convenience store chains adopt traceability and freshness monitoring systems. Emphasis is being placed on packaging that balances minimalism with embedded intelligence.
  • Leading convenience chains piloting freshness-indicator smart films
  • Tech-enabled packaging designs optimizing logistics in high-density cities
  • Consumer electronics sector adopting active packaging to prevent component corrosion

Leading Next-Generation Packaging Suppliers

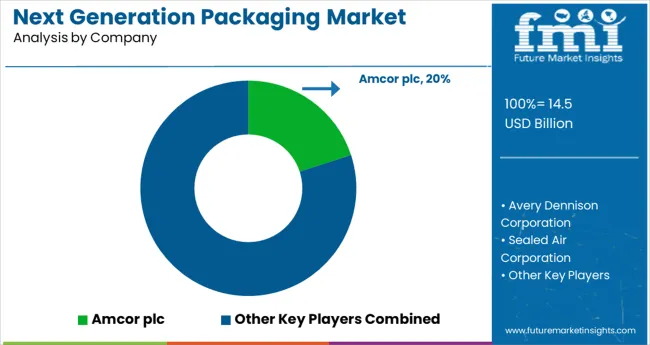
Next Generation Packaging Market Analysis By Company

The next-generation packaging market is moderately consolidated, with innovation-driven leaders shaping the competitive landscape. Amcor plc holds the top position with an estimated 20% global market share, driven by its breakthrough bio-based and recyclable polymer solutions integrated into food and medical packaging.

Avery Dennison and Sealed Air each capture approximately 12%, leveraging smart-label technologies and barrier-pack formats favored in retail and e-commerce. Stora Enso and Smurfit Kappa command about 10% combined in paper-based sustainable packaging, emphasizing fiber-based alternatives.

BASF SE and Storopack specialize in advanced foam and insulated packaging for temperature-sensitive shipments, together holding close to 8%. EcoEnclose, PolyPak, and Fluence Automation serve niche segments with compostable, low-carbon, and automation-enabled systems, respectively.

Recent Next-Generation Packaging Industry News

In November 2024, Amcor announced a stock‑only merger with Berry Global valued at USD 8.4 billion. The combined company, Amcor plc, expects USD 650 million in annual synergies by 2028 and aims to scale its consumer, healthcare, and sustainable packaging offerings significantly.

Leading Players in Next-Generation Packaging Market

  • Amcor plc
  • Avery Dennison Corporation
  • Sealed Air Corporation
  • Stora Enso
  • BASF SE
  • Storopack
  • EcoEnclose
  • PolyPak Packaging
  • Smurfit Kappa
  • Fluence Automation

Report Coverage and Scope Summary

Report Attributes Details
Market Size (2025) USD 14.5 billion
Projected Market Size (2035) USD 27 billion
CAGR (2025 to 2035) 6.4%
Base Year for Estimation 2024
Historical Period 2020 to 2024
Projections Period 2025 to 2035
Quantitative Units USD billion for market value
Packaging Types Analyzed (Segment 1) Active Packaging (Antimicrobials, Gas Scavengers, Gas Emitters, Others), Intelligent Packaging (Sensors, Indicators, Tags), Modified Atmosphere Packaging
Applications Analyzed (Segment 2) Food & Beverages, Healthcare & Pharmaceuticals, Personal Care, Logistics & Supply Chain, Others (Automotive & Industrial)
Regions Covered North America, Latin America, East Asia, South Asia & Pacific, Eastern Europe, Western Europe, Middle East & Africa
Countries Covered United States, Canada, Germany, United Kingdom, France, Italy, Spain, China, India, Japan, South Korea, Australia, Brazil, Mexico, Argentina, Saudi Arabia, UAE, South Africa
Key Players Amcor plc, Avery Dennison Corporation, Sealed Air Corporation, Stora Enso, BASF SE, Storopack , EcoEnclose , PolyPak Packaging, Smurfit Kappa, Fluence Automation
Additional Attributes Dollar sales by packaging type and application, rapid adoption of smart tracking solutions, increased demand for shelf-life extension technologies, and sustainability-driven innovations in intelligent and active packaging systems.

Key Segments

By Packaging Type:

Includes active packaging (antimicrobials, gas scavengers, gas emitters, others), intelligent packaging (sensors, indicators, tags), and modified atmosphere packaging.

By Application:

Applied in food & beverages, healthcare & pharmaceuticals, personal care, logistics & supply chain, and other sectors like automotive & industrial.

By Region:

Analyzed across North America, Latin America, East Asia, South Asia & Pacific, Eastern Europe, Western Europe, and the Middle East & Africa.

Table of Content

  1. Executive Summary
    • Global Market Outlook
    • Demand-side Trends
    • Supply-side Trends
    • Technology Roadmap Analysis
    • Analysis and Recommendations
  2. Market Overview
    • Market Coverage / Taxonomy
    • Market Definition / Scope / Limitations
  3. Market Background
    • Market Dynamics
      • Drivers
      • Restraints
      • Opportunity
      • Trends
    • Scenario Forecast
      • Demand in Optimistic Scenario
      • Demand in Likely Scenario
      • Demand in Conservative Scenario
    • Opportunity Map Analysis
    • Product Life Cycle Analysis
    • Supply Chain Analysis
      • Supply Side Participants and their Roles
        • Producers
        • Mid-Level Participants (Traders/ Agents/ Brokers)
        • Wholesalers and Distributors
      • Value Added and Value Created at Node in the Supply Chain
      • List of Raw Material Suppliers
      • List of Existing and Potential Buyer’s
    • Investment Feasibility Matrix
    • Value Chain Analysis
      • Profit Margin Analysis
      • Wholesalers and Distributors
      • Retailers
    • PESTLE and Porter’s Analysis
    • Regulatory Landscape
      • By Key Regions
      • By Key Countries
    • Regional Parent Market Outlook
    • Production and Consumption Statistics
    • Import and Export Statistics
  4. Global Market Analysis 2020-2024 and Forecast, 2025-2035
    • Historical Market Size Value (USD Billion) & Volume Analysis, 2020-2024
    • Current and Future Market Size Value (USD Billion) & Volume Projections, 2025-2035
      • Y-o-Y Growth Trend Analysis
      • Absolute $ Opportunity Analysis
  5. Global Market Pricing Analysis 2020-2024 and Forecast 2025-2035
  6. Global Market Analysis 2020-2024 and Forecast 2025-2035, By Packaging Type
    • Introduction / Key Findings
    • Historical Market Size Value (USD Billion) & Volume Analysis By Packaging Type, 2020-2024
    • Current and Future Market Size Value (USD Billion) & Volume Analysis and Forecast By Packaging Type, 2025-2035
      • Active Packaging
        • Antimicrobials
        • Gas Scavengers
        • Gas Emitters
        • Others (Moisture & Corrosion Control)
      • Intelligent Packaging
        • Sensors
        • Indicators
        • Tags
    • Y-o-Y Growth Trend Analysis By Packaging Type, 2020-2024
    • Absolute $ Opportunity Analysis By Packaging Type, 2025-2035
  7. Global Market Analysis 2020-2024 and Forecast 2025-2035, By Application
    • Introduction / Key Findings
    • Historical Market Size Value (USD Billion) & Volume Analysis By Application, 2020-2024
    • Current and Future Market Size Value (USD Billion) & Volume Analysis and Forecast By Application, 2025-2035
      • Food & Beverages
      • Healthcare & Pharmaceuticals
      • Personal Care
      • Logistics & Supply Chain
      • Others (Automotive & Industrial)
    • Y-o-Y Growth Trend Analysis By Application, 2020-2024
    • Absolute $ Opportunity Analysis By Application, 2025-2035
  8. Global Market Analysis 2020-2024 and Forecast 2025-2035, By Region
    • Introduction
    • Historical Market Size Value (USD Billion) & Volume Analysis By Region, 2020-2024
    • Current Market Size Value (USD Billion) & Volume Analysis and Forecast By Region, 2025-2035
      • North America
      • Latin America
      • Western Europe
      • Eastern Europe
      • East Asia
      • South Asia & Pacific
      • Middle East and Africa
    • Market Attractiveness Analysis By Region
  9. North America Market Analysis 2020-2024 and Forecast 2025-2035, By Country
    • Historical Market Size Value (USD Billion) & Volume Trend Analysis By Market Taxonomy, 2020-2024
    • Market Size Value (USD Billion) & Volume Forecast By Market Taxonomy, 2025-2035
      • By Country
        • USA
        • Canada
        • Mexico
      • By Packaging Type
      • By Application
    • Market Attractiveness Analysis
      • By Country
      • By Packaging Type
      • By Application
    • Key Takeaways
  10. Latin America Market Analysis 2020-2024 and Forecast 2025-2035, By Country
    • Historical Market Size Value (USD Billion) & Volume Trend Analysis By Market Taxonomy, 2020-2024
    • Market Size Value (USD Billion) & Volume Forecast By Market Taxonomy, 2025-2035
      • By Country
        • Brazil
        • Argentina
        • Rest of LATAM
      • By Packaging Type
      • By Application
    • Market Attractiveness Analysis
      • By Country
      • By Packaging Type
      • By Application
    • Key Takeaways
  11. Western Europe Market Analysis 2020-2024 and Forecast 2025-2035, By Country
    • Historical Market Size Value (USD Billion) & Volume Trend Analysis By Market Taxonomy, 2020-2024
    • Market Size Value (USD Billion) & Volume Forecast By Market Taxonomy, 2025-2035
      • By Country
        • Germany
        • Italy
        • France
        • UK
        • Spain
        • BENELUX
        • Nordic
        • Rest of W.Europe
      • By Packaging Type
      • By Application
    • Market Attractiveness Analysis
      • By Country
      • By Packaging Type
      • By Application
    • Key Takeaways
  12. Eastern Europe Market Analysis 2020-2024 and Forecast 2025-2035, By Country
    • Historical Market Size Value (USD Billion) & Volume Trend Analysis By Market Taxonomy, 2020-2024
    • Market Size Value (USD Billion) & Volume Forecast By Market Taxonomy, 2025-2035
      • By Country
        • Russia
        • Hungary
        • Poland
        • Balkan & Baltics
        • Rest of E. Europe
      • By Packaging Type
      • By Application
    • Market Attractiveness Analysis
      • By Country
      • By Packaging Type
      • By Application
    • Key Takeaways
  13. East Asia Market Analysis 2020-2024 and Forecast 2025-2035, By Country
    • Historical Market Size Value (USD Billion) & Volume Trend Analysis By Market Taxonomy, 2020-2024
    • Market Size Value (USD Billion) & Volume Forecast By Market Taxonomy, 2025-2035
      • By Country
        • China
        • Japan
        • South Korea
      • By Packaging Type
      • By Application
    • Market Attractiveness Analysis
      • By Country
      • By Packaging Type
      • By Application
    • Key Takeaways
  14. South Asia & Pacific Market Analysis 2020-2024 and Forecast 2025-2035, By Country
    • Historical Market Size Value (USD Billion) & Volume Trend Analysis By Market Taxonomy, 2020-2024
    • Market Size Value (USD Billion) & Volume Forecast By Market Taxonomy, 2025-2035
      • By Country
        • India
        • Australia & New Zealand
        • ASEAN
        • Rest of SAP
      • By Packaging Type
      • By Application
    • Market Attractiveness Analysis
      • By Country
      • By Packaging Type
      • By Application
    • Key Takeaways
  15. Middle East and Africa Market Analysis 2020-2024 and Forecast 2025-2035, By Country
    • Historical Market Size Value (USD Billion) & Volume Trend Analysis By Market Taxonomy, 2020-2024
    • Market Size Value (USD Billion) & Volume Forecast By Market Taxonomy, 2025-2035
      • By Country
        • GCC Countries
        • Northern Africa
        • South Africa
        • Turkiye
        • Rest of MEA
      • By Packaging Type
      • By Application
    • Market Attractiveness Analysis
      • By Country
      • By Packaging Type
      • By Application
    • Key Takeaways
  16. Key Countries Market Analysis
    • USA
      • Pricing Analysis
      • Market Share Analysis, 2024
        • By Packaging Type
        • By Application
    • Canada
      • Pricing Analysis
      • Market Share Analysis, 2024
        • By Packaging Type
        • By Application
    • Brazil
      • Pricing Analysis
      • Market Share Analysis, 2024
        • By Packaging Type
        • By Application
    • Mexico
      • Pricing Analysis
      • Market Share Analysis, 2024
        • By Packaging Type
        • By Application
    • Argentina
      • Pricing Analysis
      • Market Share Analysis, 2024
        • By Packaging Type
        • By Application
  17. Market Structure Analysis
    • Competition Dashboard
    • Competition Benchmarking
    • Market Share Analysis of Top Players
      • By Regional
      • By Packaging Type
      • By Application
  18. Competition Analysis
    • Competition Deep Dive
      • Amcor plc
        • Overview
        • Product Portfolio
        • Profitability by Market Segments (Product/Age /Sales Channel/Region)
        • Sales Footprint
        • Strategy Overview
          • Marketing Strategy
          • Product Strategy
          • Channel Strategy
      • Avery Dennison Corporation
        • Overview
        • Product Portfolio
        • Profitability by Market Segments (Product/Age /Sales Channel/Region)
        • Sales Footprint
        • Strategy Overview
          • Marketing Strategy
          • Product Strategy
          • Channel Strategy
      • Sealed Air Corporation
        • Overview
        • Product Portfolio
        • Profitability by Market Segments (Product/Age /Sales Channel/Region)
        • Sales Footprint
        • Strategy Overview
          • Marketing Strategy
          • Product Strategy
          • Channel Strategy
      • Stora Enso
        • Overview
        • Product Portfolio
        • Profitability by Market Segments (Product/Age /Sales Channel/Region)
        • Sales Footprint
        • Strategy Overview
          • Marketing Strategy
          • Product Strategy
          • Channel Strategy
      • BASF SE
        • Overview
        • Product Portfolio
        • Profitability by Market Segments (Product/Age /Sales Channel/Region)
        • Sales Footprint
        • Strategy Overview
          • Marketing Strategy
          • Product Strategy
          • Channel Strategy
      • Storopack
        • Overview
        • Product Portfolio
        • Profitability by Market Segments (Product/Age /Sales Channel/Region)
        • Sales Footprint
        • Strategy Overview
          • Marketing Strategy
          • Product Strategy
          • Channel Strategy
      • EcoEnclose
        • Overview
        • Product Portfolio
        • Profitability by Market Segments (Product/Age /Sales Channel/Region)
        • Sales Footprint
        • Strategy Overview
          • Marketing Strategy
          • Product Strategy
          • Channel Strategy
      • PolyPak Packaging
        • Overview
        • Product Portfolio
        • Profitability by Market Segments (Product/Age /Sales Channel/Region)
        • Sales Footprint
        • Strategy Overview
          • Marketing Strategy
          • Product Strategy
          • Channel Strategy
      • Smurfit Kappa
        • Overview
        • Product Portfolio
        • Profitability by Market Segments (Product/Age /Sales Channel/Region)
        • Sales Footprint
        • Strategy Overview
          • Marketing Strategy
          • Product Strategy
          • Channel Strategy
      • Fluence Automation
        • Overview
        • Product Portfolio
        • Profitability by Market Segments (Product/Age /Sales Channel/Region)
        • Sales Footprint
        • Strategy Overview
          • Marketing Strategy
          • Product Strategy
          • Channel Strategy
  19. Assumptions & Acronyms Used
  20. Research Methodology

List of Tables

  • Table 1: Global Market Value (USD Billion) Forecast by Region, 2020-2035
  • Table 2: Global Market Volume Forecast by Region, 2020-2035
  • Table 3: Global Market Value (USD Billion) Forecast by Packaging Type, 2020-2035
  • Table 4: Global Market Volume Forecast by Packaging Type, 2020-2035
  • Table 5: Global Market Value (USD Billion) Forecast by Application, 2020-2035
  • Table 6: Global Market Volume Forecast by Application, 2020-2035
  • Table 7: North America Market Value (USD Billion) Forecast by Country, 2020-2035
  • Table 8: North America Market Volume Forecast by Country, 2020-2035
  • Table 9: North America Market Value (USD Billion) Forecast by Packaging Type, 2020-2035
  • Table 10: North America Market Volume Forecast by Packaging Type, 2020-2035
  • Table 11: North America Market Value (USD Billion) Forecast by Application, 2020-2035
  • Table 12: North America Market Volume Forecast by Application, 2020-2035
  • Table 13: Latin America Market Value (USD Billion) Forecast by Country, 2020-2035
  • Table 14: Latin America Market Volume Forecast by Country, 2020-2035
  • Table 15: Latin America Market Value (USD Billion) Forecast by Packaging Type, 2020-2035
  • Table 16: Latin America Market Volume Forecast by Packaging Type, 2020-2035
  • Table 17: Latin America Market Value (USD Billion) Forecast by Application, 2020-2035
  • Table 18: Latin America Market Volume Forecast by Application, 2020-2035
  • Table 19: Western Europe Market Value (USD Billion) Forecast by Country, 2020-2035
  • Table 20: Western Europe Market Volume Forecast by Country, 2020-2035
  • Table 21: Western Europe Market Value (USD Billion) Forecast by Packaging Type, 2020-2035
  • Table 22: Western Europe Market Volume Forecast by Packaging Type, 2020-2035
  • Table 23: Western Europe Market Value (USD Billion) Forecast by Application, 2020-2035
  • Table 24: Western Europe Market Volume Forecast by Application, 2020-2035
  • Table 25: Eastern Europe Market Value (USD Billion) Forecast by Country, 2020-2035
  • Table 26: Eastern Europe Market Volume Forecast by Country, 2020-2035
  • Table 27: Eastern Europe Market Value (USD Billion) Forecast by Packaging Type, 2020-2035
  • Table 28: Eastern Europe Market Volume Forecast by Packaging Type, 2020-2035
  • Table 29: Eastern Europe Market Value (USD Billion) Forecast by Application, 2020-2035
  • Table 30: Eastern Europe Market Volume Forecast by Application, 2020-2035
  • Table 31: East Asia Market Value (USD Billion) Forecast by Country, 2020-2035
  • Table 32: East Asia Market Volume Forecast by Country, 2020-2035
  • Table 33: East Asia Market Value (USD Billion) Forecast by Packaging Type, 2020-2035
  • Table 34: East Asia Market Volume Forecast by Packaging Type, 2020-2035
  • Table 35: East Asia Market Value (USD Billion) Forecast by Application, 2020-2035
  • Table 36: East Asia Market Volume Forecast by Application, 2020-2035
  • Table 37: South Asia & Pacific Market Value (USD Billion) Forecast by Country, 2020-2035
  • Table 38: South Asia & Pacific Market Volume Forecast by Country, 2020-2035
  • Table 39: South Asia & Pacific Market Value (USD Billion) Forecast by Packaging Type, 2020-2035
  • Table 40: South Asia & Pacific Market Volume Forecast by Packaging Type, 2020-2035
  • Table 41: South Asia & Pacific Market Value (USD Billion) Forecast by Application, 2020-2035
  • Table 42: South Asia & Pacific Market Volume Forecast by Application, 2020-2035
  • Table 43: Middle East and Africa Market Value (USD Billion) Forecast by Country, 2020-2035
  • Table 44: Middle East and Africa Market Volume Forecast by Country, 2020-2035
  • Table 45: Middle East and Africa Market Value (USD Billion) Forecast by Packaging Type, 2020-2035
  • Table 46: Middle East and Africa Market Volume Forecast by Packaging Type, 2020-2035
  • Table 47: Middle East and Africa Market Value (USD Billion) Forecast by Application, 2020-2035
  • Table 48: Middle East and Africa Market Volume Forecast by Application, 2020-2035


List of Figures

  • Figure 1: Global Market Volume Forecast 2020-2035
  • Figure 2: Global Market Pricing Analysis
  • Figure 3: Global Market Value (USD Billion) Forecast 2020-2035
  • Figure 4: Global Market Value Share and BPS Analysis by Packaging Type, 2025 and 2035
  • Figure 5: Global Market Y-o-Y Growth Comparison by Packaging Type, 2025-2035
  • Figure 6: Global Market Attractiveness Analysis by Packaging Type
  • Figure 7: Global Market Value Share and BPS Analysis by Application, 2025 and 2035
  • Figure 8: Global Market Y-o-Y Growth Comparison by Application, 2025-2035
  • Figure 9: Global Market Attractiveness Analysis by Application
  • Figure 10: Global Market Value (USD Billion) Share and BPS Analysis by Region, 2025 and 2035
  • Figure 11: Global Market Y-o-Y Growth Comparison by Region, 2025-2035
  • Figure 12: Global Market Attractiveness Analysis by Region
  • Figure 13: North America Market Incremental $ Opportunity, 2025-2035
  • Figure 14: Latin America Market Incremental $ Opportunity, 2025-2035
  • Figure 15: Western Europe Market Incremental $ Opportunity, 2025-2035
  • Figure 16: Eastern Europe Market Incremental $ Opportunity, 2025-2035
  • Figure 17: East Asia Market Incremental $ Opportunity, 2025-2035
  • Figure 18: South Asia & Pacific Market Incremental $ Opportunity, 2025-2035
  • Figure 19: Middle East and Africa Market Incremental $ Opportunity, 2025-2035
  • Figure 20: North America Market Value Share and BPS Analysis by Country, 2025 and 2035
  • Figure 21: North America Market Value Share and BPS Analysis by Packaging Type, 2025 and 2035
  • Figure 22: North America Market Y-o-Y Growth Comparison by Packaging Type, 2025-2035
  • Figure 23: North America Market Attractiveness Analysis by Packaging Type
  • Figure 24: North America Market Value Share and BPS Analysis by Application, 2025 and 2035
  • Figure 25: North America Market Y-o-Y Growth Comparison by Application, 2025-2035
  • Figure 26: North America Market Attractiveness Analysis by Application
  • Figure 27: Latin America Market Value Share and BPS Analysis by Country, 2025 and 2035
  • Figure 28: Latin America Market Value Share and BPS Analysis by Packaging Type, 2025 and 2035
  • Figure 29: Latin America Market Y-o-Y Growth Comparison by Packaging Type, 2025-2035
  • Figure 30: Latin America Market Attractiveness Analysis by Packaging Type
  • Figure 31: Latin America Market Value Share and BPS Analysis by Application, 2025 and 2035
  • Figure 32: Latin America Market Y-o-Y Growth Comparison by Application, 2025-2035
  • Figure 33: Latin America Market Attractiveness Analysis by Application
  • Figure 34: Western Europe Market Value Share and BPS Analysis by Country, 2025 and 2035
  • Figure 35: Western Europe Market Value Share and BPS Analysis by Packaging Type, 2025 and 2035
  • Figure 36: Western Europe Market Y-o-Y Growth Comparison by Packaging Type, 2025-2035
  • Figure 37: Western Europe Market Attractiveness Analysis by Packaging Type
  • Figure 38: Western Europe Market Value Share and BPS Analysis by Application, 2025 and 2035
  • Figure 39: Western Europe Market Y-o-Y Growth Comparison by Application, 2025-2035
  • Figure 40: Western Europe Market Attractiveness Analysis by Application
  • Figure 41: Eastern Europe Market Value Share and BPS Analysis by Country, 2025 and 2035
  • Figure 42: Eastern Europe Market Value Share and BPS Analysis by Packaging Type, 2025 and 2035
  • Figure 43: Eastern Europe Market Y-o-Y Growth Comparison by Packaging Type, 2025-2035
  • Figure 44: Eastern Europe Market Attractiveness Analysis by Packaging Type
  • Figure 45: Eastern Europe Market Value Share and BPS Analysis by Application, 2025 and 2035
  • Figure 46: Eastern Europe Market Y-o-Y Growth Comparison by Application, 2025-2035
  • Figure 47: Eastern Europe Market Attractiveness Analysis by Application
  • Figure 48: East Asia Market Value Share and BPS Analysis by Country, 2025 and 2035
  • Figure 49: East Asia Market Value Share and BPS Analysis by Packaging Type, 2025 and 2035
  • Figure 50: East Asia Market Y-o-Y Growth Comparison by Packaging Type, 2025-2035
  • Figure 51: East Asia Market Attractiveness Analysis by Packaging Type
  • Figure 52: East Asia Market Value Share and BPS Analysis by Application, 2025 and 2035
  • Figure 53: East Asia Market Y-o-Y Growth Comparison by Application, 2025-2035
  • Figure 54: East Asia Market Attractiveness Analysis by Application
  • Figure 55: South Asia & Pacific Market Value Share and BPS Analysis by Country, 2025 and 2035
  • Figure 56: South Asia & Pacific Market Value Share and BPS Analysis by Packaging Type, 2025 and 2035
  • Figure 57: South Asia & Pacific Market Y-o-Y Growth Comparison by Packaging Type, 2025-2035
  • Figure 58: South Asia & Pacific Market Attractiveness Analysis by Packaging Type
  • Figure 59: South Asia & Pacific Market Value Share and BPS Analysis by Application, 2025 and 2035
  • Figure 60: South Asia & Pacific Market Y-o-Y Growth Comparison by Application, 2025-2035
  • Figure 61: South Asia & Pacific Market Attractiveness Analysis by Application
  • Figure 62: Middle East and Africa Market Value Share and BPS Analysis by Country, 2025 and 2035
  • Figure 63: Middle East and Africa Market Value Share and BPS Analysis by Packaging Type, 2025 and 2035
  • Figure 64: Middle East and Africa Market Y-o-Y Growth Comparison by Packaging Type, 2025-2035
  • Figure 65: Middle East and Africa Market Attractiveness Analysis by Packaging Type
  • Figure 66: Middle East and Africa Market Value Share and BPS Analysis by Application, 2025 and 2035
  • Figure 67: Middle East and Africa Market Y-o-Y Growth Comparison by Application, 2025-2035
  • Figure 68: Middle East and Africa Market Attractiveness Analysis by Application
  • Figure 69: Global Market - Tier Structure Analysis
  • Figure 70: Global Market - Company Share Analysis

Frequently Asked Questions

What is the projected size of the next generation packaging market by 2035?

The market is expected to reach USD 27 billion by 2035, growing from USD 14.5 billion in 2025.

What is the expected CAGR for the next generation packaging market between 2025 and 2035?

The market is projected to grow at a CAGR of 6.4% over the forecast period.

Which is the leading packaging type in the next generation packaging market?

Active packaging holds the top position, contributing 42% of the total market share in 2025.

Which application segment generates the highest demand in the next generation packaging market?

Food & beverages lead the application landscape, accounting for 36% of the market in 2025.

Which country is anticipated to grow the fastest in the next generation packaging market?

South Korea is the fastest-growing country, registering a CAGR of 6.4% from 2025 to 2035.

Explore Similar Insights

Future Market Insights

Next Generation Packaging Market