

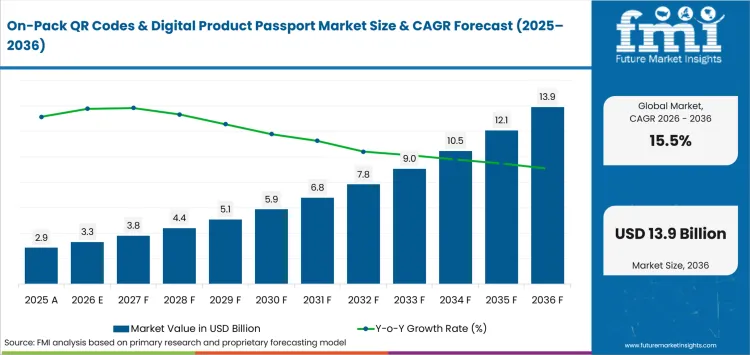
- Market Size (2026)
- USD 3.3 Bn
- Forecast (2036)
- USD 13.9 Bn
- CAGR (2026 to 2036)
- 15.5%
How big is On-Pack QR Codes & Digital Product Passport Market size?
USD 3.3 billion in 2026 and USD 13.9 billion by 2036 at a 15.5% CAGR.
Sales of on-pack QR codes & digital product passport are estimated to rise at 15.5% CAGR by 2036, increasing valuation from USD 3.3 billion in 2026 to USD 13.9 billion by 2036. Brand owners increasingly use smart QR codes to share important product details like ingredients and recycling instructions without cluttering the packaging design. These connected codes also make it easy to check product authenticity and compliance records behind the scenes. In June 2024, a GS1 statement recorded 22 industry leaders supporting a global transition to these advanced barcodes by investing heavily in code generation and digital link maintenance. Companies are carefully managing packaging artwork while making sure every code scans smoothly and quickly at the checkout stand.
In different regions, companies focus on distinct priorities when rolling out these digital identifiers. Buyers in the United States and Germany prioritize official registry evidence and reliable number continuity. Programs in China and the United Kingdom emphasize local labeling rules and wide retailer acceptance. In April 2026, GS1 UK highlighted range-level adoption following 2 years of successful Tesco pilot programs. This significant milestone demonstrated steady progress led by repeated printing and checkout verification tests. Training suppliers and validating checkout systems completed their preparation for full commercial launch.
Key Takeaways for the On-Pack QR Codes & Digital Product Passport Market
- Demand for on-pack QR codes and product passports is driven by richer product-information needs. Brand owners favor identifiers linked to governed records in place of fixed promotional pages.
- Ingredient transparency is forecast to garner 41.1% share of application in 2026, supported by current ingredient and allergen records together with sourcing and usage details.
- QR is estimated to lead technology with 50.4% share in 2026, backed by native smartphone scanning and compatibility with standards-based product identifiers.
- Weak print contrast and unstable destinations restrict dependable deployment. Incomplete master data and unclear update ownership create further exposure across live packaging lines.
- Competition focuses on Digimarc, Kezzler, and Avery Dennison. Scantrust and Circularise add passport-data capabilities. OPTEL Group, Systech, and Assent extend authentication and implementation coverage.
Analyst Perspective
“Connected packaging creates commercial value only with maintained information and dependable scanning. Packaging teams need one accountable process for identifier creation and artwork approval. Line verification and record updates complete operating governance. Repeat use follows proven checkout performance and product-specific governance in place of a QR image placed on artwork.”
- Nandini Roy Choudhury, Principal Analyst for Packaging at Future Market Insights
How is On-Pack QR Codes & Digital Product Passport Market segmented?
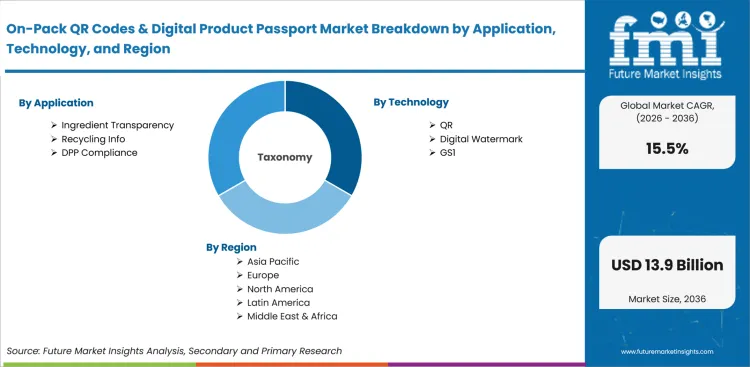
The On-pack QR codes and digital product passport industry is segmented by application, technology, end use, and region.
The On-pack QR codes and digital product passport industry is segmented by application, technology, end use, and region. Application coverage includes Ingredient Transparency, Recycling Info, and DPP Compliance. Technology coverage compares QR, Digital Watermark, and GS1. End Use coverage spans Food Processing and Beverages. Animal Feed and Industrial operations complete coverage. Regional assessment includes North America and Latin America together with Western Europe and Eastern Europe. East Asia joins South Asia and Pacific; Middle East and Africa complete geographic assessment.
What makes ingredient transparency central to application selection?
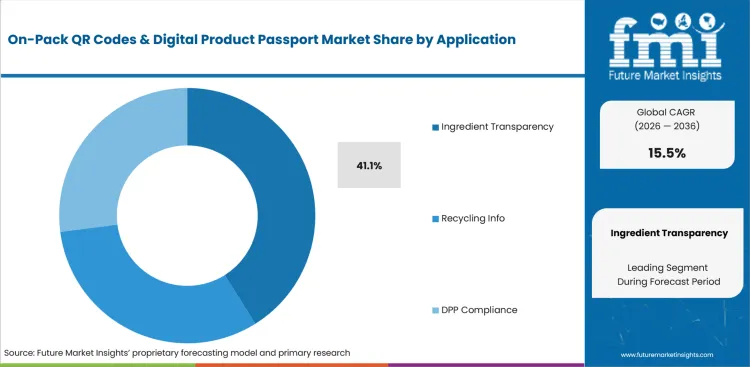
Ingredient Transparency links limited pack space with maintained ingredient and allergen records. Nutrition, sourcing, and preparation details remain available at one governed destination. Brand owners gain controlled access for regional variants and approved consumer information. A November 2025 GS1 UK survey found 81.0% of shoppers wanted more product information than packs currently display, reinforcing demand for scannable access backed by controlled product data.
- Ingredient transparency is predicted to represent 41.1% share of application in 2026, reflecting direct use on food and beverage packs. Personal-care and household packs extend coverage under current consumer-information duties, and release teams assess content ownership together with record approval and destination persistence.
- Recycling info and DPP compliance address separate operating duties across disposal guidance and regulated lifecycle records. Effective programs distinguish consumer-facing recycling instructions from product-group passport requirements, preventing unsupported compliance claims on ordinary connected packs.
Why does QR lead technology demand?
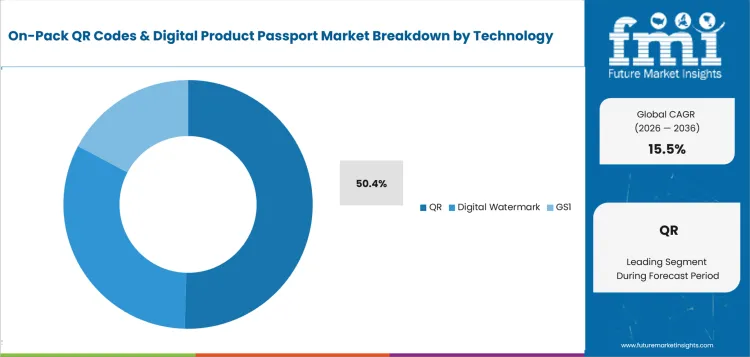
QR supports phone access and retail scanning together with product identifiers and resolver-based redirection from one printed symbol. Integration requires correct syntax and quiet-zone discipline. Substrate testing and destination governance complete implementation review. GS1 UK documented Tesco trials across 12 own-brand meat and produce lines in April 2025, demonstrating practical evaluation of printing and supplier data. Checkout reading and use-by information completed live-store assessment.
- By technology, QR is anticipated to account for 50.4% share in 2026 since being driven by widespread camera access and compatibility with GS1 Digital Link structures. Packaging teams retain responsibility for code size and contrast, with point-of-sale validation completing review.
- Digital watermark and GS1 serve different functions inside connected-pack programs. Watermarks provide covert or distributed machine-readable triggers.
How does food processing shape end use demand?
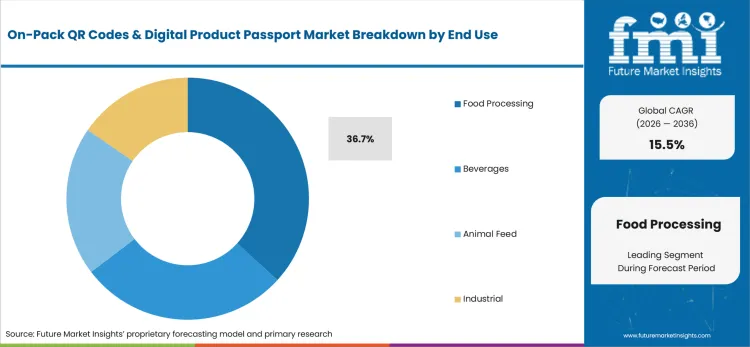
Food processing requires variable batch and expiry records across high-speed lines. Ingredient and allergen data extend operating requirements. Pack identifiers require synchronized enterprise data together with printing equipment and verification controls. Retailer systems complete commercial operation. GS1 UK recorded 1 million fresh-produce checkout scans each day during April 2026 QR planning, exposing material labor and queue effects from small reading delays.
- Based on end use, food processing is likely to hold 36.7% share in 2026 as it is influenced by frequent label changes and traceability duties across perishable products. Processors evaluate line speed and ink behavior, with code grading and recall readiness completing representative production review.
- Beverages and Industrial users apply connected codes across recycling guidance and authenticity. Package material and filling conditions shape adoption depth together with distribution routes and responsible data owners.
What are drivers, restraints, and opportunities in On-Pack QR Codes & Digital Product Passport Market?
Demand rises as brand owners seek detailed product information beyond available pack space. Commercial expansion relies on dependable code performance and governed passport records across regulated product groups.
- Driver: Brand owners require more ingredient and traceability detail than packaging space allows. Connected identifiers provide controlled access to approved consumer information without frequent artwork changes.
- Restraint: Poor print quality reduces scan reliability across retail and consumer use. Fragmented product records create information gaps during updates and verification.
- Opportunity: Standards-based identifiers connect physical packs with maintained compliance records. Recycling guidance and authentication services extend commercial use across approved applications.
Accessible information supports connected-pack investment across food and consumer products. A December 2025 GS1 UK study found 80.0% of visually impaired respondents would use widely available QR-based product information, linking adoption with readable ingredient and allergen details. Storage and portion guidance strengthen practical utility.
Print and scanner variation creates direct operating risk across warehouses and checkout lanes together with consumer phones. GS1 US found 70.0% of logistics operations experienced weekly barcode-readability issues in September 2025, highlighting demand for grading and label consistency. Scanner upgrades and production-line verification address repeated failures.
Regulated passport infrastructure expands demand for identifiers and registry connections together with semantic models and lifecycle-data services. European Commission published six harmonized DPP standards in July 2026, strengthening specifications for identifiers and data carriers. Interfaces, exchange protocols, and storage complete covered routes.
What country CAGRs are profiled in On-Pack QR Codes & Digital Product Passport Market?
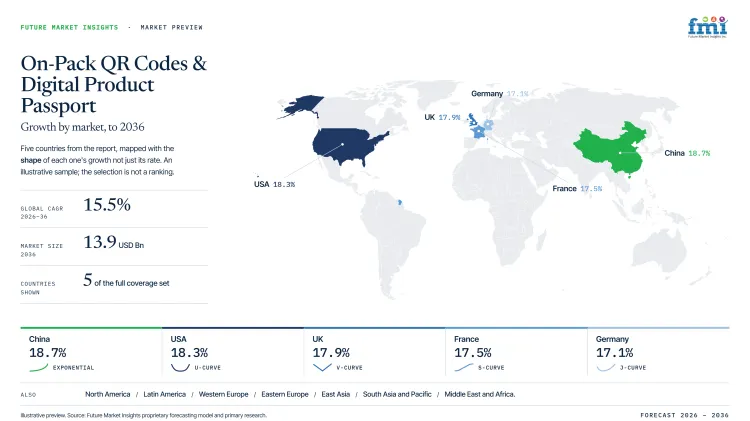
| Country | CAGR |
|---|---|
| China | 18.7% |
| USA | 18.3% |
| UK | 17.9% |
| France | 17.5% |
| Germany | 17.1% |
Source: Future Market Insights forecast model, 2026.
How do country-level CAGRs compare in On-Pack QR Codes & Digital Product Passport Market?
Country comparison forms a gradual step-down across profiled markets. China leads disclosed rates with USA and UK following. France and Germany complete comparison under European packaging and identification requirements together with passport rules. Relative positions describe modeled adoption pace and do not establish current country revenue or legal coverage.
- Retail traceability programs and expanding standards-based product identification place China in first development band.
- Food traceability coordination and retail barcode transition support USA. Enterprise data-quality investment strengthens second position.
- Supermarket pilots and range-level QR implementation place UK in third position across disclosed rates.
- Retailer-led ingredient and nutrition programs support France. Recycling information on connected wine packaging reinforces placement.
- Packaging-register transparency and producer-responsibility administration complete disclosed comparison for Germany.
Markets carrying similar CAGRs may present different entry conditions across printing capability and retailer readiness. Product-data governance and regulatory scope create further separation. Full report coverage extends across more than 30 countries spanning all listed regions.
Country-wise Analysis
- Industry in China is projected to advance at 18.7% CAGR between 2026 and 2036, led by traceability systems linking pack identifiers with sales and enforcement records. Hainan Provincial People’s Government described a one-product-one-code system in June 2025, demonstrating official use of anti-counterfeiting QR identifiers on individual duty-free packaging units. Item-level identity and enforcement access support local adoption. Brand systems also need compatible data structures across national and retailer programs.
- Food and Drug Administration proposed a 30-month traceability compliance extension in August 2025, reflecting coordination demands across covered food businesses and trading partners. Sales in the United States are projected to grow at 18.3% CAGR over 2026 to 2036, driven by standards-based retail and food-data programs Implementation spending centers on accurate source records and partner data exchange. Code verification and exception handling complete covered-food operations.
- Commercial scaling relies on trusted identifiers and retail scanning together with maintained destinations and supplier onboarding. Adoption in the United Kingdom is forecast at 17.9% CAGR during the forecast period, aided by retailer pilots moving into commercial grocery ranges. GS1 UK documented in June 2026 a branded QR-code debut representing a first at a major retailer. Packaged meals connected shoppers with nutrition and allergen details together with sourcing and origin information.
- GS1 recorded Carrefour operating around 14,000 stores during its October 2024 QR adoption program, providing a substantial retail route for standards-based packaging information. French programs require coordination across EU product rules and national recycling guidance. Label approval and consumer-language presentation complete implementation. Sector in France is projected to scale at 17.5% CAGR during the assessment period, backed by connected wine packs combine ingredient and nutrition records with recycling functions.
- Supplier opportunities center on accurate company identifiers and packaging records. Recycling information and controlled links connect packs with approved disclosures. Central Agency Packaging Register recorded LUCID passing one million registrations in April 2024, illustrating administrative scale for packaging identity and producer-responsibility data. Germany is expected to record 17.1% CAGR during the study period, guided by packaging-accountability systems and traceable producer
Who are notable companies in On-Pack QR Codes & Digital Product Passport Market?
Digimarc, Kezzler, Avery Dennison, Scantrust, Circularise, OPTEL Group, Systech, and Assent are the notable companies shaping this market.
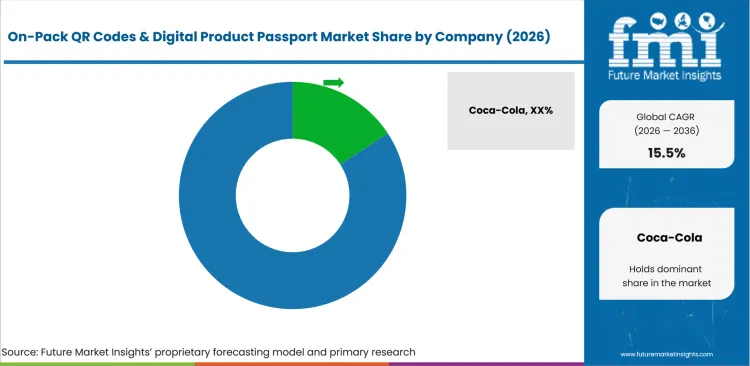
Competition centers on verified product identity and maintained passport records for connected packaging programs. Platform providers support persistent identifiers and controlled redirection for consumer and enterprise uses. Traceability specialists organize supplier and lifecycle information required for regulated passports. Inspection providers connect printed codes with packaging-line verification and authentication. Buyer review covers identifier control and data ownership during implementation and renewal.
- Digimarc and Kezzler compete based on standards-based product identity and connected-pack management. Customer teams assess resolver continuity and QR governance within consumer-information and traceability programs.
- Avery Dennison and Scantrust compete depending on physical identifiers linked with managed product records. Packaging teams examine label integration and code security for production and shopper access.
- Circularise and Assent focus on passport data and supplier information for regulated product programs. Manufacturers review record validation and permission controls during compliance preparation.
- OPTEL Group and Systech support serialization and verification inside packaging operations. Plant teams assess line integration and authentication performance during deployment review.
Competitive Benchmarking: On-Pack QR Codes & Digital Product Passport Market
| Company | Identifier Portfolio | Packaging-Line Support | Passport Data Support | Service Reach |
|---|---|---|---|---|
| Digimarc | High | High | High | Global |
| Kezzler | High | Medium | High | Multi-region |
| Avery Dennison | High | High | High | Global |
| Scantrust | High | Medium | High | Multi-region |
| Circularise | Medium | Low | High | Selected international markets |
| OPTEL Group | High | High | Medium | Global |
| Systech | High | High | Medium | Global |
| Assent | Medium | Low | High | Global |
Source: Future Market Insights competitive analysis, 2026.
Key Developments in the On-Pack QR Codes & Digital Product Passport Market
- In April 2025, Digimarc announced a Unilever implementation covering 45,000 SKUs with GS1 Digital Link-enabled 2D barcodes. Company information connected pack-level product access with retail scanning and passport preparation for a global consumer-goods portfolio.
- In June 2025, Kezzler entered a partnership with GS1 Australia focused on 2D barcodes and standardized product information. Company information linked EPCIS event repositories with traceability and connected-pack implementation for food and consumer-goods users.
- In June 2026, Avery Dennison introduced ReadyDPP for apparel product-passport creation and management. Company information combined software and digital identifiers with physical labels under one implementation service.
Leading Companies in the On-Pack QR Codes & Digital Product Passport Market
Connected Identification Platforms
- Digimarc
- Kezzler
- Avery Dennison
Traceability and Passport Platforms
- Scantrust
- Circularise
- Assent
Inspection and Authentication Integration
- OPTEL Group
- Systech
On-Pack QR Codes & Digital Product Passport Market Report Scope
| Coverage field | Report scope |
|---|---|
| Market breakdown | On-pack QR codes & digital product passport market breakdown includes application, technology, end use, and region. |
| Quantitative Units | Revenue in USD Million, CAGR in %. |
| Market Definition | On-pack QR and Data Matrix systems provide connected access to ingredient transparency, recycling information, and digital product passports. Digital-watermark, resolver, verification, and passport-data services complete defined coverage. Ordinary promotional QR pages without governed product information are excluded. |
| Regions Covered | North America, Latin America, Western Europe, Eastern Europe, East Asia, South Asia and Pacific, Middle East and Africa. |
| Countries Covered | USA, Germany, France, UK, China, and more than 25 additional countries complete full report coverage. |
| Key Companies Profiled | Digimarc, Kezzler, Avery Dennison, Scantrust, Circularise, OPTEL Group, Systech, and Assent. |
| Forecast Period | 2026 to 2036 |
| Approach | Hybrid bottom-up and top-down methodology uses segment shares and country CAGRs. Company activity and buyer adoption support final market reconciliation. |
Source: Future Market Insights analysis, 2026.
On-Pack QR Codes & Digital Product Passport Market - Research Methodology
| Method | Approach |
|---|---|
| Primary Research | FMI analysts gathered input from manufacturers, service providers, technology developers, distributors, end users, procurement teams, and subject-matter experts. Interviews examined purchasing decisions, product or service evaluation, adoption barriers, approval requirements, pricing considerations, and expectations for technical or commercial support. Respondents were also asked what evidence is required before a trial, pilot, or initial order develops into regular purchasing. |
| Desk Research | Desk research covered government statistics, regulatory publications, trade data, industry associations, technical literature, standards, company filings, product information, and official corporate announcements. Sources were reviewed for relevance, publication date, geographic coverage, and consistency with the defined market scope. Claims relating to performance, applications, approvals, capacity, investment, and commercial activity were retained only when supported by credible public evidence. |
| Market Sizing and Forecasting | The market model combined the baseline value with historical performance, segment structure, pricing and volume indicators, adoption levels, company participation, and country-level demand conditions. Forecast assumptions considered economic activity, investment trends, regulatory developments, technology adoption, purchasing cycles, supply availability, and barriers to wider market use. Segment and regional estimates were reconciled before the final market total was calculated. |
| Data Validation | Estimates were checked against multiple independent indicators, including public data, company activity, trade patterns, industry developments, and findings from primary interviews. Validation also tested whether products, services, applications, and company revenues fell within the defined market boundaries. Adjacent categories, unsupported claims, overlapping revenues, and activities without direct market relevance were excluded to reduce double counting and maintain consistency across segments and countries. |
Source: Future Market Insights research methodology, 2026.
On-Pack QR Codes & Digital Product Passport Market by Segments
On-Pack QR Codes & Digital Product Passport Market segmented by Application:
- Ingredient Transparency
- Recycling Info
- DPP Compliance
On-Pack QR Codes & Digital Product Passport Market segmented by Technology:
- QR
- Digital Watermark
- GS1
On-Pack QR Codes & Digital Product Passport Market segmented by End Use:
- Food Processing
- Beverages
- Animal Feed
- Industrial
On-Pack QR Codes & Digital Product Passport Market by Region:
- North America
- United States
- Canada
- Latin America
- Brazil
- Mexico
- Argentina
- Chile
- Western Europe
- Germany
- France
- United Kingdom
- Italy
- Spain
- Benelux
- Nordics
- Eastern Europe
- Poland
- Czech Republic
- Romania
- Hungary
- East Asia
- China
- Japan
- South Korea
- South Asia and Pacific
- India
- ASEAN
- Australia and New Zealand
- Middle East and Africa
- GCC Countries
- South Africa
- Türkiye
- Israel
Research Sources and Bibliography
- Avery Dennison. (2026, June 30). Avery Dennison announces ReadyDPP™ to help build apparel compliance for Digital Product Passports.
- Zentrale Stelle Verpackungsregister. (2024, April 9). From 55,000 to 1,000,000 - how the LUCID Packaging Register is improving fairness and transparency in the packaging recycling market.
- Digimarc. (2025, April 29). Digimarc Enables One of the CPG Industry’s Largest Global Rollouts of 2D Barcodes with Unilever, Improving Retail and Consumer Experience.
- European Parliament & Council of the European Union. (2024, June 28). Regulation (EU) 2024/1781 of the European Parliament and of the Council of 13 June 2024 establishing a framework for the setting of ecodesign requirements for sustainable products, amending Directive (EU) 2020/1828 and Regulation (EU) 2023/1542 and repealing Directive 2009/125/EC.
- European Commission. (2026, July 20). The Digital Product Passport Registry is now live.
- Food and Drug Administration. (2025, August 6). FDA Proposes to Extend Compliance Date for Food Traceability Rule and Issues New FAQs and Other Resources.
- GS1. (2024, June 26). Leading companies in the retail and consumer goods industries support the transition to QR Codes with GS1 standards.
- GS1. (2024, October 24). Carrefour drives retail innovation with QR Codes powered by GS1.
- GS1 UK. (2025, April 23). Tesco in early trials of next generation barcodes in move set to reshape UK retail.
- GS1 UK. (2025, November 4). The future of product information: 2D barcodes, generative AI and the evolving digital shopper.
- GS1 UK. (2025, December 8). Seven in 10 visually impaired people find food shopping a challenge - as retailers urged to adopt ‘miracle’ solution.
- GS1 UK. (2026, April 13). Every second counts: what two years of QR code pilots taught Tesco and GS1 UK.
- GS1 UK. (2026, April 17). Tesco becomes the first UK supermarket to transition an entire product range to QR codes powered by GS1.
- GS1 UK. (2026, June 4). Oscar Mayer launch new Players World Kitchen range with branded QR codes powered by GS1.
- GS1 US. (2025, September 25). New GS1 US Research Offers Companies a Roadmap to Supply Chain Modernization Through Intelligent Data Capture.
- Hainan Provincial People’s Government. (2025, June 24). What is the product traceability code?
- Kezzler. (2025, June 3). Kezzler is partnering with GS1 Australia.
This bibliography is provided for reader reference and is not exhaustive. The full report contains the complete reference list and detailed citations.
This Report Answers
- How large is on-pack QR codes and digital product passport market during the forecast period?
- What commercial conditions convert connected-pack interest into repeat demand?
- Why does ingredient transparency lead application selection?
- How does QR influence technology demand?
- Why does food processing hold its end use position?
- How do profiled country rates compare across China, USA, UK, France, and Germany?
- What providers supply identification and integration capabilities?
- How do print quality and record ownership restrict adoption?
- What criteria guide platform selection and implementation planning?
- How were segment and competitive estimates developed?
Frequently Asked Questions
How big is the On-Pack QR Codes & Digital Product Passport Market in 2026?
The on-pack QR codes & digital product passport market is valued at USD 3.3 billion in 2026 and is forecast to reach USD 13.9 billion by 2036.
What is the CAGR of the On-Pack QR Codes & Digital Product Passport Market from 2026 to 2036?
The on-pack QR codes & digital product passport market is projected to grow at a CAGR of 15.5% between 2026 and 2036, supported by brand owners requiring controlled access to ingredient, traceability, and compliance records beyond available packaging space.
Which application segment leads the On-Pack QR Codes & Digital Product Passport Market?
Ingredient transparency accounts for 41.1% of the on-pack QR codes & digital product passport market by application in 2026, driven by direct use on food and beverage packs where brands require governed access to ingredient, allergen, sourcing, and nutrition records without repeated artwork changes.
Which country is growing fastest in the On-Pack QR Codes & Digital Product Passport Market?
China is the fastest-growing country in the on-pack QR codes & digital product passport market, expanding at an 18.7% CAGR through 2036, ahead of the market average of 15.5%, supported by retail traceability programs and official item-level anti-counterfeiting systems linking pack identifiers with sales and enforcement records.
Who are the leading companies in the On-Pack QR Codes & Digital Product Passport Market?
Leading companies in the on-pack QR codes & digital product passport market include Digimarc, Kezzler, Avery Dennison, Scantrust, Circularise, OPTEL Group, Systech, and Assent, spanning connected identification platforms, traceability and passport data services, and packaging-line inspection and authentication integration.
Preview the report firsthand - request a free sample
Get SampleGet the brochure for pricing and purchase details.
Get PDFTable of Content
- Key Takeaways
- Market Size and CAGR
- Top Growth Driver
- Fastest Growing Segment
- Leading Region
- Key Companies
- Emerging Opportunities
- Executive Summary
- Global Market Outlook
- Demand-side Trends
- Supply-side Trends
- Technology Roadmap Analysis
- Analysis and Recommendations
- Analyst Perspective (What is happening? Why now? What should investors know?)
- Key Questions Answered
- How large is the market?
- What is the CAGR?
- What are key trends?
- Which region dominates?
- Who are the leaders?
- Market Overview
- Market Coverage / Taxonomy
- Market Definition / Scope / Limitations
- Research Methodology
- Chapter Orientation
- Analytical Lens and Working Hypotheses
- Market Structure, Signals, and Trend Drivers
- Benchmarking and Cross-market Comparability
- Market Sizing, Forecasting, and Opportunity Mapping
- Research Design and Evidence Framework
- Desk Research Programme (Secondary Evidence)
- Expert Input and Fieldwork (Primary Evidence)
- Tooling, Models, and Reference Databases
- Data Engineering and Model Build
- Quality Assurance and Audit Trail
- Market Background
- Market Dynamics (Drivers, Restraints, Opportunity, Trends)
- Scenario Forecast (Optimistic, Likely, Conservative)
- Impact Analysis
- AI Impact
- Sustainability Impact
- Regulatory Impact
- Technology Impact
- Consumer / Buyer Analysis
- Purchase Drivers
- Adoption Barriers
- Buyer Journey
- Opportunity Map Analysis
- Product Life Cycle Analysis
- Supply Chain Analysis
- Investment Feasibility Matrix
- Value Chain Analysis
- PESTLE and Porter's Analysis
- Regulatory Landscape
- Regional Parent Market Outlook
- Production and Consumption Statistics
- Import and Export Statistics
- Global Market Analysis and Forecast, 2021 to 2036
- Historical Market Size Value (USD Billion) Analysis, 2021 to 2025
- Current and Future Market Size Value (USD Billion) Projections, 2026 to 2036
- Y-o-Y Growth Trend Analysis
- Absolute $ Opportunity Analysis
- Global Market Pricing Analysis, 2021 to 2036
- Global Market Analysis and Forecast, By Application, 2021 to 2036
- Introduction / Key Findings
- Historical Market Size Value (USD Billion) Analysis By Application, 2021 to 2025
- Current and Future Market Size Value (USD Billion) Analysis and Forecast By Application, 2026 to 2036
- Ingredient Transparency
- Recycling Info
- DPP Compliance
- Ingredient Transparency
- Y-o-Y Growth Trend Analysis By Application, 2021 to 2025
- Absolute $ Opportunity Analysis By Application, 2026 to 2036
- Global Market Analysis and Forecast, By Technology, 2021 to 2036
- Introduction / Key Findings
- Historical Market Size Value (USD Billion) Analysis By Technology, 2021 to 2025
- Current and Future Market Size Value (USD Billion) Analysis and Forecast By Technology, 2026 to 2036
- QR
- Digital Watermark
- GS1
- QR
- Y-o-Y Growth Trend Analysis By Technology, 2021 to 2025
- Absolute $ Opportunity Analysis By Technology, 2026 to 2036
- Global Market Analysis and Forecast, By End Use, 2021 to 2036
- Introduction / Key Findings
- Historical Market Size Value (USD Billion) Analysis By End Use, 2021 to 2025
- Current and Future Market Size Value (USD Billion) Analysis and Forecast By End Use, 2026 to 2036
- Food Processing
- Beverages
- Animal Feed
- Industrial
- Food Processing
- Y-o-Y Growth Trend Analysis By End Use, 2021 to 2025
- Absolute $ Opportunity Analysis By End Use, 2026 to 2036
- Global Market Analysis and Forecast, By Region, 2021 to 2036
- Introduction
- Historical Market Size Value (USD Billion) Analysis By Region, 2021 to 2025
- Current Market Size Value (USD Billion) Analysis and Forecast By Region, 2026 to 2036
- North America
- Latin America
- Western Europe
- Eastern Europe
- East Asia
- South Asia and Pacific
- Middle East & Africa
- Market Attractiveness Analysis By Region
- North America Market Analysis and Forecast, By Country, 2021 to 2036
- Historical Market Size Value (USD Billion) Trend Analysis By Market Taxonomy, 2021 to 2025
- Market Size Value (USD Billion) Forecast By Market Taxonomy, 2026 to 2036
- By Country
- USA
- Canada
- By Application
- By Technology
- By End Use
- By Country
- Market Attractiveness Analysis
- By Country
- By Application
- By Technology
- By End Use
- Key Takeaways
- Latin America Market Analysis and Forecast, By Country
- Historical Market Size Value (USD Billion) Trend Analysis By Market Taxonomy, 2021 to 2025
- Market Size Value (USD Billion) Forecast By Market Taxonomy, 2026 to 2036
- By Country
- Brazil
- Mexico
- Chile
- Rest of Latin America
- By Application
- By Technology
- By End Use
- By Country
- Market Attractiveness Analysis
- By Country
- By Application
- By Technology
- By End Use
- Key Takeaways
- Western Europe Market Analysis and Forecast, By Country
- Historical Market Size Value (USD Billion) Trend Analysis By Market Taxonomy, 2021 to 2025
- Market Size Value (USD Billion) Forecast By Market Taxonomy, 2026 to 2036
- By Country
- Germany
- UK
- Italy
- Spain
- France
- Nordic
- BENELUX
- Rest of Western Europe
- By Application
- By Technology
- By End Use
- By Country
- Market Attractiveness Analysis
- By Country
- By Application
- By Technology
- By End Use
- Key Takeaways
- Eastern Europe Market Analysis and Forecast, By Country
- Historical Market Size Value (USD Billion) Trend Analysis By Market Taxonomy, 2021 to 2025
- Market Size Value (USD Billion) Forecast By Market Taxonomy, 2026 to 2036
- By Country
- Russia
- Poland
- Hungary
- Balkan & Baltic
- Rest of Eastern Europe
- By Application
- By Technology
- By End Use
- By Country
- Market Attractiveness Analysis
- By Country
- By Application
- By Technology
- By End Use
- Key Takeaways
- East Asia Market Analysis and Forecast, By Country
- Historical Market Size Value (USD Billion) Trend Analysis By Market Taxonomy, 2021 to 2025
- Market Size Value (USD Billion) Forecast By Market Taxonomy, 2026 to 2036
- By Country
- China
- Japan
- South Korea
- By Application
- By Technology
- By End Use
- By Country
- Market Attractiveness Analysis
- By Country
- By Application
- By Technology
- By End Use
- Key Takeaways
- South Asia and Pacific Market Analysis and Forecast, By Country
- Historical Market Size Value (USD Billion) Trend Analysis By Market Taxonomy, 2021 to 2025
- Market Size Value (USD Billion) Forecast By Market Taxonomy, 2026 to 2036
- By Country
- India
- ASEAN
- Australia & New Zealand
- Rest of South Asia and Pacific
- By Application
- By Technology
- By End Use
- By Country
- Market Attractiveness Analysis
- By Country
- By Application
- By Technology
- By End Use
- Key Takeaways
- Middle East & Africa Market Analysis and Forecast, By Country
- Historical Market Size Value (USD Billion) Trend Analysis By Market Taxonomy, 2021 to 2025
- Market Size Value (USD Billion) Forecast By Market Taxonomy, 2026 to 2036
- By Country
- Kingdom of Saudi Arabia
- Other GCC Countries
- Türkiye
- South Africa
- Other African Union
- Rest of Middle East & Africa
- By Application
- By Technology
- By End Use
- By Country
- Market Attractiveness Analysis
- By Country
- By Application
- By Technology
- By End Use
- Key Takeaways
- Key Countries Market Analysis
- USA
- Pricing Analysis
- Market Share Analysis, 2025
- By Application
- By Technology
- By End Use
- Canada
- Pricing Analysis
- Market Share Analysis, 2025
- By Application
- By Technology
- By End Use
- Mexico
- Pricing Analysis
- Market Share Analysis, 2025
- By Application
- By Technology
- By End Use
- Brazil
- Pricing Analysis
- Market Share Analysis, 2025
- By Application
- By Technology
- By End Use
- Chile
- Pricing Analysis
- Market Share Analysis, 2025
- By Application
- By Technology
- By End Use
- Germany
- Pricing Analysis
- Market Share Analysis, 2025
- By Application
- By Technology
- By End Use
- UK
- Pricing Analysis
- Market Share Analysis, 2025
- By Application
- By Technology
- By End Use
- Italy
- Pricing Analysis
- Market Share Analysis, 2025
- By Application
- By Technology
- By End Use
- Spain
- Pricing Analysis
- Market Share Analysis, 2025
- By Application
- By Technology
- By End Use
- France
- Pricing Analysis
- Market Share Analysis, 2025
- By Application
- By Technology
- By End Use
- India
- Pricing Analysis
- Market Share Analysis, 2025
- By Application
- By Technology
- By End Use
- ASEAN
- Pricing Analysis
- Market Share Analysis, 2025
- By Application
- By Technology
- By End Use
- Australia & New Zealand
- Pricing Analysis
- Market Share Analysis, 2025
- By Application
- By Technology
- By End Use
- China
- Pricing Analysis
- Market Share Analysis, 2025
- By Application
- By Technology
- By End Use
- Japan
- Pricing Analysis
- Market Share Analysis, 2025
- By Application
- By Technology
- By End Use
- South Korea
- Pricing Analysis
- Market Share Analysis, 2025
- By Application
- By Technology
- By End Use
- Russia
- Pricing Analysis
- Market Share Analysis, 2025
- By Application
- By Technology
- By End Use
- Poland
- Pricing Analysis
- Market Share Analysis, 2025
- By Application
- By Technology
- By End Use
- Hungary
- Pricing Analysis
- Market Share Analysis, 2025
- By Application
- By Technology
- By End Use
- Kingdom of Saudi Arabia
- Pricing Analysis
- Market Share Analysis, 2025
- By Application
- By Technology
- By End Use
- Türkiye
- Pricing Analysis
- Market Share Analysis, 2025
- By Application
- By Technology
- By End Use
- South Africa
- Pricing Analysis
- Market Share Analysis, 2025
- By Application
- By Technology
- By End Use
- USA
- Market Structure Analysis
- Competition Dashboard
- Competition Benchmarking
- Market Share Analysis of Top Players
- By Regional
- By Application
- By Technology
- By End Use
- Emerging Startups
- Innovation Benchmarking
- Competition Analysis
- Competition Deep Dive
- Coca-Cola
- Overview
- Product Portfolio
- Profitability by Market Segments
- Sales Footprint
- Strategy Overview
- Marketing Strategy
- Product Strategy
- Channel Strategy
- PepsiCo
- Keurig Dr Pepper
- Digimarc
- GS1
- Scantrust
- Segede
- Coca-Cola
- Case Studies
- Success Stories
- Recent Developments
- Competition Deep Dive
- Assumptions & Acronyms Used


