
- Market Size (2026)
- USD 5.8 Bn
- Forecast (2036)
- USD 9.0 Bn
- CAGR (2026 to 2036)
- 4.5%
How Big Is the Online Dating Application Market in 2026?
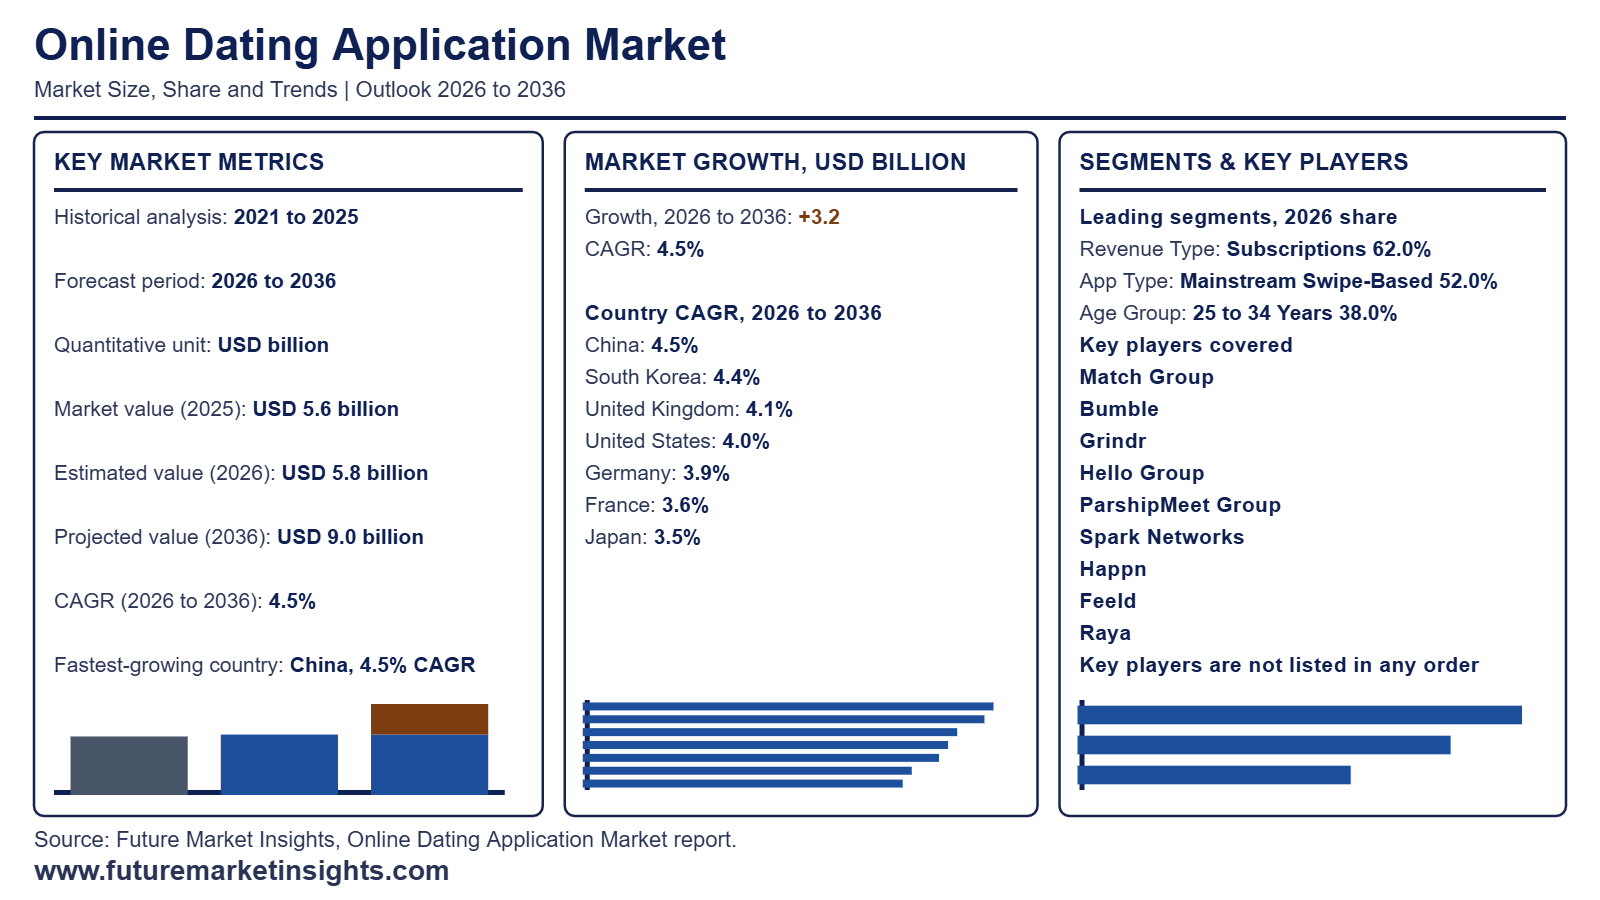
The global online dating application market is valued at USD 5.8 billion in 2026 and was about USD 5.6 billion in 2025. Future Market Insights (FMI) projects it to reach USD 9.0 billion by 2036 at a 4.5% CAGR, which generates USD 3.2 billion in incremental revenue over the forecast decade.
| Market Metric | Valuation / Share / Forecast Benchmark |
|---|---|
| 2025 Market Size (Historical) | USD 5.6 billion |
| 2026 Market Size (Estimated) | USD 5.8 billion |
| 2036 Market Size (Projected) | USD 9.0 billion |
| Compound Annual Growth Rate (2026 to 2036) | 4.5% CAGR |
| Incremental Dollar Opportunity (2026 to 2036) | USD 3.2 billion |
| Dominant Revenue Type (2026 to 2036 Share) | Subscriptions (62.0% in 2026 rising to 63.9% by 2036 at 4.8% CAGR) |
| Leading App Type | Mainstream Swipe-Based (52.0% share in 2026 and 4.7% CAGR) |
| Leading Age Group | 25 to 34 Years (38.0% share in 2026 and 4.7% CAGR) |
| Leading Payer Tier | Basic Premium (56.0% share in 2026 and 4.7% CAGR) |
| Largest Country Markets (2026 Global Share) | USA (34.0%) |
| Fastest-Growing Country Markets (2026 to 2036) | China (4.5% CAGR) |
| Leading Tier-1 Companies | Match Group |
Source: Future Market Insights analysis of the online dating application market, 2026.
Executive Market Overview
Subscription revenue anchors online dating applications because payers pay for visibility and filters and added messaging. Intent led products now set the pace as Hinge direct revenue grew 19% to USD 220.6 million in the third quarter of 2026 on 23% payer growth from European expansion (Match Group 2026). Tinder payers eased 4% which shows volume shifting away from swipe heavy formats (Match Group 2026). Bumble revenue reached USD 207.1 million against USD 246.2 million a year earlier (Bumble 2026). Safety duties add a cost layer specific to this market since Ofcom found over one in ten 15 to 17 year olds still visiting three leading dating apps despite age checks and expects stronger steps for age assurance (Ofcom 2026). Verification builds trust and screens out lower intent accounts which trims near term payer counts.
Even so the leading segments hold firm as Subscriptions lead Revenue Type at 62.0% with a 4.8% CAGR and Mainstream Swipe-Based apps hold 52.0% of App Type at 4.7%. The 25 to 34 Years cohort accounts for 38.0% of Age Group revenue at 4.7% and Basic Premium holds 56.0% of Payer Tier at 4.7%. China is the fastest-growing country at a 4.5% CAGR followed by South Korea at 4.4% and the UK at 4.1% as mobile payment habits widen payer pools. The USA at 4.0% and Germany at 3.9% sit beside France at 3.6% and Japan at 3.5% in established bases where identity verification spending protects conversion. Payer expansion in East Asia and steady monetization in the West keep subscription led formats ahead through 2036. Market sizing covers subscriptions and in-app purchases and advertising and events revenue from dating apps while excluding offline matchmaking agencies and general social networks.
Analyst Perspective
The online dating application market is moving toward AI driven matching and video first interaction as users demand authentic and safer connections. Platforms that pair verified profiles with tiered subscriptions will deepen user loyalty and lift recurring revenue across emerging digital economies.
- Rahul Pandita, Principal Consultant, Future Market Insights.
Major Market Trends and Insights
- Subscription Revenue Rewards Payer Quality Over Payer Volume: Dating apps now earn growth from tier design and regional rollout rather than raw payer counts because a lower priced entry tier converts new markets faster while premium tiers protect yield. FMI projects subscriptions to rise from 62.0% share in 2026 to 63.9% by 2036 at a 4.8% CAGR. Match Group (November 2026) reports in its Form 10-Q that Hinge payers grew 23% to 2.3 million on European expansion while revenue per payer eased 3% to USD 31.81 after a lower priced tier test. Tinder lifted revenue per payer 2% on a 4% smaller payer base. Subscription mix now decides margin more than download volume.
- Ofcom Age Assurance Rules Raise Onboarding Standards for Dating Apps: UK rules make dating operators responsible for verifying adult users and that adds vendor cost and onboarding steps for every new sign up. Ofcom (July 2026) found that over one in ten 15 to 17-year-olds still used three of the most used dating apps in December 2025 despite existing age checks. The regulator now expects a challenge age step and liveness detection after publishing dating industry guidance on 18 May 2026. Operators must also run regular due diligence on third party verification vendors and meet privacy duties. Verification spend becomes a fixed cost that favors scaled operators able to spread it across large payer bases.
- Bumble Concentrates Spend on Higher Value Members Over Raw Volume: Operators with limited acquisition budgets now direct performance marketing toward members likely to convert at higher tiers instead of chasing every download. Bumble Inc. (November 2026) states in its Form 10-Q that it optimizes marketing to acquire high quality incremental members. Bumble App ended the quarter with 1.99 million paying users at USD 28.02 ARPPU and the group reported 3.08 million total paying users at USD 22.14 ARPPU. Total revenue reached USD 207.1 million against USD 246.2 million a year earlier. Pricing power per member now carries more weight than user counts in this segment and rewards products that convert early.
What Are the Main Drivers, Restraints, and Opportunities?
Premium subscription tiers and Hinge-led international expansion lift revenue per payer while payer rebalancing at legacy brands and subscription and age-check duties shape volume and that mix lets AI-assisted verified premium tiers widen revenue at a measured pace.
Driver: Premium Subscription Tiers Lift Revenue per Paying User
Recurring premium tiers turn engaged daters into predictable revenue since subscriptions hold 62.0% of 2026 revenue and link dating apps to the wider subscription economy billing model. Grindr (November 2026) reported 1.4 million average paying users up 11% and ARPPU of USD 27.15 up 10% in the third quarter. Match Group (August 2026) recorded 22% Hinge revenue growth and entered six new European countries during the second quarter of 2026. Both patterns suggest that tier depth and geographic reach let Match Group and Grindr raise revenue per payer in the USA and Europe ahead of any broader volume rebound.
Restraint: Subscription Compliance Duties and Payer Rebalancing Shape Monetization Pace
Consumer protection and age assurance rules lengthen review cycles for every pricing or sign-up change because identity verification steps must satisfy regulators in each launch country. Bumble (November 2026) reported 3.08 million total paying users for the third quarter of 2026 or 14.0% below the prior year with Bumble App ARPPU at USD 28.02. The Federal Trade Commission (August 2025) secured USD 14 million from Match Group and required simpler cancellation on Match.com subscriptions. Subscription-led operators such as Match Group and Bumble therefore budget for compliance engineering and retention offers that moderate near-term margin expansion across the USA.
Opportunity: Verified AI Premium Tiers Open Higher-Value Revenue Pools
Premium tiers that pair recommendation AI with verified identity lift revenue per payer inside the wider mobile application ecosystem as brands compete on trust. Grindr (November 2026) launches its AI-powered Edge tier at USD 120 per month and drew nearly 400000 early registrations in 72 hours. Ofcom (July 2026) recorded highly effective age checks reaching 43% of children asked to prove age by January 2026 from 25% in July 2025. FMI projects dating apps at a 4.5% CAGR from USD 5.8 billion in 2026 to USD 9.0 billion by 2036. Operators pairing verification with AI-led premium tiers can capture part of the added USD 3.2 billion.
How Is the Online Dating Application Market Segmented?
The global online dating application market is segmented by revenue type and app type and age group and payer tier.
| Segmentation Axis | Sub-Segments Covered | 2026 Leading Segment and Share | Main Growth Benchmark (2026 to 2036) |
|---|---|---|---|
| Revenue Type | Subscriptions / In-App Purchases and Boosts / Advertising / Events and Other | Subscriptions (62.0% revenue share) | Subscriptions share rises to 63.9% by 2036 at 4.8% CAGR |
| App Type | Mainstream Swipe-Based / Niche and Community / Relationship and Marriage Focused / Video and Social Discovery | Mainstream Swipe-Based (52.0% revenue share) | Mainstream Swipe-Based grows at 4.7% CAGR |
| Age Group | 25 to 34 Years / 18 to 24 Years / 35 to 44 Years / 45 Years and Above | 25 to 34 Years (38.0% revenue share) | 25 to 34 Years grows at 4.7% CAGR |
| Payer Tier | Basic Premium / Mid Tier / Top Tier / Pay-Per-Feature | Basic Premium (56.0% revenue share) | Basic Premium grows at 4.7% CAGR |
Source. Future Market Insights analysis of the Online Dating Application Market 2026.
Why Do Subscriptions Lead by Revenue Type?
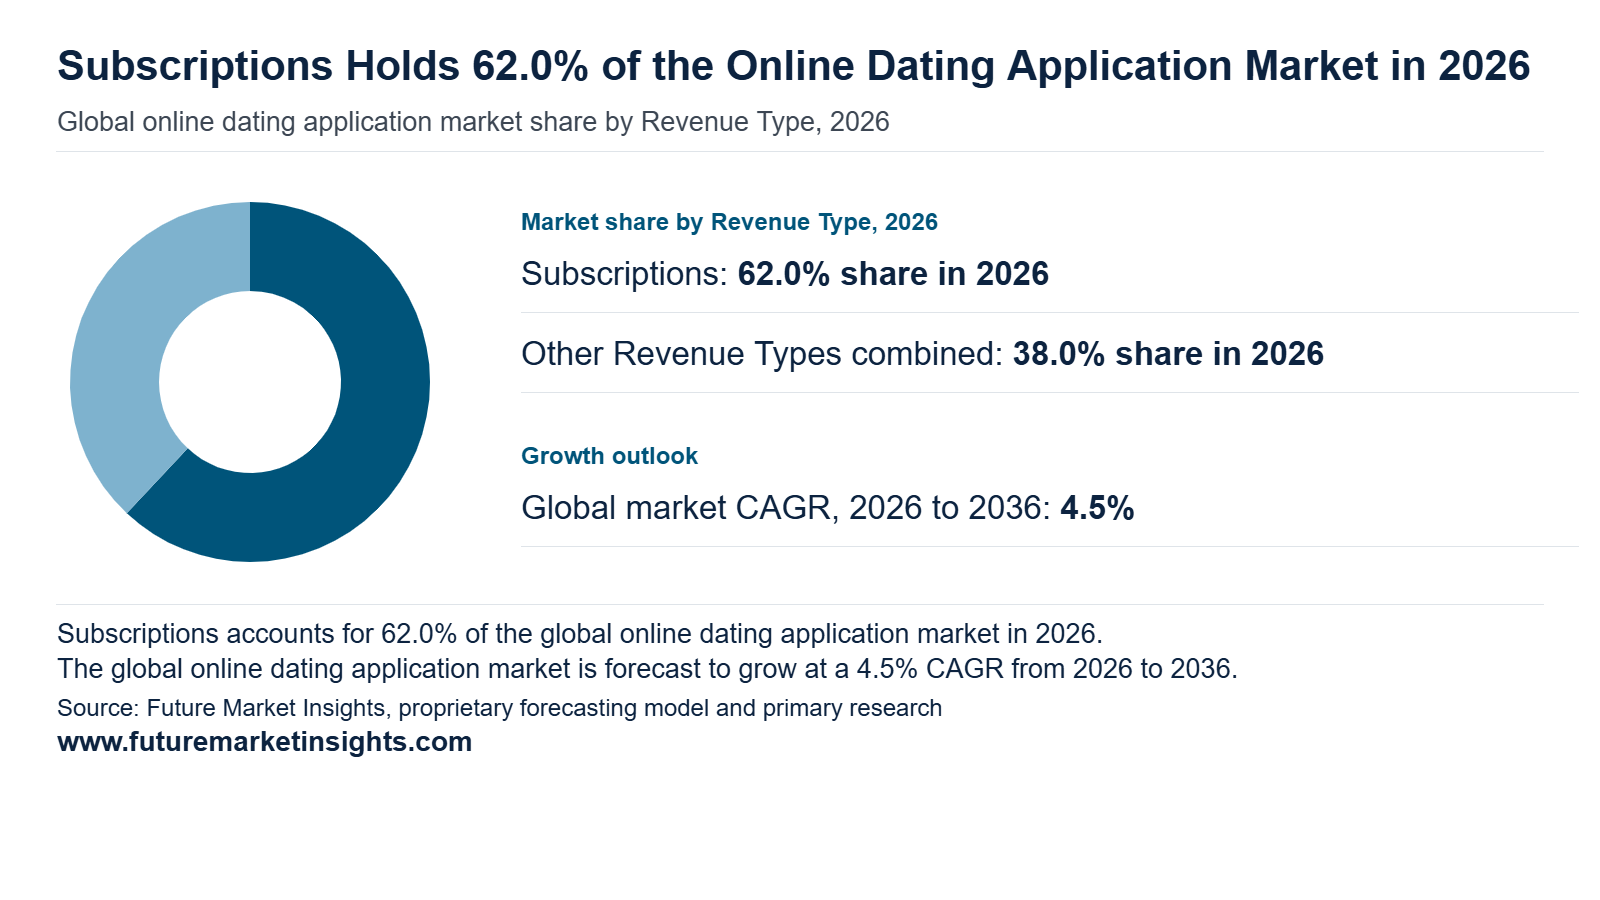
Subscriptions lead the online dating application market by revenue type with a 62.0% share in 2026 and are projected to reach 63.9% by 2036 at a 4.8% CAGR. Match Group and Bumble convert free users into recurring plans that mirror the subscription economy through tiered features such as unlimited likes and advanced filters billed monthly through the Apple App Store and Google Play. Predictable renewals support marketing budgets and steady revenue across seasons. In-app purchases and boosts monetize short bursts of visibility while advertising serves free tiers and events and other revenue captures offline meetups that deepen engagement.
Why Does Mainstream Swipe-Based Lead by App Type?
Mainstream swipe-based apps hold a 52.0% share by app type in 2026 and grow at a 4.7% CAGR. Tinder and Bumble and Tantan benefit from large user pools that raise match probability and keep sign-ups flowing. Video and social discovery apps borrowing from video streaming habits pull younger users toward live interaction and push mainstream platforms to test similar formats. Network scale lets these platforms test profile prompts and verification badges across millions of users before wider release. Niche and community apps such as Grindr and Muzz win loyalty through shared identity while relationship and marriage focused apps such as Shaadi.com and eharmony serve intent-led users.
Why Does the 25 to 34 Years Group Lead by Age Group?
Users aged 25 to 34 years account for a 38.0% share by age group in 2026 and grow at a 4.7% CAGR. This cohort combines steady salaries with later marriage timelines in the United States and China and Western Europe. Longer app tenure makes these users more willing to pay for filters and visibility. Hinge targets them with intention-led prompts and date planning features. Younger users aged 18 to 24 years generate high download volumes while those aged 35 and above favor compatibility-focused matching. Rising disposable income in this cohort across Asia Pacific sustains premium conversion. Operators track this group closely when setting feature roadmaps.
Why Does Basic Premium Lead by Payer Tier?
Basic premium leads payer tiers with a 56.0% share in 2026 and grows at a 4.7% CAGR. Entry plans from Tinder and Bumble remove daily swipe caps and unlock core filters at price points suited to users in the United States and India and Brazil. Weekly and monthly commitment periods ease first-time conversion through app store billing. Mid tier subscribers add features such as read receipts and advanced discovery while top tier plans bundle priority visibility and concierge style services. Pay-per-feature spending lets occasional users buy boosts outside a plan. Upgrades across these tiers shape average revenue per payer.
Dating App Market by Region and Country (2026 to 2036)
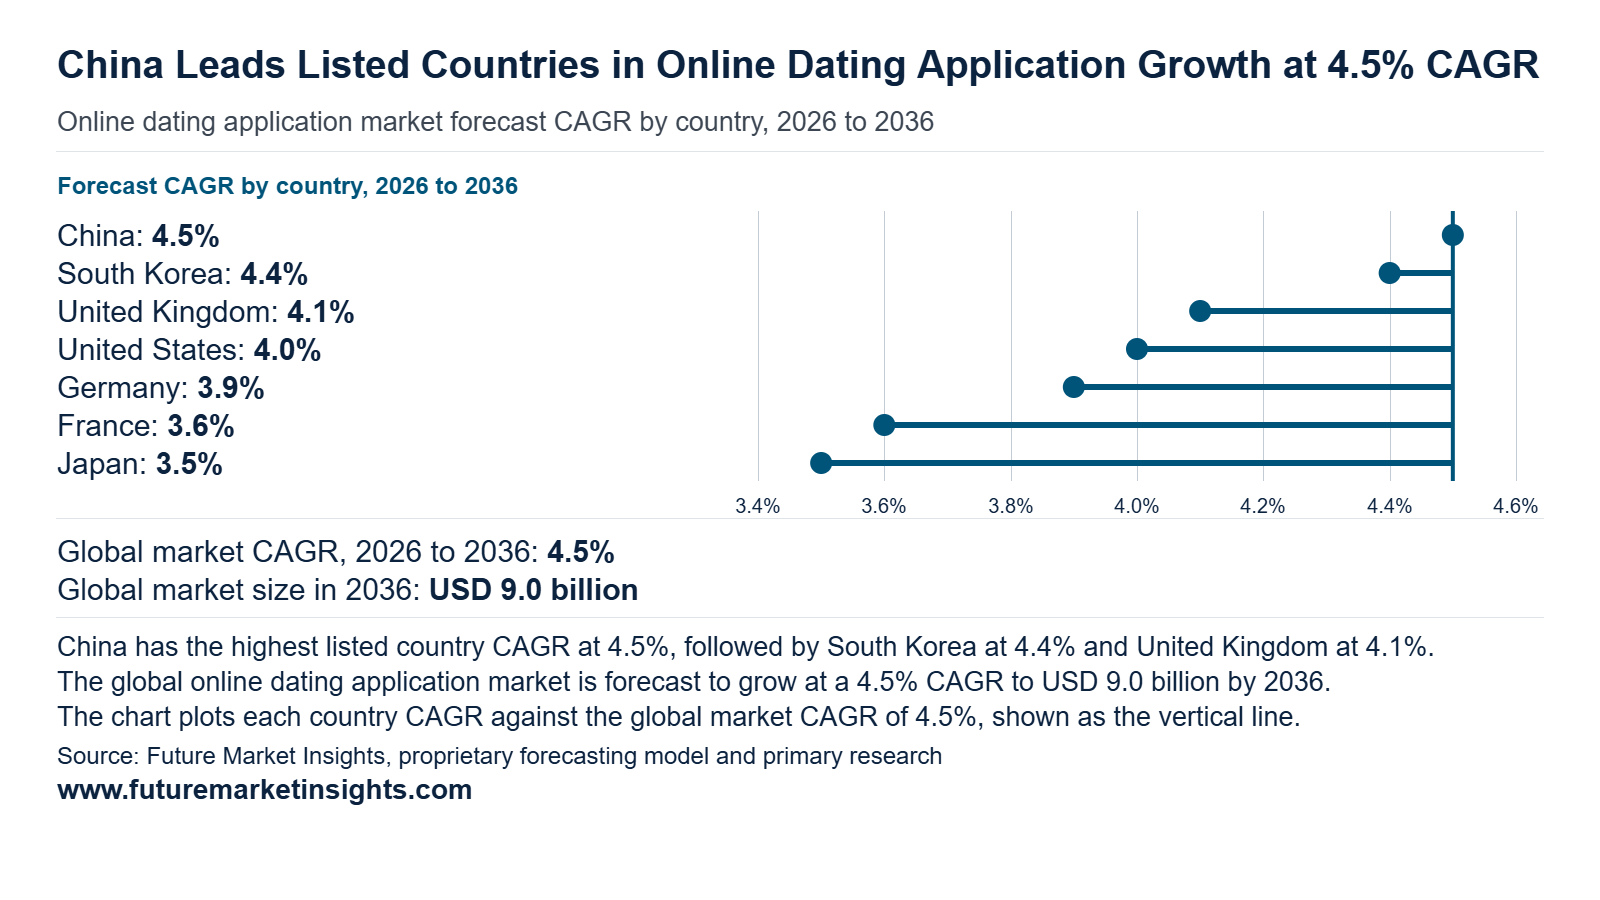
The seven profiled countries hold 69.0% of global dating app revenue in 2026 and 66.0% by 2036 as markets outside the group scale faster. Together they add USD 1.94 billion which equals about 60.6% of the USD 3.2 billion global increment. The United States contributes USD 947.0 million of that gain and China leads the growth ranking at 4.5%. Regulation in the United Kingdom and public matchmaking in Tokyo reveal that trust and verification now shape purchase decisions.
| Country | 2026 Revenue | 2036 Revenue | 10-Year Addition | 2026 to 2036 CAGR | Global Share (2026 → 2036) |
|---|---|---|---|---|---|
| China | USD 522.0 million | USD 810.7 million | +USD 288.7 million | 4.5% | 9.0% → 9.0% |
| South Korea | USD 203.0 million | USD 312.2 million | +USD 109.2 million | 4.4% | 3.5% → 3.5% |
| United Kingdom | USD 435.0 million | USD 650.1 million | +USD 215.1 million | 4.1% | 7.5% → 7.2% |
| United States | USD 1.97 billion | USD 2.92 billion | +USD 947.0 million | 4.0% | 34.0% → 32.4% |
| Germany | USD 348.0 million | USD 510.2 million | +USD 162.2 million | 3.9% | 6.0% → 5.7% |
| France | USD 203.0 million | USD 289.1 million | +USD 86.1 million | 3.6% | 3.5% → 3.2% |
| Japan | USD 319.0 million | USD 450.0 million | +USD 131.0 million | 3.5% | 5.5% → 5.0% |
Source: Future Market Insights analysis of the dating app market, 2026.
China
China posts the highest CAGR among the profiled countries at 4.5% and ranks as the fastest-growing country. Revenue moves from an assumed USD 522.0 million in 2026 to USD 810.7 million by 2036 and adds USD 288.7 million as share holds near 9.0%. A recovering payer base explains much of this strength. Hello Group (September 2026) reports that paying users on its core dating service reached 3.9 million in the second quarter of 2026 against 3.5 million a year earlier. The company also states that it is strengthening AI capabilities to improve user experience and monetization efficiency. AI led matching should lift revenue per payer across domestic subscription tiers and give Chinese platforms room to expand through 2036.
South Korea
South Korea follows at a 4.4% CAGR and holds the second position among the profiled countries. Revenue moves from an assumed USD 203.0 million in 2026 to USD 312.2 million by 2036 and adds USD 109.2 million while share holds near 3.5%. Renewed marriage momentum supports this pace. The Ministry of Data and Statistics (March 2026) recorded about 240 thousand marriages in 2025 which is 8.1% above 2024. The mean age at first marriage stands at 33.9 years for men and 31.6 years for women and this extends the period in which single adults search for partners. Marriage minded users aged 25 to 34 should therefore move from casual browsing toward premium tiers across domestic and global apps through 2036.
United Kingdom
The United Kingdom moves at a 4.1% CAGR and ranks third among the profiled countries. Revenue moves from an assumed USD 435.0 million in 2026 to USD 650.1 million by 2036 and adds USD 215.1 million as share eases from 7.5% to 7.2%. Regulation sets the pace of adoption. Under the Online Safety Act Ofcom (July 2026) found over one in ten 15 to 17 year olds on three popular dating apps in December 2025. Ofcom requires dating services to follow its age assurance guidance in full. It expects many to add an extra age confirmation step and liveness detection. Children meeting highly effective age checks rose from 25% to 43% between July 2025 and January 2026. Verified age assurance builds trust among adult subscribers and should convert British users into paid tiers with lower churn through 2036.
United States
The United States anchors the market with a 34.0% share in 2026 and advances at a 4.0% CAGR that places it fourth among the profiled countries. Revenue moves from an assumed USD 1.97 billion to USD 2.92 billion by 2036 and adds USD 947.0 million as share settles at 32.4%. Payer economics drive this scale. Match Group (August 2026) reports that revenue per payer rose 6% to USD 21.13 across 13.3 million payers while its relationship focused app grew revenue 22%. American subscribers trade up to higher priced tiers and younger adults add to the payer base. This combination keeps the largest national base compounding through 2036 and sustains the biggest absolute gain among all profiled countries.
Germany
Germany records a 3.9% CAGR and ranks fifth among the profiled countries. Revenue rises from an assumed USD 348.0 million in 2026 to USD 510.2 million by 2036 and adds USD 162.2 million while share settles from 6.0% to 5.7%. Household structure underpins the demand. The Federal Statistical Office (April 2026) shows that one-person households made up 42.1% of 41.1 million households in 2025 against 42.3% in 2024. This large pool of adults living alone sustains partner search in cities such as Berlin and Hamburg where busy work schedules and dispersed social circles favor app based introductions. Paid conversion should move toward relationship oriented subscription tiers as single adults seek lasting matches over the forecast years.
France
France ranks sixth among the profiled countries with a 3.6% CAGR. Revenue moves from an assumed USD 203.0 million in 2026 to USD 289.1 million by 2036 and adds USD 86.1 million while share eases from 3.5% to 3.2%. Appetite for relationship focused formats shapes this outlook. Match Group (August 2026) lists France among the European expansion markets where revenue for its relationship focused app grew 86% in the second quarter of 2026. The app also held the top download position in aggregate across these markets. This pattern shows French adults moving toward dating services that signal serious intent over casual browsing. Marriage minded adults and younger relationship seekers should therefore support gradual premium conversion across the French market through 2036.
Japan
Japan closes the ranking at a 3.5% CAGR with revenue moving from an assumed USD 319.0 million in 2026 to USD 450.0 million by 2036. The addition of USD 131.0 million comes while share settles from 5.5% to 5.0%. Public sector involvement shapes this outlook. The Tokyo Metropolitan Government (October 2026) reports about 41 thousand cumulative applications to its AI matching system as of 31 October 2026. Members submit photo identification plus a certificate of single status and income verification and pay 11 thousand yen for two years of access. Verified marriage intent services raise trust expectations and push private apps toward identity checks and marriage oriented subscription features. Value per payer should therefore rise faster than user counts through 2036.
Competitive Environment and Notable Companies
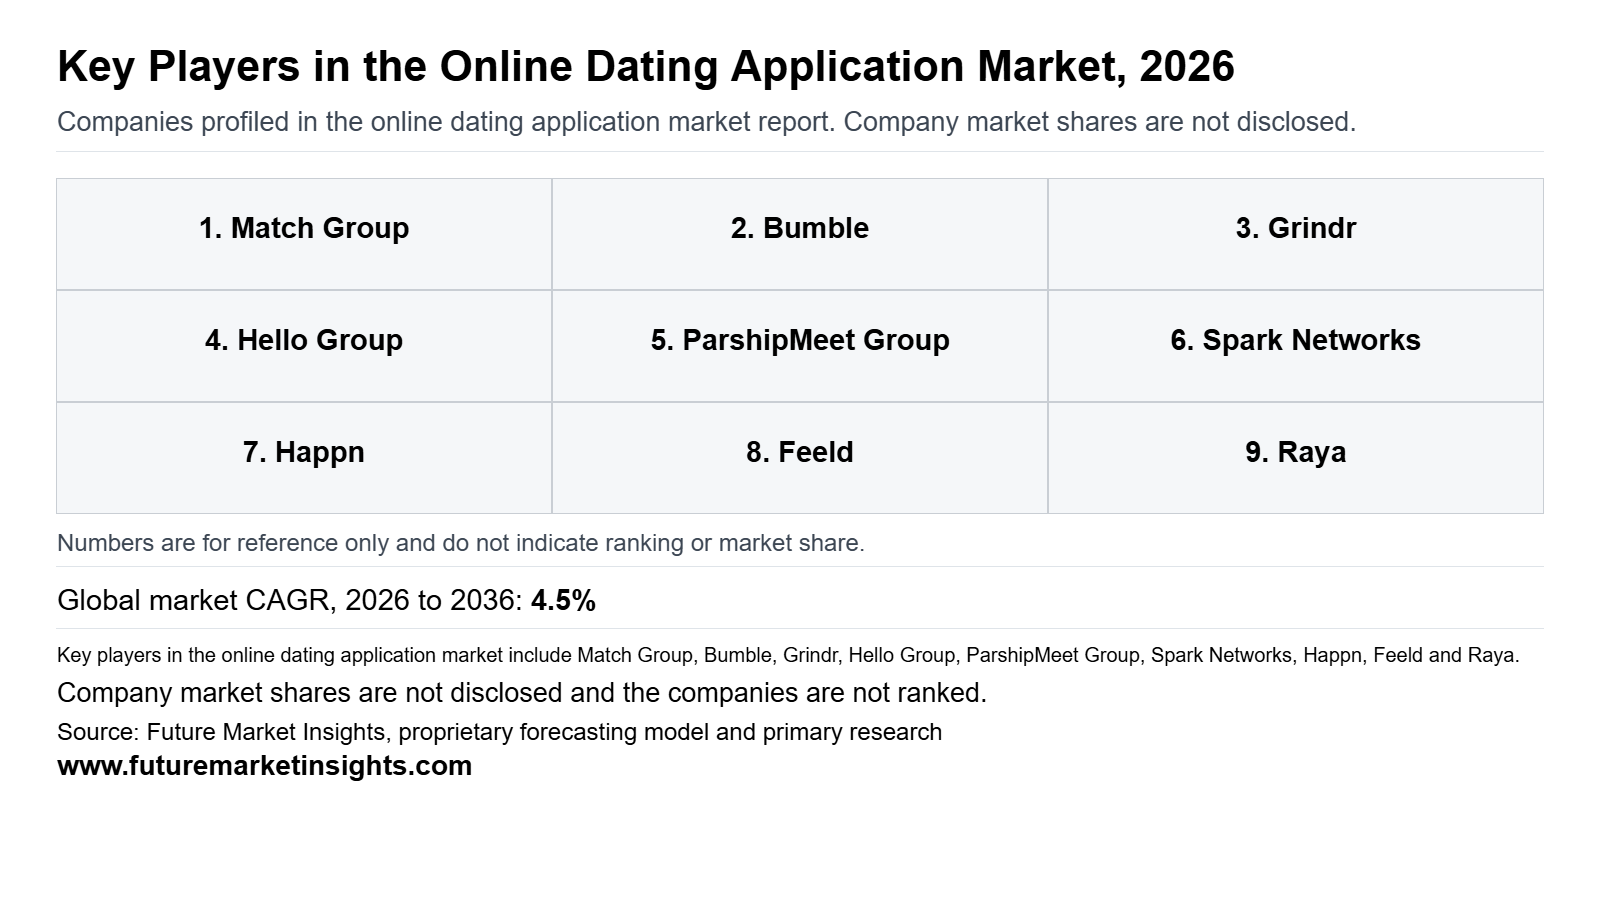
Notable companies operating in the global online dating application market include Match Group, Bumble, Grindr, Hello Group, ParshipMeet Group, Spark Networks, Happn, Feeld, Raya, and Coffee Meets Bagel. Competition operates at two structural levels. Multi-brand portfolio owners compete on subscriber scale, AI-led discovery, identity verification, and app store marketing reach. Niche specialists compete on community identity, curation, exclusivity, and relationship intent, where loyal cohorts support premium pricing. Because Hinge and Hello Group are scaling fastest outside their home markets, regional licensing, distribution, and brand partnerships offer clear scope for growth beyond the core countries.
How Are Companies Positioned in the Online Dating Application Market?
Match Group anchors the field as leader and a portfolio that spans Tinder for casual discovery and Hinge for intentional dating. Its FY2025 revenue reached USD 3.5 billion and revenue per payer rose 5% to USD 20.09 (Match Group, February 2026). Bumble agreed to an all-cash sale to Ithaca Holdings that values the company at USD 1.3 billion (Bumble, October 2026), which places the brand under new ownership. Hello Group operates Tantan as a leading social and dating application (Hello Group, September 2026). Grindr builds around its LGBTQ+ community, while ParshipMeet Group, Feeld, Raya, and Coffee Meets Bagel serve matchmaking, non-monogamous, membership, and curated segments.
What Matters When a Buyer Selects an Online Dating Application Supplier?
Subscribers and advertising partners choose dating applications on match quality and safety because both drive conversion into paid tiers. Match Group (February 2026) reported that Face Check facial verification cut interactions with bad actors by more than 50% in markets where it has rolled out with minimal revenue impact. Match Group (November 2026) added that Tinder daily active users returned to year over year growth in September 2026 for the first time in more than three years. Spark Networks (November 2025) positions its four brands on a unified platform that supports better matching and stronger security. Verification therefore works as both a retention lever and a pricing defense.
Which Capabilities Distinguish Product Offers?
Offers diverge across health services, regional launches, and premium service layers. Grindr (September 2026) agreed to acquire the parent of Freddie for USD 250 million in total consideration to bring PrEP access into the Grindr app through Grindr Health. Match Group (February 2026) reported that Hinge launched in Mexico and Brazil in 2025 and became the second most downloaded dating app in both by December. Spark Networks (November 2025) expanded premium offerings to include matchmaking and dating coaching. These layers lift revenue per payer without depending on new user volume.
How Does Geographic Reach Affect Competition?
Most portfolios remain anchored in the United States and Western Europe while growth shifts outward. Hello Group overseas revenue rose 52.0% to RMB672.7 million in the second quarter of 2026 on audio and video products in MENA and dating brands beyond MENA (Hello Group, September 2026). Match Group (February 2026) reported that Hinge monthly active users in European expansion markets rose nearly 50% in FY2025. Hello Group also names Happn and Soulchill among niche apps added since 2019 through incubation and acquisition, which gives it entry points in new regions without building brands from scratch.
| Verified Company Evidence (2026) | Commercial Effect | Buyer Action |
|---|---|---|
| 13 October 2026 Bumble announced an all-cash acquisition by Ithaca Holdings at USD 6.05 per share valuing Bumble at USD 1.3 billion [Bumble (October 2026)]. | Moves the brand to private ownership with Ithaca co-CEOs while the founder stays actively involved. | Review advertising and partnership terms with Bumble for roadmap changes after closing. |
| 30 September 2026 Grindr agreed to acquire the parent of Freddie for USD 250 million with closing expected in Q4 2026 [Grindr (September 2026)]. | Adds telehealth revenue beyond subscriptions and deepens daily use of the app. | Assess health service partnerships and advertising adjacency within Grindr. |
| 3 February 2026 Match Group reported that Face Check cut interactions with bad actors by more than 50% where rolled out [Match Group (February 2026)]. | Raises trust and protects conversion into paid tiers. | Benchmark verification standards when vetting platform partners. |
Source: Verified corporate disclosures and Future Market Insights analysis, 2026.
| Company | Core Positioning | Verified Activity & Source Attribution |
|---|---|---|
| Match Group | Multi-brand portfolio led by Tinder and Hinge | FY2025 revenue of USD 3.5 billion (Match Group, February 2026). Tinder daily active users returned to growth in September 2026 (Match Group, November 2026). |
| Bumble | Mobile-first dating and friendship apps | Agreed on 13 October 2026 to be acquired by Ithaca Holdings at USD 1.3 billion (Bumble, October 2026). |
| Grindr | LGBTQ+ social network extending into health services | Agreed to acquire the parent of Freddie for USD 250 million (Grindr, September 2026). |
| Hello Group | Tantan and an overseas portfolio including Happn | Overseas revenue up 52.0% to RMB672.7 million in Q2 2026 (Hello Group, September 2026). |
| ParshipMeet Group | Matchmaking brands including eharmony and Parship | Positioning only. No verifiable recent activity located. |
| Spark Networks | EliteSingles, SilverSingles, Christian Mingle, and Jdate | Moved four brands to one new technology platform on 6 November 2025 (Spark Networks, November 2025). |
| Happn | Niche app for meeting people nearby | Named by Hello Group among niche apps added through incubation and acquisition (Hello Group, September 2026). |
| Feeld | Community app for curious and non-monogamous daters | Positioning only. No verifiable recent activity located. |
| Raya | Membership-based network with application vetting | Positioning only. No verifiable recent activity located. |
| Coffee Meets Bagel | Curated daily-match dating app | Positioning only. No verifiable recent activity located. |
Source: Verified corporate disclosures and Future Market Insights analysis, 2026.
Online Dating Application Market Report Scope and Research Methodology
FMI sizes the online dating application market by multiplying paying users in each country by the average revenue earned per payer across subscription and in-app purchase tiers. Country results are cross-checked against national app store spending totals and operator disclosures. Subscriptions anchor the model because they generate the largest share of revenue and recur predictably across payer tiers. Weekly and quarterly and annual plans convert to monthly paying user equivalents so every plan sits on one volume basis. Revenue is counted in the country where the paying user is located. Segment and country figures sum to the global total in every year. Company disclosures verify product positioning and payer mix rather than estimate proprietary company revenue.
| Coverage Field | Report Scope |
|---|---|
| Market definition | Revenue from subscriptions and in-app purchases and boosts and advertising and events earned by online dating applications on mobile and web platforms. |
| Product types | Mainstream swipe-based apps / niche and community apps / relationship and marriage focused apps / video and social discovery apps |
| Variants | Basic premium / mid tier / top tier / pay-per-feature access |
| Ingredients or materials included | Matching software and messaging and video features and profile verification and paid visibility tools |
| Packaging formats | Weekly and monthly and quarterly and annual subscription plans / one-time boosts and consumables / ad placements |
| Distribution channels | Apple App Store / Google Play / direct web sign-up / carrier and regional app stores |
| End users | Singles aged 18 to 24 / 25 to 34 / 35 to 44 / 45 and above |
| Exclusions | Offline matchmaking agencies / general social networks without dedicated dating features / dating hardware / independent event organizers |
| Quantitative units | USD billion for value and paying user months for volume |
| Volume basis | Monthly paying user equivalents with weekly and quarterly and annual plans converted to monthly terms |
| Value basis | Revenue from paying users in each country counted where the user is located |
| Regions covered | North America / Latin America / Western Europe / Eastern Europe / East Asia / South Asia and Pacific / Middle East and Africa |
| National coverage | United States / United Kingdom / Germany / Japan / France / China / South Korea |
| Companies covered | Match Group / Bumble / Grindr / Hello Group / ParshipMeet Group / Spark Networks / Happn / Feeld / Raya / Coffee Meets Bagel |
Source: Future Market Insights analysis of the online dating application market, 2026.
Research Sources and Bibliography
- Bumble Inc. (October 2026). Bumble Inc. to Be Acquired by Ithaca Holdings, the Long-Term Holding Company for Enduring Technology Businesses [Press release, 13 October 2026]. https://ir.bumble.com/news/news-details/2026/Bumble-Inc--to-Be-Acquired-by-Ithaca-Holdings-the-Long-Term-Holding-Company-for-Enduring-Technology-Businesses/default.aspx
- Bumble Inc. (November 2026). Form 10-Q for the quarter ended September 30, 2026 [SEC filing]. https://www.sec.gov/Archives/edgar/data/0001830043/000183004326000123/bmbl-20260930.htm
- Federal Trade Commission (August 2025). Match Group Agrees to Pay $14 Million, Permanently Stop Deceptive Advertising, Cancellation, and Billing Practices to Resolve FTC Charges [press release, August 12, 2025]. https://www.ftc.gov/news-events/news/press-releases/2025/08/match-group-agrees-pay-14-million-permanently-stop-deceptive-advertising-cancellation-billing
- Grindr Inc. (November 2026). Grindr Q3 2026 Letter to Shareholders [shareholder letter, November 5, 2026]. https://www.sec.gov/Archives/edgar/data/0001820144/000182014426000039/shl2026_q3.htm
- Grindr Inc. (September 2026). Grindr to Acquire Freddie, Expanding Access to HIV Prevention for Millions of Users [Press release, 30 September 2026]. https://www.sec.gov/Archives/edgar/data/1820144/000182014426000033/exhibit991-pressreleasedat.htm
- Hello Group Inc. (September 2026). Hello Group Inc. Announces Unaudited Financial Results for the Second Quarter of 2026 [press release, 3 September 2026]. https://ir.hellogroup.com/news-releases/news-release-details/hello-group-inc-announces-unaudited-financial-results-second-4
- Match Group (November 2026). Form 10-Q for the quarterly period ended 30 September 2026 [SEC filing, 2 November 2026]. https://www.sec.gov/Archives/edgar/data/0000891103/000089110326000163/mtch-20260930.htm
- Match Group (February 2026). Match Group Announces Fourth Quarter and Full-Year Results [Press release, 3 February 2026]. https://ir.mtch.com/investor-relations/news-events/news-events/news-details/2026/Match-Group-Announces-Fourth-Quarter-and-Full-Year-Results/
- Match Group (August 2026). Match Group Announces Second Quarter Results [press release, 4 August 2026]. https://ir.mtch.com/investor-relations/news-events/news-events/news-details/2026/Match-Group-Announces-Second-Quarter-Results/default.aspx
- Match Group (November 2026). Match Group Announces Third Quarter Results [Press release, 2 November 2026]. https://ir.mtch.com/investor-relations/news-events/news-events/news-details/2026/Match-Group-Announces-Third-Quarter-Results/
- Ministry of Data and Statistics, Republic of Korea (March 2026). Marriage and Divorce Statistics in 2025 [press release, 19 March 2026]. https://mods.go.kr/board.es?mid=a20108110000&bid=11774&tag=&act=view&list_no=445185&ref_bid=
- Ofcom (July 2026). Age checks helping make online experiences safer for UK children but job not done and tech industry must act to strengthen protections [regulator publication, 15 July 2026]. https://www.ofcom.org.uk/online-safety/protecting-children/age-checks-helping-make-online-experiences-safer-for-uk-children-but-job-not-done-and-tech-industry-must-act-to-strengthen-protections
- Ofcom (May 2026). Dating and social discovery: know the online safety risks, rules and how to comply. https://www.ofcom.org.uk/online-safety/illegal-and-harmful-content/dating-and-social-discovery-know-the-online-safety-risks-rules-and-how-to-comply
- Spark Networks (November 2025). Spark Networks Launches Major Technology Platform Overhaul for EliteSingles, SilverSingles, Christian Mingle and Jdate [Press release, 6 November 2025]. https://www.spark.net/news-media/7i3xdgh4s1ul7c4db1sai5xpyg6pxr-299ta
- Statistisches Bundesamt (Destatis) (April 2026). Households, by type of household [table, 13 April 2026]. https://www.destatis.de/EN/Themes/Society-Environment/Population/Households-Families/Tables/households.html
- Tokyo Metropolitan Government (October 2026). AI Matching System, TOKYO Futari STORY [web page, data as of 31 October 2026]. https://www.futari-story.metro.tokyo.lg.jp/ai-matching/
Table of Content
- Key Takeaways
- Market Size and CAGR
- Top Growth Driver
- Fastest Growing Segment
- Leading Region
- Key Companies
- Emerging Opportunities
- Executive Summary
- Global Market Outlook
- Demand-side Trends
- Supply-side Trends
- Technology Roadmap Analysis
- Analysis and Recommendations
- Analyst Perspective (What is happening? Why now? What should investors know?)
- Key Questions Answered
- How large is the market?
- What is the CAGR?
- What are key trends?
- Which region dominates?
- Who are the leaders?
Read More...
- Market Overview
- Market Coverage / Taxonomy
- Market Definition / Scope / Limitations
- Research Methodology
- Chapter Orientation
- Analytical Lens and Working Hypotheses
- Market Structure, Signals, and Trend Drivers
- Benchmarking and Cross-market Comparability
- Market Sizing, Forecasting, and Opportunity Mapping
- Research Design and Evidence Framework
- Desk Research Programme (Secondary Evidence)
- Expert Input and Fieldwork (Primary Evidence)
- Tooling, Models, and Reference Databases
- Data Engineering and Model Build
- Quality Assurance and Audit Trail
- Market Background
- Market Dynamics (Drivers, Restraints, Opportunity, Trends)
- Scenario Forecast (Optimistic, Likely, Conservative)
- Impact Analysis
- AI Impact
- Sustainability Impact
- Regulatory Impact
- Technology Impact
- Consumer / Buyer Analysis
- Purchase Drivers
- Adoption Barriers
- Buyer Journey
- Opportunity Map Analysis
- Product Life Cycle Analysis
- Supply Chain Analysis
- Investment Feasibility Matrix
- Value Chain Analysis
- PESTLE and Porter's Analysis
- Regulatory Landscape
- Regional Parent Market Outlook
- Production and Consumption Statistics
- Import and Export Statistics
- Global Market Analysis and Forecast, 2021 to 2036
- Historical Market Size Value (USD Billion) Analysis, 2021 to 2025
- Current and Future Market Size Value (USD Billion) Projections, 2026 to 2036
- Y-o-Y Growth Trend Analysis
- Absolute $ Opportunity Analysis
- Global Market Pricing Analysis, 2021 to 2036
- Global Market Analysis and Forecast, By Revenue Type, 2021 to 2036
- Introduction / Key Findings
- Historical Market Size Value (USD Billion) Analysis By Revenue Type, 2021 to 2025
- Current and Future Market Size Value (USD Billion) Analysis and Forecast By Revenue Type, 2026 to 2036
- Subscriptions
- In-App Purchases and Boosts
- Advertising
- Events and Other
- Y-o-Y Growth Trend Analysis By Revenue Type, 2021 to 2025
- Absolute $ Opportunity Analysis By Revenue Type, 2026 to 2036
- Global Market Analysis and Forecast, By App Type, 2021 to 2036
- Introduction / Key Findings
- Historical Market Size Value (USD Billion) Analysis By App Type, 2021 to 2025
- Current and Future Market Size Value (USD Billion) Analysis and Forecast By App Type, 2026 to 2036
- Mainstream Swipe-Based
- Niche and Community
- Relationship and Marriage Focused
- Video and Social Discovery
- Y-o-Y Growth Trend Analysis By App Type, 2021 to 2025
- Absolute $ Opportunity Analysis By App Type, 2026 to 2036
- Global Market Analysis and Forecast, By Age Group, 2021 to 2036
- Introduction / Key Findings
- Historical Market Size Value (USD Billion) Analysis By Age Group, 2021 to 2025
- Current and Future Market Size Value (USD Billion) Analysis and Forecast By Age Group, 2026 to 2036
- 25 to 34 Years
- 18 to 24 Years
- 35 to 44 Years
- 45 Years and Above
- Y-o-Y Growth Trend Analysis By Age Group, 2021 to 2025
- Absolute $ Opportunity Analysis By Age Group, 2026 to 2036
- Global Market Analysis and Forecast, By Payer Tier, 2021 to 2036
- Introduction / Key Findings
- Historical Market Size Value (USD Billion) Analysis By Payer Tier, 2021 to 2025
- Current and Future Market Size Value (USD Billion) Analysis and Forecast By Payer Tier, 2026 to 2036
- Basic Premium
- Mid Tier
- Top Tier
- Pay-Per-Feature
- Y-o-Y Growth Trend Analysis By Payer Tier, 2021 to 2025
- Absolute $ Opportunity Analysis By Payer Tier, 2026 to 2036
- Global Market Analysis and Forecast, By Region, 2021 to 2036
- Introduction
- Historical Market Size Value (USD Billion) Analysis By Region, 2021 to 2025
- Current Market Size Value (USD Billion) Analysis and Forecast By Region, 2026 to 2036
- North America
- Latin America
- Western Europe
- Eastern Europe
- East Asia
- South Asia and Pacific
- Middle East and Africa
- Market Attractiveness Analysis By Region
- North America Market Analysis and Forecast, By Country, 2021 to 2036
- Historical Market Size Value (USD Billion) Trend Analysis By Market Taxonomy, 2021 to 2025
- Market Size Value (USD Billion) Forecast By Market Taxonomy, 2026 to 2036
- By Country
- United States
- Canada
- By Revenue Type
- By App Type
- By Age Group
- By Payer Tier
- By Country
- Market Attractiveness Analysis
- By Country
- By Revenue Type
- By App Type
- By Age Group
- By Payer Tier
- Key Takeaways
- Latin America Market Analysis and Forecast, By Country, 2021 to 2036
- Historical Market Size Value (USD Billion) Trend Analysis By Market Taxonomy, 2021 to 2025
- Market Size Value (USD Billion) Forecast By Market Taxonomy, 2026 to 2036
- By Country
- Brazil
- Mexico
- Argentina
- Chile
- By Revenue Type
- By App Type
- By Age Group
- By Payer Tier
- By Country
- Market Attractiveness Analysis
- By Country
- By Revenue Type
- By App Type
- By Age Group
- By Payer Tier
- Key Takeaways
- Western Europe Market Analysis and Forecast, By Country, 2021 to 2036
- Historical Market Size Value (USD Billion) Trend Analysis By Market Taxonomy, 2021 to 2025
- Market Size Value (USD Billion) Forecast By Market Taxonomy, 2026 to 2036
- By Country
- Germany
- France
- United Kingdom
- Italy
- Spain
- Benelux
- Nordics
- By Revenue Type
- By App Type
- By Age Group
- By Payer Tier
- By Country
- Market Attractiveness Analysis
- By Country
- By Revenue Type
- By App Type
- By Age Group
- By Payer Tier
- Key Takeaways
- Eastern Europe Market Analysis and Forecast, By Country, 2021 to 2036
- Historical Market Size Value (USD Billion) Trend Analysis By Market Taxonomy, 2021 to 2025
- Market Size Value (USD Billion) Forecast By Market Taxonomy, 2026 to 2036
- By Country
- Poland
- Czech Republic
- Romania
- Hungary
- By Revenue Type
- By App Type
- By Age Group
- By Payer Tier
- By Country
- Market Attractiveness Analysis
- By Country
- By Revenue Type
- By App Type
- By Age Group
- By Payer Tier
- Key Takeaways
- East Asia Market Analysis and Forecast, By Country, 2021 to 2036
- Historical Market Size Value (USD Billion) Trend Analysis By Market Taxonomy, 2021 to 2025
- Market Size Value (USD Billion) Forecast By Market Taxonomy, 2026 to 2036
- By Country
- China
- Japan
- South Korea
- By Revenue Type
- By App Type
- By Age Group
- By Payer Tier
- By Country
- Market Attractiveness Analysis
- By Country
- By Revenue Type
- By App Type
- By Age Group
- By Payer Tier
- Key Takeaways
- South Asia and Pacific Market Analysis and Forecast, By Country, 2021 to 2036
- Historical Market Size Value (USD Billion) Trend Analysis By Market Taxonomy, 2021 to 2025
- Market Size Value (USD Billion) Forecast By Market Taxonomy, 2026 to 2036
- By Country
- India
- ASEAN
- Australia and New Zealand
- By Revenue Type
- By App Type
- By Age Group
- By Payer Tier
- By Country
- Market Attractiveness Analysis
- By Country
- By Revenue Type
- By App Type
- By Age Group
- By Payer Tier
- Key Takeaways
- Middle East and Africa Market Analysis and Forecast, By Country, 2021 to 2036
- Historical Market Size Value (USD Billion) Trend Analysis By Market Taxonomy, 2021 to 2025
- Market Size Value (USD Billion) Forecast By Market Taxonomy, 2026 to 2036
- By Country
- GCC Countries
- South Africa
- Türkiye
- Israel
- By Revenue Type
- By App Type
- By Age Group
- By Payer Tier
- By Country
- Market Attractiveness Analysis
- By Country
- By Revenue Type
- By App Type
- By Age Group
- By Payer Tier
- Key Takeaways
- Key Countries Market Analysis
- United States
- Pricing Analysis
- Market Share Analysis, 2025
- By Revenue Type
- By App Type
- By Age Group
- By Payer Tier
- Canada
- Pricing Analysis
- Market Share Analysis, 2025
- By Revenue Type
- By App Type
- By Age Group
- By Payer Tier
- Brazil
- Pricing Analysis
- Market Share Analysis, 2025
- By Revenue Type
- By App Type
- By Age Group
- By Payer Tier
- Mexico
- Pricing Analysis
- Market Share Analysis, 2025
- By Revenue Type
- By App Type
- By Age Group
- By Payer Tier
- Argentina
- Pricing Analysis
- Market Share Analysis, 2025
- By Revenue Type
- By App Type
- By Age Group
- By Payer Tier
- Chile
- Pricing Analysis
- Market Share Analysis, 2025
- By Revenue Type
- By App Type
- By Age Group
- By Payer Tier
- Germany
- Pricing Analysis
- Market Share Analysis, 2025
- By Revenue Type
- By App Type
- By Age Group
- By Payer Tier
- France
- Pricing Analysis
- Market Share Analysis, 2025
- By Revenue Type
- By App Type
- By Age Group
- By Payer Tier
- United Kingdom
- Pricing Analysis
- Market Share Analysis, 2025
- By Revenue Type
- By App Type
- By Age Group
- By Payer Tier
- Italy
- Pricing Analysis
- Market Share Analysis, 2025
- By Revenue Type
- By App Type
- By Age Group
- By Payer Tier
- Spain
- Pricing Analysis
- Market Share Analysis, 2025
- By Revenue Type
- By App Type
- By Age Group
- By Payer Tier
- Benelux
- Pricing Analysis
- Market Share Analysis, 2025
- By Revenue Type
- By App Type
- By Age Group
- By Payer Tier
- Nordics
- Pricing Analysis
- Market Share Analysis, 2025
- By Revenue Type
- By App Type
- By Age Group
- By Payer Tier
- Poland
- Pricing Analysis
- Market Share Analysis, 2025
- By Revenue Type
- By App Type
- By Age Group
- By Payer Tier
- Czech Republic
- Pricing Analysis
- Market Share Analysis, 2025
- By Revenue Type
- By App Type
- By Age Group
- By Payer Tier
- Romania
- Pricing Analysis
- Market Share Analysis, 2025
- By Revenue Type
- By App Type
- By Age Group
- By Payer Tier
- Hungary
- Pricing Analysis
- Market Share Analysis, 2025
- By Revenue Type
- By App Type
- By Age Group
- By Payer Tier
- China
- Pricing Analysis
- Market Share Analysis, 2025
- By Revenue Type
- By App Type
- By Age Group
- By Payer Tier
- Japan
- Pricing Analysis
- Market Share Analysis, 2025
- By Revenue Type
- By App Type
- By Age Group
- By Payer Tier
- South Korea
- Pricing Analysis
- Market Share Analysis, 2025
- By Revenue Type
- By App Type
- By Age Group
- By Payer Tier
- India
- Pricing Analysis
- Market Share Analysis, 2025
- By Revenue Type
- By App Type
- By Age Group
- By Payer Tier
- ASEAN
- Pricing Analysis
- Market Share Analysis, 2025
- By Revenue Type
- By App Type
- By Age Group
- By Payer Tier
- Australia and New Zealand
- Pricing Analysis
- Market Share Analysis, 2025
- By Revenue Type
- By App Type
- By Age Group
- By Payer Tier
- GCC Countries
- Pricing Analysis
- Market Share Analysis, 2025
- By Revenue Type
- By App Type
- By Age Group
- By Payer Tier
- South Africa
- Pricing Analysis
- Market Share Analysis, 2025
- By Revenue Type
- By App Type
- By Age Group
- By Payer Tier
- Türkiye
- Pricing Analysis
- Market Share Analysis, 2025
- By Revenue Type
- By App Type
- By Age Group
- By Payer Tier
- Israel
- Pricing Analysis
- Market Share Analysis, 2025
- By Revenue Type
- By App Type
- By Age Group
- By Payer Tier
- United States
- Market Structure Analysis
- Competition Dashboard
- Competition Benchmarking
- Market Share Analysis of Top Players
- By Region
- By Revenue Type
- By App Type
- By Age Group
- By Payer Tier
- Emerging Startups
- Innovation Benchmarking
- Competition Analysis
- Competition Deep Dive
- Match Group
- Overview
- Product Portfolio
- Profitability by Market Segments
- Sales Footprint
- Strategy Overview
- Marketing Strategy
- Product Strategy
- Channel Strategy
- Bumble
- Grindr
- Hello Group
- ParshipMeet Group
- Spark Networks
- Happn
- Feeld
- Raya
- Coffee Meets Bagel
- Match Group
- Case Studies
- Success Stories
- Recent Developments
- Competition Deep Dive
- Assumptions & Acronyms Used
List of Tables
- Table 1: Global Market Value (USD Billion) Forecast by Region, 2021 to 2036
- Table 2: Global Market Value (USD Billion) Forecast by Revenue Type, 2021 to 2036
- Table 3: Global Market Value (USD Billion) Forecast by App Type, 2021 to 2036
- Table 4: Global Market Value (USD Billion) Forecast by Age Group, 2021 to 2036
- Table 5: Global Market Value (USD Billion) Forecast by Payer Tier, 2021 to 2036
- Table 6: North America Market Value (USD Billion) Forecast by Country, 2021 to 2036
- Table 7: North America Market Value (USD Billion) Forecast by Revenue Type, 2021 to 2036
- Table 8: North America Market Value (USD Billion) Forecast by App Type, 2021 to 2036
- Table 9: North America Market Value (USD Billion) Forecast by Age Group, 2021 to 2036
- Table 10: North America Market Value (USD Billion) Forecast by Payer Tier, 2021 to 2036
- Table 11: Latin America Market Value (USD Billion) Forecast by Country, 2021 to 2036
- Table 12: Latin America Market Value (USD Billion) Forecast by Revenue Type, 2021 to 2036
- Table 13: Latin America Market Value (USD Billion) Forecast by App Type, 2021 to 2036
- Table 14: Latin America Market Value (USD Billion) Forecast by Age Group, 2021 to 2036
- Table 15: Latin America Market Value (USD Billion) Forecast by Payer Tier, 2021 to 2036
- Table 16: Western Europe Market Value (USD Billion) Forecast by Country, 2021 to 2036
- Table 17: Western Europe Market Value (USD Billion) Forecast by Revenue Type, 2021 to 2036
- Table 18: Western Europe Market Value (USD Billion) Forecast by App Type, 2021 to 2036
- Table 19: Western Europe Market Value (USD Billion) Forecast by Age Group, 2021 to 2036
- Table 20: Western Europe Market Value (USD Billion) Forecast by Payer Tier, 2021 to 2036
- Table 21: Eastern Europe Market Value (USD Billion) Forecast by Country, 2021 to 2036
- Table 22: Eastern Europe Market Value (USD Billion) Forecast by Revenue Type, 2021 to 2036
- Table 23: Eastern Europe Market Value (USD Billion) Forecast by App Type, 2021 to 2036
- Table 24: Eastern Europe Market Value (USD Billion) Forecast by Age Group, 2021 to 2036
- Table 25: Eastern Europe Market Value (USD Billion) Forecast by Payer Tier, 2021 to 2036
- Table 26: East Asia Market Value (USD Billion) Forecast by Country, 2021 to 2036
- Table 27: East Asia Market Value (USD Billion) Forecast by Revenue Type, 2021 to 2036
- Table 28: East Asia Market Value (USD Billion) Forecast by App Type, 2021 to 2036
- Table 29: East Asia Market Value (USD Billion) Forecast by Age Group, 2021 to 2036
- Table 30: East Asia Market Value (USD Billion) Forecast by Payer Tier, 2021 to 2036
- Table 31: South Asia and Pacific Market Value (USD Billion) Forecast by Country, 2021 to 2036
- Table 32: South Asia and Pacific Market Value (USD Billion) Forecast by Revenue Type, 2021 to 2036
- Table 33: South Asia and Pacific Market Value (USD Billion) Forecast by App Type, 2021 to 2036
- Table 34: South Asia and Pacific Market Value (USD Billion) Forecast by Age Group, 2021 to 2036
- Table 35: South Asia and Pacific Market Value (USD Billion) Forecast by Payer Tier, 2021 to 2036
- Table 36: Middle East and Africa Market Value (USD Billion) Forecast by Country, 2021 to 2036
- Table 37: Middle East and Africa Market Value (USD Billion) Forecast by Revenue Type, 2021 to 2036
- Table 38: Middle East and Africa Market Value (USD Billion) Forecast by App Type, 2021 to 2036
- Table 39: Middle East and Africa Market Value (USD Billion) Forecast by Age Group, 2021 to 2036
- Table 40: Middle East and Africa Market Value (USD Billion) Forecast by Payer Tier, 2021 to 2036
List of Figures
- Figure 1: Global Market Pricing Analysis
- Figure 2: Global Market Value (USD Billion) Forecast 2021-2036
- Figure 3: Global Market Value Share and BPS Analysis by Revenue Type, 2026 and 2036
- Figure 4: Global Market Y-o-Y Growth Comparison by Revenue Type, 2026-2036
- Figure 5: Global Market Attractiveness Analysis by Revenue Type
- Figure 6: Global Market Value Share and BPS Analysis by App Type, 2026 and 2036
- Figure 7: Global Market Y-o-Y Growth Comparison by App Type, 2026-2036
- Figure 8: Global Market Attractiveness Analysis by App Type
- Figure 9: Global Market Value Share and BPS Analysis by Age Group, 2026 and 2036
- Figure 10: Global Market Y-o-Y Growth Comparison by Age Group, 2026-2036
- Figure 11: Global Market Attractiveness Analysis by Age Group
- Figure 12: Global Market Value Share and BPS Analysis by Payer Tier, 2026 and 2036
- Figure 13: Global Market Y-o-Y Growth Comparison by Payer Tier, 2026-2036
- Figure 14: Global Market Attractiveness Analysis by Payer Tier
- Figure 15: Global Market Value (USD Billion) Share and BPS Analysis by Region, 2026 and 2036
- Figure 16: Global Market Y-o-Y Growth Comparison by Region, 2026-2036
- Figure 17: Global Market Attractiveness Analysis by Region
- Figure 18: North America Market Incremental Dollar Opportunity, 2026-2036
- Figure 19: Latin America Market Incremental Dollar Opportunity, 2026-2036
- Figure 20: Western Europe Market Incremental Dollar Opportunity, 2026-2036
- Figure 21: Eastern Europe Market Incremental Dollar Opportunity, 2026-2036
- Figure 22: East Asia Market Incremental Dollar Opportunity, 2026-2036
- Figure 23: South Asia and Pacific Market Incremental Dollar Opportunity, 2026-2036
- Figure 24: Middle East and Africa Market Incremental Dollar Opportunity, 2026-2036
- Figure 25: North America Market Value Share and BPS Analysis by Country, 2026 and 2036
- Figure 26: North America Market Value Share and BPS Analysis by Revenue Type, 2026 and 2036
- Figure 27: North America Market Y-o-Y Growth Comparison by Revenue Type, 2026-2036
- Figure 28: North America Market Attractiveness Analysis by Revenue Type
- Figure 29: North America Market Value Share and BPS Analysis by App Type, 2026 and 2036
- Figure 30: North America Market Y-o-Y Growth Comparison by App Type, 2026-2036
- Figure 31: North America Market Attractiveness Analysis by App Type
- Figure 32: North America Market Value Share and BPS Analysis by Age Group, 2026 and 2036
- Figure 33: North America Market Y-o-Y Growth Comparison by Age Group, 2026-2036
- Figure 34: North America Market Attractiveness Analysis by Age Group
- Figure 35: North America Market Value Share and BPS Analysis by Payer Tier, 2026 and 2036
- Figure 36: North America Market Y-o-Y Growth Comparison by Payer Tier, 2026-2036
- Figure 37: North America Market Attractiveness Analysis by Payer Tier
- Figure 38: Latin America Market Value Share and BPS Analysis by Country, 2026 and 2036
- Figure 39: Latin America Market Value Share and BPS Analysis by Revenue Type, 2026 and 2036
- Figure 40: Latin America Market Y-o-Y Growth Comparison by Revenue Type, 2026-2036
- Figure 41: Latin America Market Attractiveness Analysis by Revenue Type
- Figure 42: Latin America Market Value Share and BPS Analysis by App Type, 2026 and 2036
- Figure 43: Latin America Market Y-o-Y Growth Comparison by App Type, 2026-2036
- Figure 44: Latin America Market Attractiveness Analysis by App Type
- Figure 45: Latin America Market Value Share and BPS Analysis by Age Group, 2026 and 2036
- Figure 46: Latin America Market Y-o-Y Growth Comparison by Age Group, 2026-2036
- Figure 47: Latin America Market Attractiveness Analysis by Age Group
- Figure 48: Latin America Market Value Share and BPS Analysis by Payer Tier, 2026 and 2036
- Figure 49: Latin America Market Y-o-Y Growth Comparison by Payer Tier, 2026-2036
- Figure 50: Latin America Market Attractiveness Analysis by Payer Tier
- Figure 51: Western Europe Market Value Share and BPS Analysis by Country, 2026 and 2036
- Figure 52: Western Europe Market Value Share and BPS Analysis by Revenue Type, 2026 and 2036
- Figure 53: Western Europe Market Y-o-Y Growth Comparison by Revenue Type, 2026-2036
- Figure 54: Western Europe Market Attractiveness Analysis by Revenue Type
- Figure 55: Western Europe Market Value Share and BPS Analysis by App Type, 2026 and 2036
- Figure 56: Western Europe Market Y-o-Y Growth Comparison by App Type, 2026-2036
- Figure 57: Western Europe Market Attractiveness Analysis by App Type
- Figure 58: Western Europe Market Value Share and BPS Analysis by Age Group, 2026 and 2036
- Figure 59: Western Europe Market Y-o-Y Growth Comparison by Age Group, 2026-2036
- Figure 60: Western Europe Market Attractiveness Analysis by Age Group
- Figure 61: Western Europe Market Value Share and BPS Analysis by Payer Tier, 2026 and 2036
- Figure 62: Western Europe Market Y-o-Y Growth Comparison by Payer Tier, 2026-2036
- Figure 63: Western Europe Market Attractiveness Analysis by Payer Tier
- Figure 64: Eastern Europe Market Value Share and BPS Analysis by Country, 2026 and 2036
- Figure 65: Eastern Europe Market Value Share and BPS Analysis by Revenue Type, 2026 and 2036
- Figure 66: Eastern Europe Market Y-o-Y Growth Comparison by Revenue Type, 2026-2036
- Figure 67: Eastern Europe Market Attractiveness Analysis by Revenue Type
- Figure 68: Eastern Europe Market Value Share and BPS Analysis by App Type, 2026 and 2036
- Figure 69: Eastern Europe Market Y-o-Y Growth Comparison by App Type, 2026-2036
- Figure 70: Eastern Europe Market Attractiveness Analysis by App Type
- Figure 71: Eastern Europe Market Value Share and BPS Analysis by Age Group, 2026 and 2036
- Figure 72: Eastern Europe Market Y-o-Y Growth Comparison by Age Group, 2026-2036
- Figure 73: Eastern Europe Market Attractiveness Analysis by Age Group
- Figure 74: Eastern Europe Market Value Share and BPS Analysis by Payer Tier, 2026 and 2036
- Figure 75: Eastern Europe Market Y-o-Y Growth Comparison by Payer Tier, 2026-2036
- Figure 76: Eastern Europe Market Attractiveness Analysis by Payer Tier
- Figure 77: East Asia Market Value Share and BPS Analysis by Country, 2026 and 2036
- Figure 78: East Asia Market Value Share and BPS Analysis by Revenue Type, 2026 and 2036
- Figure 79: East Asia Market Y-o-Y Growth Comparison by Revenue Type, 2026-2036
- Figure 80: East Asia Market Attractiveness Analysis by Revenue Type
- Figure 81: East Asia Market Value Share and BPS Analysis by App Type, 2026 and 2036
- Figure 82: East Asia Market Y-o-Y Growth Comparison by App Type, 2026-2036
- Figure 83: East Asia Market Attractiveness Analysis by App Type
- Figure 84: East Asia Market Value Share and BPS Analysis by Age Group, 2026 and 2036
- Figure 85: East Asia Market Y-o-Y Growth Comparison by Age Group, 2026-2036
- Figure 86: East Asia Market Attractiveness Analysis by Age Group
- Figure 87: East Asia Market Value Share and BPS Analysis by Payer Tier, 2026 and 2036
- Figure 88: East Asia Market Y-o-Y Growth Comparison by Payer Tier, 2026-2036
- Figure 89: East Asia Market Attractiveness Analysis by Payer Tier
- Figure 90: South Asia and Pacific Market Value Share and BPS Analysis by Country, 2026 and 2036
- Figure 91: South Asia and Pacific Market Value Share and BPS Analysis by Revenue Type, 2026 and 2036
- Figure 92: South Asia and Pacific Market Y-o-Y Growth Comparison by Revenue Type, 2026-2036
- Figure 93: South Asia and Pacific Market Attractiveness Analysis by Revenue Type
- Figure 94: South Asia and Pacific Market Value Share and BPS Analysis by App Type, 2026 and 2036
- Figure 95: South Asia and Pacific Market Y-o-Y Growth Comparison by App Type, 2026-2036
- Figure 96: South Asia and Pacific Market Attractiveness Analysis by App Type
- Figure 97: South Asia and Pacific Market Value Share and BPS Analysis by Age Group, 2026 and 2036
- Figure 98: South Asia and Pacific Market Y-o-Y Growth Comparison by Age Group, 2026-2036
- Figure 99: South Asia and Pacific Market Attractiveness Analysis by Age Group
- Figure 100: South Asia and Pacific Market Value Share and BPS Analysis by Payer Tier, 2026 and 2036
- Figure 101: South Asia and Pacific Market Y-o-Y Growth Comparison by Payer Tier, 2026-2036
- Figure 102: South Asia and Pacific Market Attractiveness Analysis by Payer Tier
- Figure 103: Middle East and Africa Market Value Share and BPS Analysis by Country, 2026 and 2036
- Figure 104: Middle East and Africa Market Value Share and BPS Analysis by Revenue Type, 2026 and 2036
- Figure 105: Middle East and Africa Market Y-o-Y Growth Comparison by Revenue Type, 2026-2036
- Figure 106: Middle East and Africa Market Attractiveness Analysis by Revenue Type
- Figure 107: Middle East and Africa Market Value Share and BPS Analysis by App Type, 2026 and 2036
- Figure 108: Middle East and Africa Market Y-o-Y Growth Comparison by App Type, 2026-2036
- Figure 109: Middle East and Africa Market Attractiveness Analysis by App Type
- Figure 110: Middle East and Africa Market Value Share and BPS Analysis by Age Group, 2026 and 2036
- Figure 111: Middle East and Africa Market Y-o-Y Growth Comparison by Age Group, 2026-2036
- Figure 112: Middle East and Africa Market Attractiveness Analysis by Age Group
- Figure 113: Middle East and Africa Market Value Share and BPS Analysis by Payer Tier, 2026 and 2036
- Figure 114: Middle East and Africa Market Y-o-Y Growth Comparison by Payer Tier, 2026-2036
- Figure 115: Middle East and Africa Market Attractiveness Analysis by Payer Tier
- Figure 116: Global Market - Tier Structure Analysis
- Figure 117: Global Market - Company Share Analysis
Frequently Asked Questions
How big is the Online Dating Application Market in 2026?
Future Market Insights estimates the global online dating application market at USD 5.8 billion in 2026, up from USD 5.6 billion in 2025, and projects it to reach USD 9.0 billion by 2036.
How fast is the Online Dating Application Market expected to grow through 2036?
FMI projects a 4.5% CAGR from 2026 to 2036, generating an incremental revenue opportunity of USD 3.2 billion over the forecast period.
Which revenue type leads the Online Dating Application Market?
Subscriptions lead the revenue type segment with a 62.0% share in 2026, projected to increase to 63.9% by 2036 at a 4.8% CAGR.
Which app type leads the Online Dating Application Market?
Mainstream swipe-based applications lead the app type segment with a 52.0% share in 2026 and are projected to grow at a 4.7% CAGR through 2036.
Which age group accounts for the largest share of the Online Dating Application Market?
Users aged 25 to 34 years account for the largest age group share at 38.0% in 2026, with the segment projected to grow at a 4.7% CAGR through 2036.
Which countries lead the Online Dating Application Market?
The United States holds the largest country market share at 34.0% in 2026, while China is projected to record the fastest growth at a 4.5% CAGR from 2026 to 2036.
Preview the report firsthand - request a free sample
Get SampleGet the brochure for pricing and purchase details.
Get PDF
