

- Market Size (2026)
- USD 860.7 Mn
- Forecast (2036)
- USD 1661.7 Mn
- CAGR (2026 to 2036)
- 6.8%
How big is the Oxygen Deficiency Monitors Market in 2026?
USD 860.7 million in 2026 and USD 1,661.7 million by 2036 at a 6.8% CAGR.
Demand for oxygen deficiency monitors is projected to rise at a CAGR of 6.8% by 2036, driving industry valuation from USD 860.7 million in 2026 to USD 1,661.7 million during the forecast period. Nitrogen and other inert gases create an invisible risk when leaks displace breathable air in laboratories and process rooms. The USA Bureau of Labor Statistics’ February 2026 CFOI table recorded 35 fatal occupational injuries from oxygen deficiency during 2024. That exposure record keeps continuous room alarms and gas leak detection systems close to confined-space entry plans and cryogenic facility design.
United States and Germany accounts are expected to prioritize documented atmospheric testing and service records before multi-site approval. China and India accounts are anticipated to emphasize local installation support around chemical plants and expanding cryogenic operations. Safety managers compare sensor response and alarm routing before selecting fixed units or portable monitors for entry work. HSE’s January 2026 release reported 59,219 employer-recorded non-fatal injuries in Great Britain during 2024/25. The broader safety burden keeps industrial safety products under formal review where facility teams need calibration support and rapid replacement service. Procurement decisions are expected to settle on evidence that alarm performance remains clear after routine maintenance.
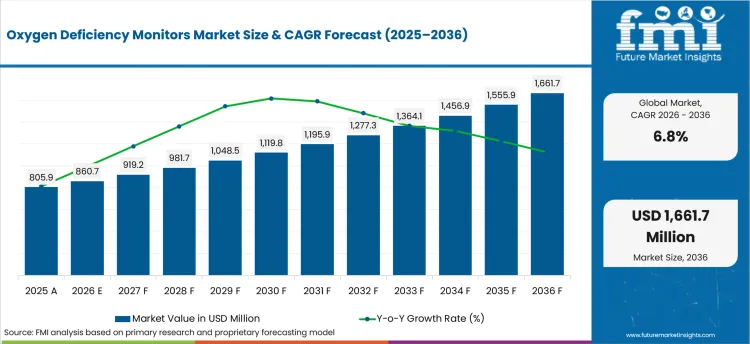
| Metric | Value |
|---|---|
| 2025 Market Size | USD 805.9 million |
| 2026 Market Size | USD 860.7 million |
| 2036 Market Size | USD 1,661.7 million |
| Forecast CAGR (2026-2036) | 6.8% |
| Monitor Type Focus | Fixed O₂ Deficiency Monitors |
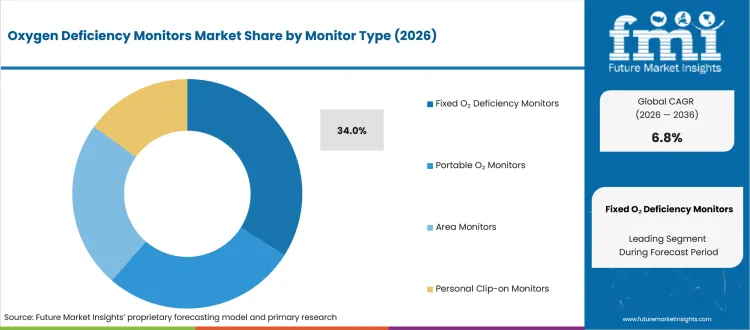
| Fixed O₂ Deficiency Monitors Share (2026) | 34.0% |
| Sensor Type Focus | Electrochemical Sensors |
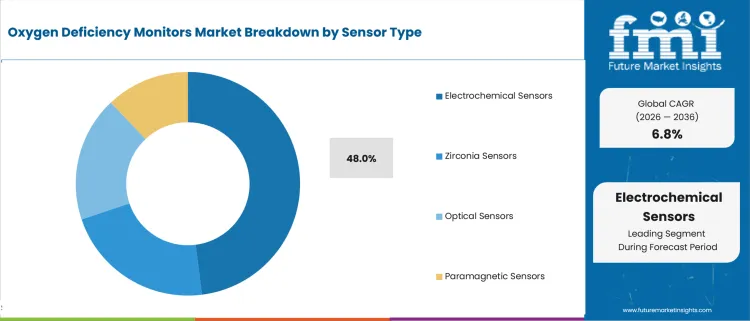
| Electrochemical Sensors Share (2026) | 48.0% |
| Alarm Output Focus | Audible or Visual |
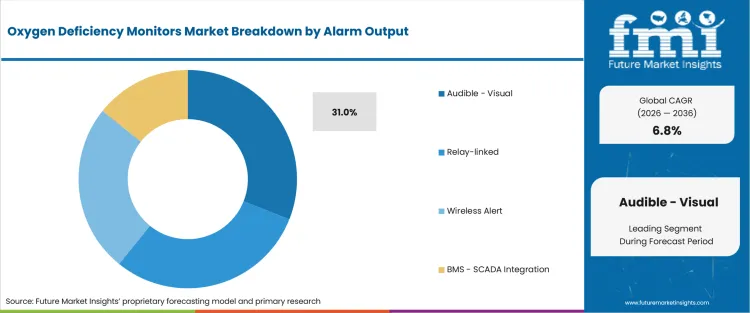
| Audible or Visual Share (2026) | 31.0% |
| Fastest-growing Country | India |
| India CAGR by 2036 | 8.6% |
Summary of the Oxygen Deficiency Monitors Market
| Market Signal | Commercial Impact |
|---|---|
| Demand and Growth Drivers | Permit-controlled work and inert-gas handling are expected to keep atmosphere testing inside routine safety budgets for laboratories and industrial sites. Oxygen monitors are expected to earn approval when safety teams connect alarm response with entry checks and documented rescue procedures.
|
| Product and Segment View | Fixed monitors anchor continuous room coverage while electrochemical sensors remain common in portable instruments for confined-space checks. Audible and visual alarms provide immediate local warning before remote escalation.
|
| Geography and Growth Outlook | India and China are projected to move through wider safety coverage and local service expansion. Established countries are expected to keep approval paths built around records.
|
| Competitive Landscape | Competition is expected to separate broad gas-detection platforms from specialists focused on defined oxygen-monitoring applications. Service response and calibration support are expected to shape repeat orders after site acceptance.
|
| Analyst Perspective | Alarm acceptance is decided before an oxygen monitor enters routine use in a laboratory or plant program. Facility teams need clear test records so every low-oxygen alert produces a known response.
- Nikhil Kaitwade, Principal Consultant at Future Market Insights |
Source: FMI's proprietary forecasting model and primary research
How is the oxygen deficiency monitors market segmented?
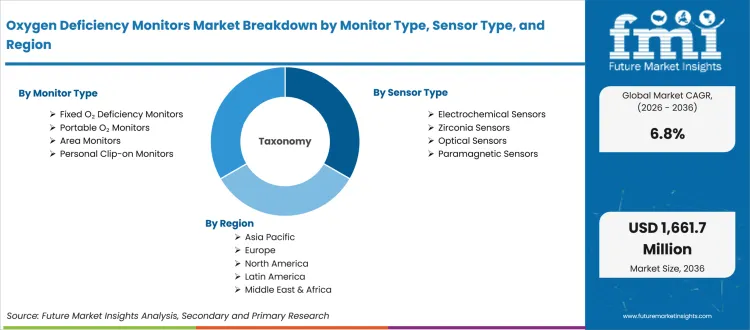
The oxygen deficiency monitors industry is segmented by monitor type, sensor type, alarm output, application, end use, and region.
The oxygen deficiency monitors market is segmented by monitor type, sensor type, alarm output, application, end use, and region. Monitor type covers portable O₂ monitors, fixed O₂ deficiency monitors, area monitors, and personal clip-on monitors. Sensor type includes electrochemical, zirconia, optical, and paramagnetic sensors. Teledyne GFD’s June 2025 Dammam partnership added a 699 m² sensor facility serving industrial channels. Alarm output covers audible / visual, relay-linked, wireless alert, and BMS or SCADA integration. Applications include confined spaces, laboratories, cryogenic storage areas, industrial process areas, and utility trenches. End use spans industrial facilities, research labs, utilities, healthcare or cryogenics, and construction safety. Regional coverage extends across seven major areas where portable gas detection equipment supports local entry and maintenance workflows.
What supports demand for fixed O₂ deficiency monitors within the monitor type category?
Cryogenic rooms need continuous oxygen readings because a nitrogen release gives workers no smell or visible warning before oxygen concentration falls. PureAire’s November 2025 application note linked liquid-nitrogen handling and semiconductor gas use with continuous oxygen monitoring during facility safety planning. Facility managers therefore review sensor location and alarm audibility during room design because one release affects an occupied zone before workers see or smell the hazard. Fixed units are expected to retain demand where one installed point protects recurring work in a defined zone.
- Based on monitor type, fixed O₂ deficiency monitors are projected to account for 34.0% in 2026 due to continuous coverage needs in laboratories and gas-storage rooms. Teledyne Gas & Flame Detection’s May 2026 OLCT 10N manual lists fixed oxygen detection across a 0-30% volume range. Networked detector ranges are expected to keep direct-reading instruments central to room monitoring and controller-based alarm review.
- Fixed monitors are drawing demand from laboratory managers owing to recurring nitrogen use and the need for alarms that remain active between individual tasks. MSA Safety’s February 2025 compliance article described connected gas detectors that automate routine program tasks and centralize management records. Facility teams are projected to connect room alarms with cryogenic systems and local response procedures through centralized monitoring.
How is electrochemical sensing positioned within the sensor type category?
Portable gas-monitor programs balance sensor size and response with calibration routines that field teams already understand. Dräger’s July 2025 KITE Expo page presented the X-am 5800 beside live equipment-management tools for industrial safety teams. Instrument managers compare replacement intervals and calibration handling before standardizing one fleet across several types of confined-space entry work. Electrochemical sensors are expected to remain widely selected where compact devices need direct oxygen readings beside other confined-space gases.
- By sensor type, electrochemical sensors are estimated to hold 48.0% in 2026 owing to their established use in portable multi-gas instruments. Detector makers are expected to add sensing options while oxygen measurement remains a core requirement in mixed-gas safety programs.
- Demand for electrochemical sensors is expected to grow among fleet managers due to familiar calibration processes and broad compatibility across portable gas instruments. Honeywell’s January 2025 BW Flex manual confirms detection of oxygen beside explosive and toxic gas hazards. Procurement teams are projected to compare sensor service life with gas sensor technologies before fleet standardization.
What drives audible / visual demand within the alarm output category?
A low-oxygen reading has little value unless workers receive an unmistakable warning and know how to respond. OSHA’s March 2026 QuickTakes bulletin linked recent confined-space deaths to oxygen-deficient or toxic atmospheres during construction and maintenance work. Safety teams therefore test sounders and beacons where machinery noise or hearing protection changes alarm perception. Audible and visual outputs are expected to remain a basic layer before remote notifications or control-system escalation is added.
- In 2026, audible / visual output is expected to lead the alarm output category with 31.0% share because workers need an immediate local warning. Local alerts can also feed wider monitoring systems when connected outputs are configured.
- Facility managers are expected to favor audible / visual alarms over remote-only notifications due to the need for immediate response near the monitored room. PureAire’s September 2025 pharmaceutical safety article described connections to building systems and local alarm panels. Accounts are projected to extend local alerts through connected sensor networks where centralized teams review multiple zones.
What are the drivers, restraints, and opportunities in the oxygen deficiency monitors market?
Near-term purchases are projected to be driven by confined-space entry controls and calibration record gaps. Connected alarm service routes form the opportunity outlined below.
- Driver: Permit-controlled work is expected to raise demand for direct oxygen readings before entry and continuous monitoring during work.
- Restraint: Accounts are anticipated to delay fleet expansion when calibration ownership and alarm acceptance records remain unclear.
- Opportunity: Connected alert routing is projected to open service revenue where facility teams need remote oversight across multiple monitored zones.
Confined-space entry programs are expected to keep direct atmospheric testing in purchasing plans because oxygen deficiency is invisible before symptoms appear. Oxygen-monitor vendors are expected to gain review time when instruments fit permit procedures and existing response plans.
Maintenance teams are anticipated to slow instrument expansion when bump tests and calibration records do not transfer cleanly between sites. HSE’s January 2026 welding guidance warned that confined-space welding still carries an asphyxiation risk when fumes and shielding gases accumulate. The guidance keeps ventilation checks and atmosphere testing connected during contractor approval before confined-space welding begins. Facility managers are expected to prefer service arrangements that define who tests sensors and who documents alarm acceptance after repair.
Remote oversight is projected to turn the documentation constraint into a service route for multi-site accounts. Industrial Scientific acquired Aeroqual in December 2025 and added environmental monitoring capability to its safety portfolio. The wider platform approach is expected to encourage links between oxygen alarms and functional safety systems where control rooms oversee several hazard zones. Service providers are anticipated to compete on alert escalation rules and maintenance histories that remain ready for site audits.
Which country CAGRs are profiled in the oxygen deficiency monitors market?
.webp "Top Country Growth Comparison Oxygen Deficiency Monitors Market Cagr (2026 2036)")
| Country | CAGR |
|---|---|
| United States | 5.8% |
| China | 7.8% |
| India | 8.6% |
| Germany | 5.4% |
| United Kingdom | 6.0% |
| Japan | 5.1% |
| South Korea | 6.3% |
Source: FMI's proprietary forecasting model and primary research
How do country-level CAGRs compare in the oxygen deficiency monitors market?
Country expansion is expected to reflect different combinations of regulation and service access across industrial safety programs. An April 2025 ILO statement reported that 395 million workers sustain non-fatal work injuries worldwide each year. India and China are projected to expand as formal safety coverage widens and industrial sites invest in hazard controls. United States and European accounts are anticipated to rely more heavily on documented entry procedures and maintenance records. Japan is expected to emphasize instrument reliability during longer fleet approval cycles before purchase approval. South Korea is forecast to keep suffocation prevention close to focused workplace inspection programs and employer safety reviews. Related environmental sensing equipment is expected to shape how centralized teams combine oxygen readings with wider facility monitoring.
- Florida tank-entry enforcement has put atmospheric evaluation back in front of USA contractor safety teams. United States demand is projected to grow at 5.8% CAGR by 2036 due to permit-space controls and replacement needs across industrial sites. OSHA proposed USD 60,242 in penalties after citing PCE Petroleum Contractors Enterprises for confined-space and respiratory failures in March 2026. The enforcement case keeps pre-entry testing connected to written permits and training records before contractors enter regulated tanks. OSHA inspectors and large industrial accounts are expected to scrutinize calibration histories before fleet renewal. USA distributors are anticipated to compete on service turnaround when plant teams cannot leave entry work without verified instruments.
- A fatal oxygen-deficiency accident in Anhui has sharpened attention on confined-space controls inside chemical operations. The Ministry of Emergency Management’s November 2025 review described 4 deaths after an October 2025 asphyxiation event at Chizhou Xintai New Materials. Oxygen deficiency monitor demand in China is forecast to rise at 7.8% CAGR over the assessment period due to chemical-site controls and local service expansion. Provincial emergency-management agencies are expected to push measurement and ventilation checks during hazardous work review. Domestic instrumentation firms and multinational vendors are anticipated to compete on response speed near industrial clusters. The commercial test is expected to be whether service teams keep sensors available near chemical plants outside primary industrial centers.
- India’s new occupational safety framework is widening formal coverage beyond the narrower sector system used before the reform. A November 2025 Press Information Bureau factsheet reported that the previous framework limited coverage to 7 sectors before the OSH Code broadened scope. Plant and contractor monitoring programs are expected to respond as rules are implemented across states. India is estimated to post 8.6% CAGR through 2036 owing to industrial expansion and more structured safety review. DGFASLI and state factory inspectorates are expected to influence how employers document atmospheric hazards during implementation and site-level enforcement. Local calibration networks are anticipated to decide whether monitor fleets stay reliable beyond the first purchase cycle.
- Germany’s industrial safety system gives maintenance records a clear place in technical approval for fixed monitoring equipment. Germany’s oxygen deficiency monitor sector is projected to record 5.4% CAGR during the assessment period due to safety controls in manufacturing and laboratory work. DGUV’s May 2026 accident statistics reported 754,660 reportable workplace accidents during 2024 across insured workplaces. Chemical plants and research campuses are expected to compare alarm integration with service coverage before adding fixed points. DGUV guidance and employer insurance requirements keep maintenance records close to day-to-day site practice and technical review. Facility engineering teams are expected to ask how relay outputs fit existing evacuation and ventilation logic. Vendors are anticipated to gain repeat orders when German service teams return calibrated units without disrupting planned maintenance windows.
- Great Britain’s safety program remains grounded in annual incident reporting and direct regulator enforcement across utilities and industrial work. HSE’s July 2025 annual release reported 124 worker deaths from work-related incidents across Great Britain during 2024/25. Oxygen deficiency monitor demand in the United Kingdom is forecast to rise at 6.0% CAGR over the forecast period due to utilities work and confined-space control. Water companies and specialist contractors are expected to rely on portable sampling before sewer or chamber entry. HSE guidance keeps atmosphere checks and rescue planning connected during work preparation before confined-space entry begins. Water utility procurement teams are expected to review battery readiness and service certificates before contractor issue. Rental channels are anticipated to retain an advantage where contractors need calibrated instruments for short project windows.
- Japan continues to treat equipment reliability as part of a wider workplace safety discipline across laboratories and process facilities. The Ministry of Health, Labour and Welfare reported 746 occupational fatalities for 2024 in a May 2025 release. Adoption of oxygen deficiency monitors in Japan is estimated to expand at 5.1% CAGR through 2036 owing to industrial laboratories and gas-handling work. MHLW and JISHA guidance keep hazard prevention visible across plant safety programs and recurring work procedures. Semiconductor facilities and research centers are expected to test instrument stability before wider fleet approval. Local engineering teams are projected to prefer stable alarm behavior across tightly controlled laboratory routines. Service providers are anticipated to win renewal work through traceable calibration and predictable sensor replacement planning.
- South Korea has moved suffocation prevention into a focused inspection program for workplaces with recurring confined-space exposure. The Ministry of Employment and Labor’s May 2025 release reported 126 suffocation deaths during 2015-2024. KOSHA and labor inspectors are expected to examine oxygen measurement and ventilation controls around confined-space work. In South Korea, oxygen monitor demand is anticipated to advance at 6.3% CAGR through 2036 due to concentrated manufacturing sites and focused enforcement. Shipyards and process plants are expected to value rapid technical feedback near major industrial zones. Major manufacturing groups are expected to compare portable sampling with fixed coverage around recurring maintenance zones. Vendors are forecast to compete on local service depth when an alarm fault interrupts planned entry work.
Who are the notable companies in the oxygen deficiency monitors market?
Honeywell, Dräger, MSA Safety, RKI Instruments, Industrial Scientific, PureAire Monitoring Systems, Analox, GfG Instrumentation, RC Systems, and Teledyne Gas & Flame Detection are the notable companies shaping this market.
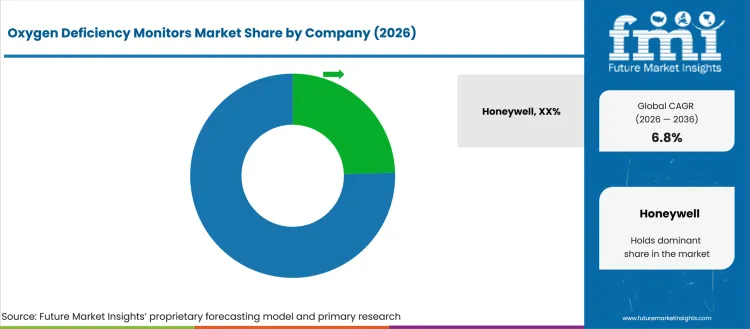
Competition is expected to split between broad gas-detection platforms and specialists that focus on oxygen monitoring for defined rooms or applications. Large industrial accounts compare fixed and portable coverage because their training and maintenance programs often span both instrument types. Smaller laboratories examine room placement and alarm integration more closely around nitrogen storage and cryogenic work. MSA Safety’s February 2026 technical article explained that cross-sensitivity is inherent across gas sensors and does not automatically indicate a faulty device. Sensor behavior keeps product proof close to machine safety systems and formal entry procedures during technical approval. Procurement teams are anticipated to compare calibration service and local stock after the technical fit is confirmed.
- Honeywell and Dräger focuses on broad fixed and portable detector ranges that measure oxygen beside toxic and combustible gases. Their portfolios are expected to suit industrial groups seeking one training structure across several sites and hazard types. Account review is anticipated to focus on documentation consistency and local service access after technical fit is confirmed.
- MSA Safety and Industrial Scientific combine portable monitoring with connected fleet tools and area-monitoring options for distributed industrial teams. Safety managers are projected to evaluate alert visibility and device status across dispersed teams before expanding connected fleets. Their competitive route is expected to center on how well hardware records support fleet maintenance and incident review after initial deployment.
- RKI Instruments and PureAire Monitoring Systems address different specialist needs around pumped sampling and continuous room monitoring. RKI serves portable and fixed applications across utilities and process sites while PureAire concentrates on oxygen-deficiency monitoring around cryogenic gases. Accounts are anticipated to compare sensor upkeep and application guidance before selecting equipment for fixed rooms or recurring entry work.
- Analox and GfG Instrumentation serve specialty gas-monitoring applications that need focused sensing and alarm control. RC Systems and Teledyne Gas & Flame Detection add fixed control or portable detection options for industrial sites. Regional account success is forecast to depend on distributor coverage and service response after site acceptance.
Competitive Benchmarking: Oxygen Deficiency Monitors Market
| Company | Fixed O₂ Coverage | Portable Sampling | Connected Alarms | Calibration Support | Specification Support | Service Reach |
|---|---|---|---|---|---|---|
| Honeywell | High | High | High | High | High | High |
| Dräger | High | High | High | High | High | High |
| MSA Safety | High | High | High | High | High | High |
| Industrial Scientific | Medium | High | High | High | High | High |
| RKI Instruments | High | High | High | High | High | Medium |
| PureAire Monitoring Systems | High | Medium | Medium | High | High | Medium |
| Analox | High | Medium | Medium | High | High | High |
| Teledyne Gas & Flame Detection | High | High | High | High | High | High |
Source: Future Market Insights competitive analysis, 2026. Ratings reflect relative portfolio relevance and workflow fit. Service capability and geographic reach shape the remaining comparison.
Key Developments in the Oxygen Deficiency Monitors Market
- In September 2025, MSA Safety debuted the ALTAIR io 6 Multigas Detector at the National Safety Congress. The instrument combines a pumped sampling design with confined-space monitoring functions for pre-entry and ongoing measurement work.
- In June 2025, Teledyne Gas & Flame Detection introduced the PS DUO portable detector for simultaneous monitoring of two gases. The passive-diffusion instrument supports oxygen among its selectable gas options and combines audible or visual alarms with wireless data retrieval inside an IP67 enclosure.
- In March 2026, RKI Instruments announced commercial shipments of the GX-6100 six-gas sample-draw monitor for industrial safety teams. The device replaces earlier GX-6000 and GX-2012 models while adding longer operating time and Bluetooth connectivity.
Key Players in the Oxygen Deficiency Monitors Market
Global multi-gas and safety platforms
- Honeywell
- Dräger
- MSA Safety
- Industrial Scientific
- Teledyne Gas & Flame Detection
Specialist oxygen and gas monitoring manufacturers
- RKI Instruments
- PureAire Monitoring Systems
- Analox
- GfG Instrumentation
- RC Systems
Oxygen Deficiency Monitors Market - Report Scope
| Coverage field | Report scope |
|---|---|
| Market breakdown | By monitor type, sensor type, alarm output, application, end use, and region |
| Quantitative Units | Revenue in USD Million, CAGR in % |
| Market Definition | Instruments that measure ambient oxygen concentration and trigger local or connected warnings when oxygen falls below configured safety thresholds while excluding medical pulse oximeters. |
| Regions Covered | North America, Latin America, Europe, East Asia, South Asia, Oceania, and Middle East and Africa |
| Countries Covered | United States, Canada, Brazil, Mexico, Argentina, Germany, United Kingdom, France, Italy, Spain, China, Japan, South Korea, India, Thailand, Indonesia, Australia, New Zealand, South Africa, and Turkey |
| Key Companies Profiled | Honeywell, Dräger, MSA Safety, RKI Instruments, Industrial Scientific, PureAire Monitoring Systems, Analox, GfG Instrumentation, RC Systems, and Teledyne Gas & Flame Detection |
| Forecast Period | 2026 to 2036 |
| Approach | Hybrid methodology using bottom-up category estimates, top-down industry reconciliation, and primary research validation |
Source: Future Market Insights - analysis driven by proprietary forecasting models and primary research
Oxygen Deficiency Monitors Market - Research Methodology
| Method | Approach |
|---|---|
| Primary Research | FMI interviews safety managers and channel partners about installed monitor types and calibration practice across fixed and portable fleets. Interviews examine replacement timing and service expectations before findings are compared with product activity and public safety records. Analysts test how facility teams define alarm acceptance and assign calibration ownership across multi-site programs. Primary inputs are then used to challenge purchase drivers and service constraints before regional weights are assigned across the forecast model. |
| Desk Research | Desk research reviews regulator guidance and official accident records beside current product pages and company disclosures. Analysts compare workplace safety requirements across major national markets and screen evidence for direct links to low-oxygen hazards. Product records are checked for fixed monitoring and portable sampling use cases. Evidence is retained only when it helps explain atmosphere monitoring needs or entry-control requirements within the defined market scope. |
| Market Sizing and Forecasting | FMI sizes the market from product categories and regional purchasing patterns before reconciling estimates with broader industrial safety activity. Assumptions are checked against product portfolios and channel presence across fixed or portable monitoring programs. Analysts compare adoption across laboratories and industrial facilities while testing application differences in confined spaces and cryogenic areas. The model then reconciles country patterns with service availability and the installed monitoring base. |
| Data Validation | Forecast outputs are compared across primary interviews and official safety evidence before final reconciliation of country and segment estimates. Country assumptions are checked against local guidance and service availability before they are retained in the model. Company portfolios are reviewed to exclude adjacent gas-detection products without direct relevance to ambient oxygen monitoring. Segment weights are then challenged against application fit and alarm-output requirements before the final forecast is accepted. |
Source: Future Market Insights (FMI) analysis, based on proprietary forecasting model and primary research
Oxygen Deficiency Monitors Market by Segments
Oxygen Deficiency Monitors Market segmented by Monitor Type:
- Portable O₂ Monitors
- Fixed O₂ Deficiency Monitors
- Area Monitors
- Personal Clip-on Monitors
Oxygen Deficiency Monitors Market segmented by Sensor Type:
- Electrochemical Sensors
- Zirconia Sensors
- Optical Sensors
- Paramagnetic Sensors
Oxygen Deficiency Monitors Market segmented by Alarm Output:
- Audible or Visual
- Relay-linked
- Wireless Alert
- BMS or SCADA Integration
Oxygen Deficiency Monitors Market segmented by Application:
- Confined Spaces
- Laboratories
- Cryogenic Storage Areas
- Industrial Process Areas
- Utility Trenches
Oxygen Deficiency Monitors Market segmented by End Use:
- Industrial Facilities
- Research Labs
- Utilities
- Healthcare or Cryogenics
- Construction Safety
Oxygen Deficiency Monitors Market by Region:
- North America
- United States
- Canada
- Latin America
- Brazil
- Mexico
- Argentina
- Europe
- Germany
- United Kingdom
- France
- Italy
- Spain
- East Asia
- China
- Japan
- South Korea
- South Asia
- India
- Thailand
- Indonesia
- Oceania
- Australia
- New Zealand
- Middle East and Africa
- GCC countries
- South Africa
- Türkiye
Research Sources and Bibliography
- USA Bureau of Labor Statistics. (2026, February). Table A-9. Fatal occupational injuries by event or exposure for all fatal injuries and major private industry sector, all United States, 2024. USA Bureau of Labor Statistics.
- International Labour Organization. (2025, April). We need to come together to renew our commitment to occupational safety and health. International Labour Organization.
- Teledyne Gas & Flame Detection. (2025, June). Teledyne GFD Partners with Industrial Detection Solutions to localise manufacturing in KSA. Teledyne Gas & Flame Detection.
- Health and Safety Executive. (2026, January). Non-fatal injuries at work in Great Britain. Health and Safety Executive.
- Occupational Safety and Health Administration. (2026, February). US Department of Labor cites Alabama contractor for exposing workers to sewage gas that resulted in 2 fatalities. Occupational Safety and Health Administration.
- Press Information Bureau. (2025, November). Occupational Safety, Health and Working Conditions (OSH) Code, 2020. Press Information Bureau.
- Industrial Scientific. (2025, September). Industrial Scientific, Total Safety Continue Partnership with $1.6 Million Deal. Industrial Scientific.
- Industrial Scientific. (2026, January). Industrial Scientific Expands Area Monitoring Portfolio with MPS™ LEL Sensor. Industrial Scientific.
- Industrial Scientific. (2025, December). Industrial Scientific Acquires Aeroqual. Industrial Scientific.
- PureAire Monitoring Systems. (2025, November). USA Liquid Nitrogen and Semiconductor Gas Markets Highlight Growing Need for Oxygen Deficiency Monitors. PureAire Monitoring Systems.
- MSA Safety. (2025, February). Streamline Your Gas Detection Compliance. MSA Safety.
- Dräger. (2025, July). Safety team at KITE Expo South Africa 2025. Dräger.
- MSA Safety. (2025, July). Tap into the Potential of Self-Checking Gas Sensor Technology. MSA Safety.
- Honeywell. (2025, January). Honeywell BW Flex User Manual. Honeywell.
- PureAire Monitoring Systems. (2025, September). Gas Detection in Pharmaceutical Manufacturing: Protecting Peptide and Oligonucleotide Facilities. PureAire Monitoring Systems.
- MSA Safety. (2026, February). Cross-Sensitivity and False Alarms: A Hidden Challenge. MSA Safety.
- Occupational Safety and Health Administration. (2026, March). March 19, 2026 QuickTakes. Occupational Safety and Health Administration.
- Occupational Safety and Health Administration. (2026, March). US Department of Labor cites Florida petroleum tank services contractor after worker succumbs to injuries from exposure to toxic chemicals. Occupational Safety and Health Administration.
- German Social Accident Insurance. (2026, May). Accident occurrence. German Social Accident Insurance.
- Health and Safety Executive. (2025, July). Latest annual work-related fatalities published. Health and Safety Executive.
- Ministry of Health, Labour and Welfare of Japan. (2025, May). 令和6年の労働災害発生状況を公表. Ministry of Health, Labour and Welfare of Japan.
- Ministry of Employment and Labor of the Republic of Korea. (2025, May). 질식 재해 고위험사업장 집중점검 실시. Ministry of Employment and Labor of the Republic of Korea.
- MSA Safety. (2025, September). MSA Safety Debuts Two New Safety Solutions at National Safety Congress. MSA Safety.
- Teledyne Gas & Flame Detection. (2025, June). Next-level safety: New portable PS DUO from Teledyne GFD detects two gases simultaneously. Teledyne Gas & Flame Detection.
- RKI Instruments. (2026, March). Announcing the GX-6100 - Six Gas Sample Draw Monitor. RKI Instruments.
- Ministry of Labour and Employment. (2025, June). Annual Report 2024-25. Ministry of Labour and Employment.
- Ministry of Labour and Employment. (2026, May). Occupational Safety, Health and Working Conditions (Central) Rules, 2026. Ministry of Labour and Employment.
- USA Bureau of Labor Statistics. (2026, January). Employer-Reported Workplace Injuries and Illnesses, 2023-2024. USA Bureau of Labor Statistics.
- Occupational Safety and Health Administration. (2026, July). State Plans. Occupational Safety and Health Administration.
- Teledyne Gas & Flame Detection. (2026, May). OLCT 10N Digital Gas Detector User Manual. Teledyne Gas & Flame Detection.
- Health and Safety Executive. (2026, January). Health risks from welding. Health and Safety Executive.
This bibliography is provided for reader reference and uses primary government, standards-body, official trade body, and company sources.
This Report Answers
- What value is estimated for the oxygen deficiency monitors market in 2026 and by 2036?
- What CAGR is forecast for the oxygen deficiency monitors market from 2026 to 2036?
- Which segments are expected to shape demand across each parent category in the oxygen deficiency monitors industry?
- Which specific safety pressures are projected to support oxygen monitor adoption and purchase activity?
- How are country CAGRs expected to differ across the seven profiled national markets?
- Which companies compete across gas coverage and portable sampling as connected alarms shape calibration support and service reach?
- What should safety managers and facility teams address before broader fleet expansion or sourcing commitment?
- How are claims review and calibration records expected to affect vendor selection when alarm acceptance and regulatory requirements vary?
Frequently Asked Questions
What is driving growth in the Oxygen Deficiency Monitors Market?
Demand is projected to rise as confined-space controls and inert-gas use keep oxygen checks inside routine safety programs. Fixed monitoring and reliable alarm response support recurring purchases.
Who are the key players in the Oxygen Deficiency Monitors Market?
Notable companies include Honeywell, Dräger, MSA Safety, Industrial Scientific, RKI Instruments, and PureAire Monitoring Systems. Competition is projected to center on coverage, calibration support, and service reach.
What is a significant restraint in the Oxygen Deficiency Monitors Market?
A significant restraint is unclear calibration ownership across multi-site programs. Adoption is anticipated to slow when alarm acceptance records and service responsibilities remain incomplete.
Why should executives track the Oxygen Deficiency Monitors Market?
Executives should track the market because oxygen monitoring affects work permits and operating continuity. Product selection is expected to influence service costs and incident readiness.
What business problem does the Oxygen Deficiency Monitors Market address?
The market addresses the need to detect oxygen displacement before workers enter or remain in hazardous areas. Monitors provide warnings that support evacuation and ventilation response.
What should procurement leaders evaluate before selecting suppliers?
Procurement leaders should evaluate sensor fit and calibration support before selecting suppliers. Supplier review should examine alarm integration and local service response for recurring maintenance needs.
What limits return on investment for purchasers?
Return on investment is estimated to weaken when calibration programs are inconsistent or alarm placement is poorly matched to site conditions. Slow service response also increases downtime after faults or scheduled maintenance.
How do suppliers build long-term account confidence?
Suppliers build long-term account confidence by providing repeatable test records and dependable calibration support. Clear installation guidance and local service continuity are expected to support repeat orders.
Preview the report firsthand - request a free sample
Get SampleGet the brochure for pricing and purchase details.
Get PDFTable of Content
- Key Takeaways
- Market Size and CAGR
- Top Growth Driver
- Fastest Growing Segment
- Leading Region
- Key Companies
- Emerging Opportunities
- Executive Summary
- Global Market Outlook
- Demand-side Trends
- Supply-side Trends
- Technology Roadmap Analysis
- Analysis and Recommendations
- Analyst Perspective (What is happening? Why now? What should investors know?)
- Key Questions Answered
- How large is the market?
- What is the CAGR?
- What are key trends?
- Which region dominates?
- Who are the leaders?
- Market Overview
- Market Coverage / Taxonomy
- Market Definition / Scope / Limitations
- Research Methodology
- Chapter Orientation
- Analytical Lens and Working Hypotheses
- Market Structure, Signals, and Trend Drivers
- Benchmarking and Cross-market Comparability
- Market Sizing, Forecasting, and Opportunity Mapping
- Research Design and Evidence Framework
- Desk Research Programme (Secondary Evidence)
- Expert Input and Fieldwork (Primary Evidence)
- Tooling, Models, and Reference Databases
- Data Engineering and Model Build
- Quality Assurance and Audit Trail
- Market Background
- Market Dynamics (Drivers, Restraints, Opportunity, Trends)
- Scenario Forecast (Optimistic, Likely, Conservative)
- Impact Analysis
- AI Impact
- Sustainability Impact
- Regulatory Impact
- Technology Impact
- Consumer / Buyer Analysis
- Purchase Drivers
- Adoption Barriers
- Buyer Journey
- Opportunity Map Analysis
- Product Life Cycle Analysis
- Supply Chain Analysis
- Investment Feasibility Matrix
- Value Chain Analysis
- PESTLE and Porter's Analysis
- Regulatory Landscape
- Regional Parent Market Outlook
- Production and Consumption Statistics
- Import and Export Statistics
- Global Market Analysis and Forecast, 2021 to 2036
- Historical Market Size Value (USD Million) & Volume (Units) Analysis, 2021 to 2025
- Current and Future Market Size Value (USD Million) & Volume (Units) Projections, 2026 to 2036
- Y-o-Y Growth Trend Analysis
- Absolute $ Opportunity Analysis
- Global Market Pricing Analysis, 2021 to 2036
- Global Market Analysis and Forecast, By Monitor Type, 2021 to 2036
- Introduction / Key Findings
- Historical Market Size Value (USD Million) & Volume (Units) Analysis By Monitor Type, 2021 to 2025
- Current and Future Market Size Value (USD Million) & Volume (Units) Analysis and Forecast By Monitor Type, 2026 to 2036
- Fixed O₂ Deficiency Monitors
- Portable O₂ Monitors
- Area Monitors
- Personal Clip-on Monitors
- Fixed O₂ Deficiency Monitors
- Y-o-Y Growth Trend Analysis By Monitor Type, 2021 to 2025
- Absolute $ Opportunity Analysis By Monitor Type, 2026 to 2036
- Global Market Analysis and Forecast, By Sensor Type, 2021 to 2036
- Introduction / Key Findings
- Historical Market Size Value (USD Million) & Volume (Units) Analysis By Sensor Type, 2021 to 2025
- Current and Future Market Size Value (USD Million) & Volume (Units) Analysis and Forecast By Sensor Type, 2026 to 2036
- Electrochemical Sensors
- Zirconia Sensors
- Optical Sensors
- Paramagnetic Sensors
- Electrochemical Sensors
- Y-o-Y Growth Trend Analysis By Sensor Type, 2021 to 2025
- Absolute $ Opportunity Analysis By Sensor Type, 2026 to 2036
- Global Market Analysis and Forecast, By Alarm Output, 2021 to 2036
- Introduction / Key Findings
- Historical Market Size Value (USD Million) & Volume (Units) Analysis By Alarm Output, 2021 to 2025
- Current and Future Market Size Value (USD Million) & Volume (Units) Analysis and Forecast By Alarm Output, 2026 to 2036
- Audible - Visual
- Relay-linked
- Wireless Alert
- BMS - SCADA Integration
- Audible - Visual
- Y-o-Y Growth Trend Analysis By Alarm Output, 2021 to 2025
- Absolute $ Opportunity Analysis By Alarm Output, 2026 to 2036
- Global Market Analysis and Forecast, By Application, 2021 to 2036
- Introduction / Key Findings
- Historical Market Size Value (USD Million) & Volume (Units) Analysis By Application, 2021 to 2025
- Current and Future Market Size Value (USD Million) & Volume (Units) Analysis and Forecast By Application, 2026 to 2036
- Confined Spaces
- Laboratories
- Cryogenic Storage Areas
- Industrial Process Areas
- Utility Trenches
- Confined Spaces
- Y-o-Y Growth Trend Analysis By Application, 2021 to 2025
- Absolute $ Opportunity Analysis By Application, 2026 to 2036
- Global Market Analysis and Forecast, By End Use, 2021 to 2036
- Introduction / Key Findings
- Historical Market Size Value (USD Million) & Volume (Units) Analysis By End Use, 2021 to 2025
- Current and Future Market Size Value (USD Million) & Volume (Units) Analysis and Forecast By End Use, 2026 to 2036
- Industrial Facilities
- Research Labs
- Utilities
- Healthcare - Cryogenics
- Construction Safety
- Industrial Facilities
- Y-o-Y Growth Trend Analysis By End Use, 2021 to 2025
- Absolute $ Opportunity Analysis By End Use, 2026 to 2036
- Global Market Analysis and Forecast, By Region, 2021 to 2036
- Introduction
- Historical Market Size Value (USD Million) & Volume (Units) Analysis By Region, 2021 to 2025
- Current Market Size Value (USD Million) & Volume (Units) Analysis and Forecast By Region, 2026 to 2036
- North America
- Latin America
- Europe
- East Asia
- South Asia
- Oceania
- Middle East and Africa
- Market Attractiveness Analysis By Region
- North America Market Analysis and Forecast, By Country, 2021 to 2036
- Historical Market Size Value (USD Million) & Volume (Units) Trend Analysis By Market Taxonomy, 2021 to 2025
- Market Size Value (USD Million) & Volume (Units) Forecast By Market Taxonomy, 2026 to 2036
- By Country
- United States
- Canada
- By Monitor Type
- By Sensor Type
- By Alarm Output
- By Application
- By End Use
- By Country
- Market Attractiveness Analysis
- By Country
- By Monitor Type
- By Sensor Type
- By Alarm Output
- By Application
- By End Use
- Key Takeaways
- Latin America Market Analysis and Forecast, By Country
- Historical Market Size Value (USD Million) & Volume (Units) Trend Analysis By Market Taxonomy, 2021 to 2025
- Market Size Value (USD Million) & Volume (Units) Forecast By Market Taxonomy, 2026 to 2036
- By Country
- Brazil
- Mexico
- Argentina
- By Monitor Type
- By Sensor Type
- By Alarm Output
- By Application
- By End Use
- By Country
- Market Attractiveness Analysis
- By Country
- By Monitor Type
- By Sensor Type
- By Alarm Output
- By Application
- By End Use
- Key Takeaways
- Europe Market Analysis and Forecast, By Country
- Historical Market Size Value (USD Million) & Volume (Units) Trend Analysis By Market Taxonomy, 2021 to 2025
- Market Size Value (USD Million) & Volume (Units) Forecast By Market Taxonomy, 2026 to 2036
- By Country
- Germany
- United Kingdom
- France
- Italy
- Spain
- By Monitor Type
- By Sensor Type
- By Alarm Output
- By Application
- By End Use
- By Country
- Market Attractiveness Analysis
- By Country
- By Monitor Type
- By Sensor Type
- By Alarm Output
- By Application
- By End Use
- Key Takeaways
- East Asia Market Analysis and Forecast, By Country
- Historical Market Size Value (USD Million) & Volume (Units) Trend Analysis By Market Taxonomy, 2021 to 2025
- Market Size Value (USD Million) & Volume (Units) Forecast By Market Taxonomy, 2026 to 2036
- By Country
- China
- Japan
- South Korea
- By Monitor Type
- By Sensor Type
- By Alarm Output
- By Application
- By End Use
- By Country
- Market Attractiveness Analysis
- By Country
- By Monitor Type
- By Sensor Type
- By Alarm Output
- By Application
- By End Use
- Key Takeaways
- South Asia Market Analysis and Forecast, By Country
- Historical Market Size Value (USD Million) & Volume (Units) Trend Analysis By Market Taxonomy, 2021 to 2025
- Market Size Value (USD Million) & Volume (Units) Forecast By Market Taxonomy, 2026 to 2036
- By Country
- India
- Thailand
- Indonesia
- By Monitor Type
- By Sensor Type
- By Alarm Output
- By Application
- By End Use
- By Country
- Market Attractiveness Analysis
- By Country
- By Monitor Type
- By Sensor Type
- By Alarm Output
- By Application
- By End Use
- Key Takeaways
- Oceania Market Analysis and Forecast, By Country
- Historical Market Size Value (USD Million) & Volume (Units) Trend Analysis By Market Taxonomy, 2021 to 2025
- Market Size Value (USD Million) & Volume (Units) Forecast By Market Taxonomy, 2026 to 2036
- By Country
- Australia
- New Zealand
- By Monitor Type
- By Sensor Type
- By Alarm Output
- By Application
- By End Use
- By Country
- Market Attractiveness Analysis
- By Country
- By Monitor Type
- By Sensor Type
- By Alarm Output
- By Application
- By End Use
- Key Takeaways
- Middle East and Africa Market Analysis and Forecast, By Country
- Historical Market Size Value (USD Million) & Volume (Units) Trend Analysis By Market Taxonomy, 2021 to 2025
- Market Size Value (USD Million) & Volume (Units) Forecast By Market Taxonomy, 2026 to 2036
- By Country
- GCC countries
- South Africa
- Türkiye
- By Monitor Type
- By Sensor Type
- By Alarm Output
- By Application
- By End Use
- By Country
- Market Attractiveness Analysis
- By Country
- By Monitor Type
- By Sensor Type
- By Alarm Output
- By Application
- By End Use
- Key Takeaways
- Key Countries Market Analysis
- United States
- Pricing Analysis
- Market Share Analysis, 2025
- By Monitor Type
- By Sensor Type
- By Alarm Output
- By Application
- By End Use
- China
- Pricing Analysis
- Market Share Analysis, 2025
- By Monitor Type
- By Sensor Type
- By Alarm Output
- By Application
- By End Use
- India
- Pricing Analysis
- Market Share Analysis, 2025
- By Monitor Type
- By Sensor Type
- By Alarm Output
- By Application
- By End Use
- Germany
- Pricing Analysis
- Market Share Analysis, 2025
- By Monitor Type
- By Sensor Type
- By Alarm Output
- By Application
- By End Use
- United Kingdom
- Pricing Analysis
- Market Share Analysis, 2025
- By Monitor Type
- By Sensor Type
- By Alarm Output
- By Application
- By End Use
- Japan
- Pricing Analysis
- Market Share Analysis, 2025
- By Monitor Type
- By Sensor Type
- By Alarm Output
- By Application
- By End Use
- South Korea
- Pricing Analysis
- Market Share Analysis, 2025
- By Monitor Type
- By Sensor Type
- By Alarm Output
- By Application
- By End Use
- United States
- Market Structure Analysis
- Competition Dashboard
- Competition Benchmarking
- Market Share Analysis of Top Players
- By Regional
- By Monitor Type
- By Sensor Type
- By Alarm Output
- By Application
- By End Use
- Emerging Startups
- Innovation Benchmarking
- Competition Analysis
- Competition Deep Dive
- Honeywell
- Overview
- Product Portfolio
- Profitability by Market Segments (Product/Region/Sales Channel)
- Sales Footprint
- Strategy Overview
- Marketing Strategy
- Product Strategy
- Channel Strategy
- Dräger
- MSA Safety
- Industrial Scientific
- RKI Instruments
- PureAire Monitoring Systems
- Analox
- Teledyne Gas & Flame Detection
- Honeywell
- Case Studies
- Success Stories
- Recent Developments
- Competition Deep Dive
- Assumptions & Acronyms Used


