Oxytocin Testing Kits Market Size, Share, and Forecast Outlook 2025 to 2035

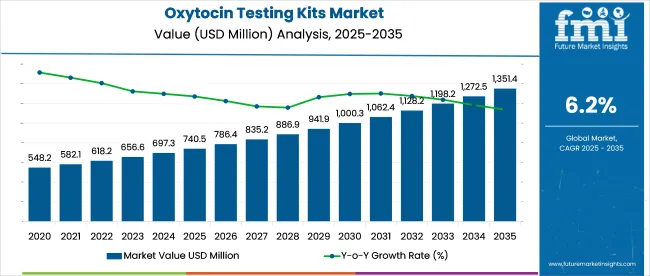
The global oxytocin testing kits market is anticipated to reach USD 1,351.4 million by 2035, rising from USD 740.5 million in 2025 at a 6.2% CAGR. Around 58% of current demand comes from academic and research settings, but clinical use is expanding.
Quick Stats of the Oxytocin Testing Kits Market

  • Market Value (2025): USD 740.5 million
  • Forecast Value (2035): USD 1,351.4 million
  • Global CAGR (2025 to 2035): 6.2%
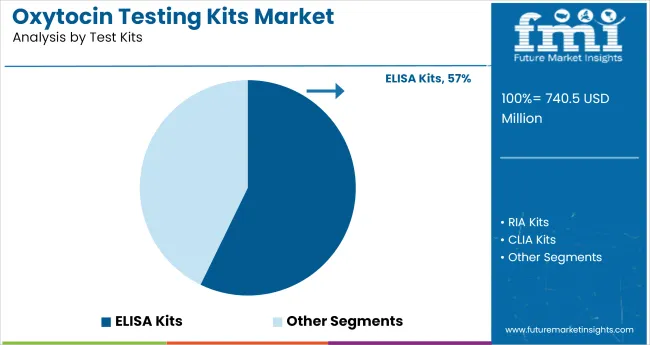
  • Leading Segment in 2025: ELISA Kits (~57% share)
  • Key Growth Region: South Asia & Pacific, particularly India
  • Key Players: Elabscience®, Thermo Fisher Scientific Inc, Zellx, Enzo Biochem Inc., FUJIFILM Wako Pure Chemical Corporation, RayBiotech, Inc.

Oxytocin Testing Kits Market

Over 190 hospital labs in the USA have begun piloting oxytocin assays for postpartum and psychiatric screening. ELISA-based kits hold 62% of the current volume, yet automated multi-analyte platforms are gaining traction. Growth will depend on payer recognition in mood and anxiety diagnostics. Manufacturers are being pressured to meet CLIA and CE-IVD standards and secure stable recombinant reagent supply chains.

In June 2024, FUJIFILM Wako Pure Chemicals Corporation announced the launch of LumiMAT™ Pyrogen Detection Kit and PYROSTAR™ Neo+, both scheduled for release in July 2024. LumiMAT allows 5-hour detection of pyrogens using NOMO-1 cells with luciferase-based NF-κB activation, serving as a replacement for the rabbit pyrogen test.

PYROSTAR Neo+ uses recombinant proteins to detect bacterial endotoxins through a kinetic chromogenic assay. “With a longstanding history contributing to public health and patient safety through quality control testing solutions for pharmaceuticals, we are proud to introduce two new testing kits for pyrogens and endotoxins to lead the industry forward,” said Koichi Yoshida president of FUJIFILM Wako Pure Chemicals Corporation.

The oxytocin testing kits market serves defined diagnostic niches. Within the USD 90 billion clinical diagnostic assays industry, these kits hold a 1-2% share, primarily for labor and hormone measurement. They account for under 1% of the USD 40 billion point-of-care segment, used in niche reproductive health settings.

About 3-5% of the USD 12 billion women’s health diagnostics field relies on oxytocin tools for postpartum and lactation monitoring. In the USD 8 billion research assay market, oxytocin kits form 2-3%, aiding neurobehavioral studies. In veterinary diagnostics worth USD 5 billion, oxytocin holds below 2%, limited to breeding programs.

Analyzing Oxytocin Testing Kits Market by Top Investment Segments

The oxytocin testing kits market is segmented by test kit type into ELISA kits, rapid diagnostic kits, and chromatography-based assays. By application, segmentation includes obstetrics & reproductive health, behavioral studies, endocrinology research, and psychiatric diagnostics. End users include hospitals, diagnostic laboratories, academic institutions, and research centers.

Geographic coverage spans North America, Latin America, Western Europe, Eastern Europe, East Asia, South Asia & Pacific.
ELISA Kits Dominate Test Kit Utilization

Oxytocin Testing Kits Market Analysis By Test Kits

In 2025, ELISA kits are expected to account for 57% of oxytocin testing kit usage. This dominance is attributed to their high sensitivity, reproducibility, and ability to quantify oxytocin in complex biological matrices like plasma, saliva, and cerebrospinal fluid. From 2020 to 2024, these kits were increasingly adopted in clinical and research settings where precise hormonal quantification was essential for longitudinal reproductive and behavioral studies.

ELISA-based formats continue to outperform rapid immunoassays in detection accuracy, especially in perinatal and neuroendocrine investigations. Their compatibility with automated plate readers has further supported high-throughput deployment in centralized labs.
  • Enzo Life Sciences expanded its oxytocin ELISA offerings for salivary diagnostics.
  • Abcam improved antibody sensitivity for serum-based oxytocin quantification.
  • MyBioSource developed customizable ELISA formats for cross-species reproductive studies.

Obstetrics & Reproductive Health Applications Lead Clinical Demand

Oxytocin Testing Kits Market Analysis By Application

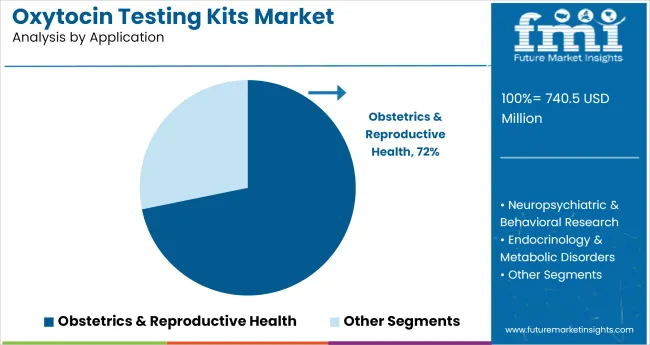
Obstetrics and reproductive health are projected to represent 72% of all oxytocins testing kit applications in 2025. This segment’s dominance is supported by growing demand for oxytocin monitoring during labor induction, lactation assessments, and fertility-related evaluations. From 2020 to 2024, test adoption increased in maternal care pathways, where real-time hormone monitoring was integrated into delivery protocols.

Testing kits have also been adopted in IVF programs and postpartum care units for assessing hormonal imbalances. The clinical value of oxytocin in maternal behavior and uterine function continues to drive protocol-level inclusion in obstetric departments.
  • Thermo Fisher Scientific collaborated with maternal health centers for labor-stage oxytocin profiling.
  • Bio-Techne introduced kits compatible with fertility clinic workflows.
  • Cayman Chemical supported oxytocin monitoring in postpartum endocrine evaluations.

Hospitals Remain Primary End User Across Care Continuum

Oxytocin Testing Kits Market Analysis By End User

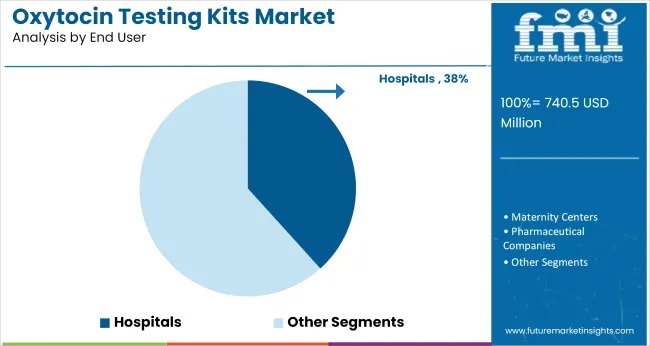
Hospitals are projected to contribute 38% of oxytocin testing kit demand in 2025. Their central role in labor and delivery care, emergency obstetric interventions, and postpartum monitoring has positioned them as the largest end user segment. Between 2020 and 2024, hospital-based labs expanded in-house hormone testing capabilities, preferring ELISA and high-throughput formats for perinatal hormone panels.

Centralized testing in hospital systems allows for integrated diagnostics across OB-GYN, neonatology, and psychiatry departments. Real-time results, tied to labor-induction drugs or breastfeeding support, have driven hospital demand for on-site oxytocin quantification.

  • Siemens Healthineers supported lab integration of oxytocin assays in tertiary hospitals.
  • Randox Laboratories enabled oxytocin testing in multi-analyte maternal health panels.
  • Beckman Coulter expanded reagent access for hospital-based hormone profiling units.

Top Oxytocin Testing Kits Market Dynamics

The oxytocin testing kits industry is growing due to advancements in immunoassay technologies and rising demand for accurate hormonal assessments. Increased research into oxytocin’s role in social bonding, stress, and mental health is driving the need for precise, accessible testing methods.

Industry Expansion Driven by Technological Advancements

The oxytocin testing kit market is benefiting from significant advancements in immunoassay technologies, such as ELISA and chemiluminescent assays. These innovations have increased the sensitivity and accuracy of oxytocin detection, enabling precise measurements at low concentrations.

In 2024, the global demand for these testing kits is expected to reach USD 370 million, with a projected CAGR of 6.5% through 2035. Research into oxytocin's effects on social bonding, mental health, and stress response is also fueling growth, with studies showing a 40% increase in research funding in neurobiology, pushing the demand for reliable oxytocin quantification tools.

  • Immunoassay technologies like ELISA and chemiluminescent assays have increased sensitivity and accuracy, enhancing testing reliability.
  • Research into oxytocin’s broader roles in mental health, social bonding, and stress regulation is leading to a 25% annual rise in demand for testing kits.
  • Increased funding in neuroscience and endocrinology has driven a 40% increase in research investments, facilitating growth.

Challenges in Achieving Standardization and Accessibility

The oxytocin testing kits market faces several challenges that hinder its full growth potential. Variability in oxytocin levels between individuals and biological samples complicates result consistency, with differences of up to 30% observed in clinical studies. The lack of standardized protocols for sample collection and handling is contributing to data discrepancies, making reliable testing difficult.

Additionally, the cost of advanced testing kits, which range from USD 500 to USD 2,000, limits their accessibility. In 2024, approximately 15% of hospitals in low-resource regions reported limited access to these testing tools due to cost and supply chain issues.
  • Variability in oxytocin levels across biological samples causes a 30% variation in test results, impacting consistency and reliability.
  • Lack of standardized collection protocols leads to inconsistent data, delaying adoption in clinical and research settings.
  • High costs of testing kits, ranging from USD 500 to USD 2,000, restrict access, with 15% of hospitals in low-resource regions reporting challenges in procurement.

Top Countries Manufacturing, Distributing, and Scaling Oxytocin Testing Kits

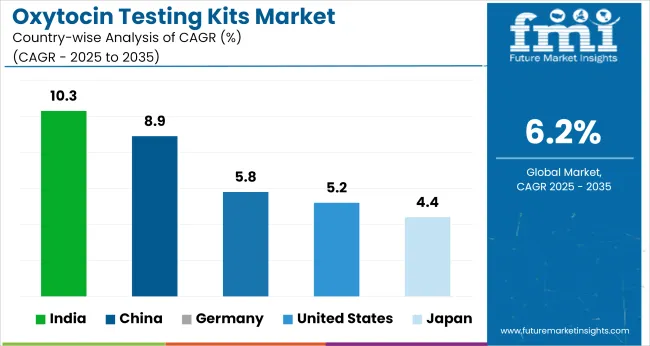
Oxytocin Testing Kits Market Cagr Analysis By Country

Countries CAGR (2025 to 2035)
United States 5.2%
Germany 5.8%
China 8.9%
Japan 4.4%
India 10.3%

The global oxytocin testing kits market is projected to grow at a 6.2% CAGR between 2025 and 2035. Among the 40+ countries analyzed, India leads at 10.3%, followed by China at 8.9%. Both BRICS economies are witnessing increased demand due to rising maternal health screening, expanded public health procurement, and localized diagnostic kit production. Indian manufacturers are scaling lateral flow and ELISA-based kits to meet both domestic and African tenders.

Germany posts 5.8%, just below the global average, reflecting consistent use in maternity wards and hospital labs. The USA follows at 5.2%, with growth tempered by reliance on centralized lab testing and stringent FDA pathways. Japan records the lowest at 4.4%, shaped by low childbirth rates and limited decentralized screening protocols. Contrasts between BRICS and OECD countries reflect differences in public health policy mandates, procurement centralization, and the role of in-clinic diagnostics versus outsourced lab infrastructure.

Demand Outlook for Oxytocin Testing Kits in the United States

A CAGR of 5.2% has been projected for the Oxytocin Testing Kits market in the United States during 2025 to 2035, rising from 3.9% during 2020 to 2024.During the historical period, most demand was limited to fertility testing and small-scale academic research.

Between 2025 and 2035, oxytocin testing kits were integrated into broader endocrine diagnostic protocols, particularly in behavioral health. Mental wellness clinics and psychiatric units began ordering bulk diagnostic panels, aided by evolving insurance reimbursement structures.

Multiplex hormonal testing formats became more common, driving the inclusion of oxytocin biomarkers across outpatient programs and wellness centers. Diagnostic vendors targeting neurohormonal pathways recorded increased kit consumption.

  • Behavioral clinics conducted 61% of tests in 2026
  • Panel-based endocrine testing grew 2.2× between 2025 and 2028
  • Oxytocin-linked diagnostics rose 38% in outpatient psychiatry use

Opportunity Analysis of the Oxytocin Testing Kits Market in Germany

Germany is forecast to record a CAGR of 5.8% between 2025 and 2035, compared to 4.1% from 2020 to 2024. During the earlier phase, demand was limited to research facilities and IVF clinics. From 2025 onward, oxytocin testing kits were adopted by mid-sized hospitals and private diagnostic chains in maternity care, postpartum hormone evaluation, and behavioral neurology.

CE-certified kits gained approval across both inpatient and home collection segments, influencing adoption across the diagnostics value chain. Maternal health centers integrated the tests in hormone screening pathways to assess bonding disorders. Demand also grew in youth mental health initiatives.

  • 52% of tests in 2027 originated from gynecology departments
  • 73% of postpartum evaluations included oxytocin markers
  • CE-compliant test kits expanded 3.1× during 2025 to 2028

Growth Analysis of the Oxytocin Testing Kits Market in China

China is projected to grow at a CAGR of 8.9% from 2025 to 2035, up from 6.7% between 2020 and 2024. Early usage patterns were driven by universities and government-funded laboratories importing diagnostic reagents. From 2025, locally produced oxytocin testing kits were rolled out across tiered provincial healthcare systems.

These tests have been used for maternal hormone monitoring, neuroendocrine screening, and emotion-linked mental health diagnostics. Regulatory reforms allowed the National Medical Products Administration (NMPA) to expedite test kit clearances, which encouraged domestic players to commercialize over 500 variants. Regional procurement networks prioritized high-volume centers and mental health programs.

  • Provincial hospitals ran 58% of tests in 2026
  • 34% of mental health assessments included oxytocin panels
  • NMPA-cleared kits expanded 4.1× from 2025 to 2029

In-Depth Analysis of the Oxytocin Testing Kits Market in Japan

Japan is expected to register a CAGR of 4.4% from 2025 to 2035, compared to 3.2% recorded during 2020 to 2024. Early demand was concentrated in academic neurology and endocrine labs with limited commercial scale. In the next decade, oxytocin testing kits were introduced in corporate wellness programs and maternity care diagnostics.

Employers and maternity clinics began using hormonal testing to assess bonding patterns, stress adaptation, and hormone-related mental states. Local manufacturers secured Japan Pharmacopoeia certification for home-use test kits. Health institutions across Osaka and Tokyo deployed them in outpatient preventive care systems.

  • 46% of kits in 2026 were used in corporate wellness programs
  • Maternity centers doubled usage of oxytocin tests post to 2025
  • Japan Pharmacopoeia-certified kits reached 81% adoption by 2027

India Oxytocin Testing Kits Market Growth Trajectory

India is forecast to record a CAGR of 10.3% from 2025 to 2035, rising from 7.2% during 2020 to 2024. Previously, usage was concentrated among IVF clinics and imported products in private labs. From 2025 onward, Indian diagnostic brands developed oxytocin testing kits targeted at public hospitals, adolescent mental health screenings, and maternal hormone evaluations.

CDSCO clearances for domestic manufacturers improved procurement through government tenders. Usage has expanded across district-level clinics as psychological diagnostics became integrated into school and youth wellness programs. Kits also supported community-based maternal care under state-funded schemes in Maharashtra and Tamil Nadu.
  • 51% of test volume in 2026 came from maternity clinics
  • Public procurement raised usage 4.3× post to 2025
  • 65 Indian-made kits received CDSCO clearance by 2028

Leading Oxytocin Testing Kits Manufacturers

Oxytocin Testing Kits Market Analysis By Company

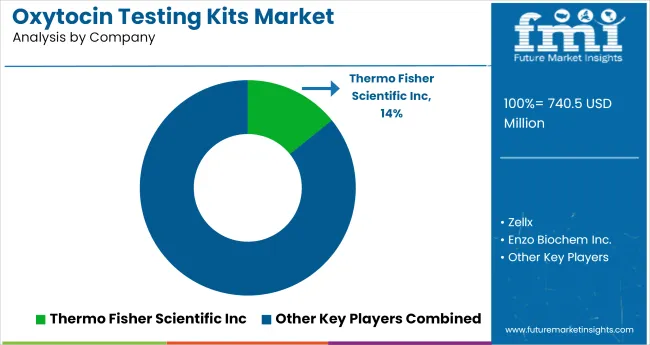
The oxytocin testing kits market is characterized by active participation from both multinational diagnostic firms and emerging bioscience companies. Thermo Fisher Scientific Inc. and Enzo Biochem Inc. lead the space with validated ELISA and immunoassay platforms used in academic, clinical, and behavioral research.

FUJIFILM Wako Pure Chemical Corporation has also gained traction by offering reliable assay reagents tailored for neuroendocrine and psychiatric research applications. These firms maintain distribution networks across North America, Europe, and East Asia, ensuring standardization and compliance across regulated labs.

Smaller firms such as Elabscience®, Zellx, RayBiotech, and Abbexa are expanding reach via customized assay kits and technical support, especially for preclinical and translational studies. ELK Biotechnology and Wuhan Fine Biotech Co., Ltd focus on cost-competitive multiplex solutions for global labs with limited funding. These suppliers are competing on sensitivity range, assay turnaround time, and cross-species compatibility.

Recent Oxytocin Testing Kits Industry News

  • In July 2025, RayBiotech launched its Human/Mouse/Rat Oxytocin EIA Kit, optimized for use with serum, plasma, and cell culture media. The product was formally introduced via the company’s official site and is designed to support neuroscience and behavioral research, marking the company’s expansion in the hormone quantification segment.
  • In May 2024, FUJIFILM Wako Pure Chemical Corporation announced the installation of new equipment at its Osaka manufacturing site to triple GMP raw material production capacity. This investment aims to strengthen its supply capabilities for pharmaceutical-grade reagents, supporting the rising global demand for biologics and diagnostic components.

Research Coverage and Scope Summary

Report Attributes Details
Industry Size (2025) USD 740.5 million
Projected Industry Size (2035) USD 1,351.4 million
CAGR (2025 to 2035) 6.2%
Base Year for Estimation 2024
Historical Period 2020 to 2024
Projections Period 2025 to 2035
Quantitative Units USD million for value and thousand units for volume
Test Kits Analyzed (Segment 1) ELISA Kits, RIA Kits, CLIA Kits, LC-MS/MS Kits, Rapid POC Kits, Biosensor/Multiplex Kits
Applications Analyzed (Segment 2) Obstetrics and Reproductive Health, Neuropsychiatric and Behavioral Research, Endocrinology and Metabolic Disorders, Pharma/Biotech R&D, Veterinary Applications
End Users Analyzed (Segment 3) Hospitals, Maternity Centers, Pharmaceutical Companies, Diagnostic Laboratories, Academic and Research Institutes, Veterinary Hospitals and Clinics
Regions Covered North America, Latin America, Western Europe, Eastern Europe, East Asia, South Asia & Pacific
Countries Covered United States, Canada, Germany, United Kingdom, France, Italy, Spain, China, India, Japan, South Korea, Australia, Brazil, Mexico, Argentina, Saudi Arabia, UAE, South Africa
Key Players Elabscience ®, Thermo Fisher Scientific Inc, Zellx, Enzo Biochem Inc., FUJIFILM Wako Pure Chemical Corporation, RayBiotech, Inc., ELK Biotechnology CO., Ltd., Wuhan Fine Biotech Co., Ltd, Abbexa
Additional Attributes Dollar sales by test kit type and application, expansion of neurobehavioral research, increased use in reproductive diagnostics, rise in multiplex biosensor development, veterinary sector adoption trends

Leading Players in Oxytocin Testing Kits Market

  • Elabscience®
  • Thermo Fisher Scientific Inc
  • Zellx
  • Enzo Biochem Inc.
  • FUJIFILM Wako Pure Chemical Corporation
  • RayBiotech, Inc.
  • ELK Biotechnology CO., Ltd.
  • Wuhan Fine Biotech Co., Ltd
  • Abbexa

Key Segments

By Test Kits:

The industry includes ELISA kits, RIA kits, CLIA kits, LC-MS/MS kits, Rapid POC kits, and biosensor/multiplex kits.

By Application:

The market covers obstetrics and reproductive health, neuropsychiatric and behavioral research, endocrinology and metabolic disorders, pharma/biotech R&D, and veterinary applications.

By End User:

These products are used by hospitals, maternity centers, pharmaceutical companies, diagnostic laboratories, academic and research institutes, and veterinary hospitals and clinics.

By Region:

The industry is segmented as North America, Latin America, Western Europe, Eastern Europe, East Asia, South Asia & Pacific.

Table of Content

  1. Executive Summary
    • Global Market Outlook
    • Demand-side Trends
    • Supply-side Trends
    • Technology Roadmap Analysis
    • Analysis and Recommendations
  2. Market Overview
    • Market Coverage / Taxonomy
    • Market Definition / Scope / Limitations
  3. Market Background
    • Market Dynamics
      • Drivers
      • Restraints
      • Opportunity
      • Trends
    • Scenario Forecast
      • Demand in Optimistic Scenario
      • Demand in Likely Scenario
      • Demand in Conservative Scenario
    • Opportunity Map Analysis
    • Product Life Cycle Analysis
    • Supply Chain Analysis
      • Supply Side Participants and their Roles
        • Producers
        • Mid-Level Participants (Traders/ Agents/ Brokers)
        • Wholesalers and Distributors
      • Value Added and Value Created at Node in the Supply Chain
      • List of Raw Material Suppliers
      • List of Existing and Potential Buyer’s
    • Investment Feasibility Matrix
    • Value Chain Analysis
      • Profit Margin Analysis
      • Wholesalers and Distributors
      • Retailers
    • PESTLE and Porter’s Analysis
    • Regulatory Landscape
      • By Key Regions
      • By Key Countries
    • Regional Parent Market Outlook
    • Production and Consumption Statistics
    • Import and Export Statistics
  4. Global Market Analysis 2020 to 2024 and Forecast, 2025 to 2035
    • Historical Market Size Value (USD Million) & Volume (Thousand Units) Analysis, 2020 to 2024
    • Current and Future Market Size Value (USD Million) & Volume (Thousand Units) Projections, 2025 to 2035
      • Y-o-Y Growth Trend Analysis
      • Absolute $ Opportunity Analysis
  5. Global Market Pricing Analysis 2020 to 2024 and Forecast 2025 to 2035
  6. Global Market Analysis 2020 to 2024 and Forecast 2025 to 2035, By Test Kits
    • Introduction / Key Findings
    • Historical Market Size Value (USD Million) & Volume (Thousand Units) Analysis by Test Kits, 2020 to 2024
    • Current and Future Market Size Value (USD Million) & Volume (Thousand Units) Analysis and Forecast by Test Kits, 2025 to 2035
      • ELISA Kits
      • RIA Kits
      • CLIA Kits
      • LC-MS/MS Kits
      • Rapid POC Kits
      • Biosensor/Multiplex Kits
    • Y-o-Y Growth Trend Analysis By Test Kits, 2020 to 2024
    • Absolute $ Opportunity Analysis By Test Kits, 2025 to 2035
  7. Global Market Analysis 2020 to 2024 and Forecast 2025 to 2035, By Application
    • Introduction / Key Findings
    • Historical Market Size Value (USD Million) & Volume (Thousand Units) Analysis By Application, 2020 to 2024
    • Current and Future Market Size Value (USD Million) & Volume (Thousand Units) Analysis and Forecast By Application, 2025 to 2035
      • Obstetrics & Reproductive Health
      • Neuropsychiatric & Behavioral Research
      • Endocrinology & Metabolic Disorders
      • Pharma/Biotech R&D
      • Veterinary Applications
    • Y-o-Y Growth Trend Analysis By Application, 2020 to 2024
    • Absolute $ Opportunity Analysis By Application, 2025 to 2035
  8. Global Market Analysis 2020 to 2024 and Forecast 2025 to 2035, By End User
    • Introduction / Key Findings
    • Historical Market Size Value (USD Million) & Volume (Thousand Units) Analysis By End User, 2020 to 2024
    • Current and Future Market Size Value (USD Million) & Volume (Thousand Units) Analysis and Forecast By End User, 2025 to 2035
      • Hospitals
      • Maternity Centers
      • Pharmaceutical Companies
      • Diagnostic Laboratories
      • Academic & Research Institutes
      • Veterinary Hospitals and Clinics
    • Y-o-Y Growth Trend Analysis By End User, 2020 to 2024
    • Absolute $ Opportunity Analysis By End User, 2025 to 2035
  9. Global Market Analysis 2020 to 2024 and Forecast 2025 to 2035, By Region
    • Introduction
    • Historical Market Size Value (USD Million) & Volume (Thousand Units) Analysis By Region, 2020 to 2024
    • Current Market Size Value (USD Million) & Volume (Thousand Units) Analysis and Forecast By Region, 2025 to 2035
      • North America
      • Latin America
      • Western Europe
      • Eastern Europe
      • East Asia
      • South Asia & Pacific
      • Middle East and Africa
    • Market Attractiveness Analysis By Region
  10. North America Market Analysis 2020 to 2024 and Forecast 2025 to 2035, By Country
    • Historical Market Size Value (USD Million) & Volume (Thousand Units) Trend Analysis By Market Taxonomy, 2020 to 2024
    • Market Size Value (USD Million) & Volume (Thousand Units) Forecast By Market Taxonomy, 2025 to 2035
      • By Country
        • USA
        • Canada
        • Mexico
      • By Test Kits
      • By Application
      • By End User
    • Market Attractiveness Analysis
      • By Country
      • By Test Kits
      • By Application
      • By End User
    • Key Takeaways
  11. Latin America Market Analysis 2020 to 2024 and Forecast 2025 to 2035, By Country
    • Historical Market Size Value (USD Million) & Volume (Thousand Units) Trend Analysis By Market Taxonomy, 2020 to 2024
    • Market Size Value (USD Million) & Volume (Thousand Units) Forecast By Market Taxonomy, 2025 to 2035
      • By Country
        • Brazil
        • Argentina
        • Rest of LATAM
      • By Test Kits
      • By Application
      • By End User
    • Market Attractiveness Analysis
      • By Country
      • By Test Kits
      • By Application
      • By End User
    • Key Takeaways
  12. Western Europe Market Analysis 2020 to 2024 and Forecast 2025 to 2035, By Country
    • Historical Market Size Value (USD Million) & Volume (Thousand Units) Trend Analysis by Market Taxonomy, 2020 to 2024
    • Market Size Value (USD Million) & Volume (Thousand Units) Forecast By Market Taxonomy, 2025 to 2035
      • By Country
        • Germany
        • Italy
        • France
        • UK
        • Spain
        • BENELUX
        • Nordic
        • Rest of W.Europe
      • By Test Kits
      • By Application
      • By End User
    • Market Attractiveness Analysis
      • By Country
      • By Test Kits
      • By Application
      • By End User
    • Key Takeaways
  13. Eastern Europe Market Analysis 2020 to 2024 and Forecast 2025 to 2035, By Country
    • Historical Market Size Value (USD Million) & Volume (Thousand Units) Trend Analysis By Market Taxonomy, 2020 to 2024
    • Market Size Value (USD Million) & Volume (Thousand Units) Forecast By Market Taxonomy, 2025 to 2035
      • By Country
        • Russia
        • Hungary
        • Poland
        • Balkan & Baltics
        • Rest of E. Europe
      • By Test Kits
      • By Application
      • By End User
    • Market Attractiveness Analysis
      • By Country
      • By Test Kits
      • By Application
      • By End User
    • Key Takeaways
  14. East Asia Market Analysis 2020 to 2024 and Forecast 2025 to 2035, By Country
    • Historical Market Size Value (USD Million) & Volume (Thousand Units) Trend Analysis By Market Taxonomy, 2020 to 2024
    • Market Size Value (USD Million) & Volume (Thousand Units) Forecast By Market Taxonomy, 2025 to 2035
      • By Country
        • China
        • Japan
        • South Korea
      • By Test Kits
      • By Application
      • By End User
    • Market Attractiveness Analysis
      • By Country
      • By Test Kits
      • By Application
      • By End User
    • Key Takeaways
  15. South Asia & Pacific Market Analysis 2020 to 2024 and Forecast 2025 to 2035, By Country
    • Historical Market Size Value (USD Million) & Volume (Thousand Units) Trend Analysis By Market Taxonomy, 2020 to 2024
    • Market Size Value (USD Million) & Volume (Thousand Units) Forecast By Market Taxonomy, 2025 to 2035
      • By Country
        • India
        • Australia & New Zealand
        • ASEAN
        • Rest of SAP
      • By Test Kits
      • By Application
      • By End User
    • Market Attractiveness Analysis
      • By Country
      • By Test Kits
      • By Application
      • By End User
    • Key Takeaways
  16. Middle East and Africa Market Analysis 2020 to 2024 and Forecast 2025 to 2035, By Country
    • Historical Market Size Value (USD Million) & Volume (Thousand Units) Trend Analysis By Market Taxonomy, 2020 to 2024
    • Market Size Value (USD Million) & Volume (Thousand Units) Forecast By Market Taxonomy, 2025 to 2035
      • By Country
        • GCC Countries
        • Northern Africa
        • South Africa
        • Turkiye
        • Rest of MEA
      • By Test Kits
      • By Application
      • By End User
    • Market Attractiveness Analysis
      • By Country
      • By Test Kits
      • By Application
      • By End User
    • Key Takeaways
  17. Key Countries Market Analysis
    • USA
      • Pricing Analysis
      • Market Share Analysis, 2024
        • By Test Kits
        • By Application
        • By End User
    • Canada
      • Pricing Analysis
      • Market Share Analysis, 2024
        • By Test Kits
        • By Application
        • By End User
    • Brazil
      • Pricing Analysis
      • Market Share Analysis, 2024
        • By Test Kits
        • By Application
        • By End User
    • Mexico
      • Pricing Analysis
      • Market Share Analysis, 2024
        • By Test Kits
        • By Application
        • By End User
    • Argentina
      • Pricing Analysis
      • Market Share Analysis, 2024
        • By Test Kits
        • By Application
        • By End User
  18. Market Structure Analysis
    • Competition Dashboard
    • Competition Benchmarking
    • Market Share Analysis of Top Players
      • By Regional
      • By Test Kits
      • By Application
      • By End User
  19. Competition Analysis
    • Competition Deep Dive
      • Elabscience®
        • Overview
        • Product Portfolio
        • Profitability by Market Segments (Product/Age /Sales Channel/Region)
        • Sales Footprint
        • Strategy Overview
          • Marketing Strategy
          • Product Strategy
          • Channel Strategy
      • Thermo Fisher Scientific Inc
        • Overview
        • Product Portfolio
        • Profitability by Market Segments (Product/Age /Sales Channel/Region)
        • Sales Footprint
        • Strategy Overview
          • Marketing Strategy
          • Product Strategy
          • Channel Strategy
      • Zellx
        • Overview
        • Product Portfolio
        • Profitability by Market Segments (Product/Age /Sales Channel/Region)
        • Sales Footprint
        • Strategy Overview
          • Marketing Strategy
          • Product Strategy
          • Channel Strategy
      • Enzo Biochem Inc.
        • Overview
        • Product Portfolio
        • Profitability by Market Segments (Product/Age /Sales Channel/Region)
        • Sales Footprint
        • Strategy Overview
          • Marketing Strategy
          • Product Strategy
          • Channel Strategy
      • FUJIFILM Wako Pure Chemical Corporation
        • Overview
        • Product Portfolio
        • Profitability by Market Segments (Product/Age /Sales Channel/Region)
        • Sales Footprint
        • Strategy Overview
          • Marketing Strategy
          • Product Strategy
          • Channel Strategy
      • RayBiotech, Inc.
        • Overview
        • Product Portfolio
        • Profitability by Market Segments (Product/Age /Sales Channel/Region)
        • Sales Footprint
        • Strategy Overview
          • Marketing Strategy
          • Product Strategy
          • Channel Strategy
      • ELK Biotechnology CO.,Ltd.
        • Overview
        • Product Portfolio
        • Profitability by Market Segments (Product/Age /Sales Channel/Region)
        • Sales Footprint
        • Strategy Overview
          • Marketing Strategy
          • Product Strategy
          • Channel Strategy
      • Wuhan Fine Biotech Co., Ltd
        • Overview
        • Product Portfolio
        • Profitability by Market Segments (Product/Age /Sales Channel/Region)
        • Sales Footprint
        • Strategy Overview
          • Marketing Strategy
          • Product Strategy
          • Channel Strategy
      • Abbexa
        • Overview
        • Product Portfolio
        • Profitability by Market Segments (Product/Age /Sales Channel/Region)
        • Sales Footprint
        • Strategy Overview
          • Marketing Strategy
          • Product Strategy
          • Channel Strategy
  20. Assumptions & Acronyms Used
  21. Research Methodology

List of Tables

  • Table 1: Global Market Value (USD Million) Forecast by Region, 2020 to 2035
  • Table 2: Global Market Volume (Thousand Units) Forecast by Region, 2020 to 2035
  • Table 3: Global Market Value (USD Million) Forecast by Test Kits, 2020 to 2035
  • Table 4: Global Market Volume (Thousand Units) Forecast by Test Kits, 2020 to 2035
  • Table 5: Global Market Value (USD Million) Forecast by Application, 2020 to 2035
  • Table 6: Global Market Volume (Thousand Units) Forecast by Application, 2020 to 2035
  • Table 7: Global Market Value (USD Million) Forecast by End User, 2020 to 2035
  • Table 8: Global Market Volume (Thousand Units) Forecast by End User, 2020 to 2035
  • Table 9: North America Market Value (USD Million) Forecast by Country, 2020 to 2035
  • Table 10: North America Market Volume (Thousand Units) Forecast by Country, 2020 to 2035
  • Table 11: North America Market Value (USD Million) Forecast by Test Kits, 2020 to 2035
  • Table 12: North America Market Volume (Thousand Units) Forecast by Test Kits, 2020 to 2035
  • Table 13: North America Market Value (USD Million) Forecast by Application, 2020 to 2035
  • Table 14: North America Market Volume (Thousand Units) Forecast by Application, 2020 to 2035
  • Table 15: North America Market Value (USD Million) Forecast by End User, 2020 to 2035
  • Table 16: North America Market Volume (Thousand Units) Forecast by End User, 2020 to 2035
  • Table 17: Latin America Market Value (USD Million) Forecast by Country, 2020 to 2035
  • Table 18: Latin America Market Volume (Thousand Units) Forecast by Country, 2020 to 2035
  • Table 19: Latin America Market Value (USD Million) Forecast by Test Kits, 2020 to 2035
  • Table 20: Latin America Market Volume (Thousand Units) Forecast by Test Kits, 2020 to 2035
  • Table 21: Latin America Market Value (USD Million) Forecast by Application, 2020 to 2035
  • Table 22: Latin America Market Volume (Thousand Units) Forecast by Application, 2020 to 2035
  • Table 23: Latin America Market Value (USD Million) Forecast by End User, 2020 to 2035
  • Table 24: Latin America Market Volume (Thousand Units) Forecast by End User, 2020 to 2035
  • Table 25: Western Europe Market Value (USD Million) Forecast by Country, 2020 to 2035
  • Table 26: Western Europe Market Volume (Thousand Units) Forecast by Country, 2020 to 2035
  • Table 27: Western Europe Market Value (USD Million) Forecast by Test Kits, 2020 to 2035
  • Table 28: Western Europe Market Volume (Thousand Units) Forecast by Test Kits, 2020 to 2035
  • Table 29: Western Europe Market Value (USD Million) Forecast by Application, 2020 to 2035
  • Table 30: Western Europe Market Volume (Thousand Units) Forecast by Application, 2020 to 2035
  • Table 31: Western Europe Market Value (USD Million) Forecast by End User, 2020 to 2035
  • Table 32: Western Europe Market Volume (Thousand Units) Forecast by End User, 2020 to 2035
  • Table 33: Eastern Europe Market Value (USD Million) Forecast by Country, 2020 to 2035
  • Table 34: Eastern Europe Market Volume (Thousand Units) Forecast by Country, 2020 to 2035
  • Table 35: Eastern Europe Market Value (USD Million) Forecast by Test Kits, 2020 to 2035
  • Table 36: Eastern Europe Market Volume (Thousand Units) Forecast by Test Kits, 2020 to 2035
  • Table 37: Eastern Europe Market Value (USD Million) Forecast by Application, 2020 to 2035
  • Table 38: Eastern Europe Market Volume (Thousand Units) Forecast by Application, 2020 to 2035
  • Table 39: Eastern Europe Market Value (USD Million) Forecast by End User, 2020 to 2035
  • Table 40: Eastern Europe Market Volume (Thousand Units) Forecast by End User, 2020 to 2035
  • Table 41: East Asia Market Value (USD Million) Forecast by Country, 2020 to 2035
  • Table 42: East Asia Market Volume (Thousand Units) Forecast by Country, 2020 to 2035
  • Table 43: East Asia Market Value (USD Million) Forecast by Test Kits, 2020 to 2035
  • Table 44: East Asia Market Volume (Thousand Units) Forecast by Test Kits, 2020 to 2035
  • Table 45: East Asia Market Value (USD Million) Forecast by Application, 2020 to 2035
  • Table 46: East Asia Market Volume (Thousand Units) Forecast by Application, 2020 to 2035
  • Table 47: East Asia Market Value (USD Million) Forecast by End User, 2020 to 2035
  • Table 48: East Asia Market Volume (Thousand Units) Forecast by End User, 2020 to 2035
  • Table 49: South Asia & Pacific Market Value (USD Million) Forecast by Country, 2020 to 2035
  • Table 50: South Asia & Pacific Market Volume (Thousand Units) Forecast by Country, 2020 to 2035
  • Table 51: South Asia & Pacific Market Value (USD Million) Forecast by Test Kits, 2020 to 2035
  • Table 52: South Asia & Pacific Market Volume (Thousand Units) Forecast by Test Kits, 2020 to 2035
  • Table 53: South Asia & Pacific Market Value (USD Million) Forecast by Application, 2020 to 2035
  • Table 54: South Asia & Pacific Market Volume (Thousand Units) Forecast by Application, 2020 to 2035
  • Table 55: South Asia & Pacific Market Value (USD Million) Forecast by End User, 2020 to 2035
  • Table 56: South Asia & Pacific Market Volume (Thousand Units) Forecast by End User, 2020 to 2035
  • Table 57: Middle East and Africa Market Value (USD Million) Forecast by Country, 2020 to 2035
  • Table 58: Middle East and Africa Market Volume (Thousand Units) Forecast by Country, 2020 to 2035
  • Table 59: Middle East and Africa Market Value (USD Million) Forecast by Test Kits, 2020 to 2035
  • Table 60: Middle East and Africa Market Volume (Thousand Units) Forecast by Test Kits, 2020 to 2035
  • Table 61: Middle East and Africa Market Value (USD Million) Forecast by Application, 2020 to 2035
  • Table 62: Middle East and Africa Market Volume (Thousand Units) Forecast by Application, 2020 to 2035
  • Table 63: Middle East and Africa Market Value (USD Million) Forecast by End User, 2020 to 2035
  • Table 64: Middle East and Africa Market Volume (Thousand Units) Forecast by End User, 2020 to 2035

List of Figures

  • Figure 1: Global Market Volume (Thousand Units) Forecast 2020 to 2035
  • Figure 2: Global Market Pricing Analysis
  • Figure 3: Global Market Value (USD Million) Forecast 2020 to 2035
  • Figure 4: Global Market Value Share and BPS Analysis by Test Kits, 2025 and 2035
  • Figure 5: Global Market Y-o-Y Growth Comparison by Test Kits, 2025 to 2035
  • Figure 6: Global Market Attractiveness Analysis by Test Kits
  • Figure 7: Global Market Value Share and BPS Analysis by Application, 2025 and 2035
  • Figure 8: Global Market Y-o-Y Growth Comparison by Application, 2025 to 2035
  • Figure 9: Global Market Attractiveness Analysis by Application
  • Figure 10: Global Market Value Share and BPS Analysis by End User, 2025 and 2035
  • Figure 11: Global Market Y-o-Y Growth Comparison by End User, 2025 to 2035
  • Figure 12: Global Market Attractiveness Analysis by End User
  • Figure 13: Global Market Value (USD Million) Share and BPS Analysis by Region, 2025 and 2035
  • Figure 14: Global Market Y-o-Y Growth Comparison by Region, 2025 to 2035
  • Figure 15: Global Market Attractiveness Analysis by Region
  • Figure 16: North America Market Incremental $ Opportunity, 2025 to 2035
  • Figure 17: Latin America Market Incremental $ Opportunity, 2025 to 2035
  • Figure 18: Western Europe Market Incremental $ Opportunity, 2025 to 2035
  • Figure 19: Eastern Europe Market Incremental $ Opportunity, 2025 to 2035
  • Figure 20: East Asia Market Incremental $ Opportunity, 2025 to 2035
  • Figure 21: South Asia & Pacific Market Incremental $ Opportunity, 2025 to 2035
  • Figure 22: Middle East and Africa Market Incremental $ Opportunity, 2025 to 2035
  • Figure 23: North America Market Value Share and BPS Analysis by Country, 2025 and 2035
  • Figure 24: North America Market Value Share and BPS Analysis by Test Kits, 2025 and 2035
  • Figure 25: North America Market Y-o-Y Growth Comparison by Test Kits, 2025 to 2035
  • Figure 26: North America Market Attractiveness Analysis by Test Kits
  • Figure 27: North America Market Value Share and BPS Analysis by Application, 2025 and 2035
  • Figure 28: North America Market Y-o-Y Growth Comparison by Application, 2025 to 2035
  • Figure 29: North America Market Attractiveness Analysis by Application
  • Figure 30: North America Market Value Share and BPS Analysis by End User, 2025 and 2035
  • Figure 31: North America Market Y-o-Y Growth Comparison by End User, 2025 to 2035
  • Figure 32: North America Market Attractiveness Analysis by End User
  • Figure 33: Latin America Market Value Share and BPS Analysis by Country, 2025 and 2035
  • Figure 34: Latin America Market Value Share and BPS Analysis by Test Kits, 2025 and 2035
  • Figure 35: Latin America Market Y-o-Y Growth Comparison by Test Kits, 2025 to 2035
  • Figure 36: Latin America Market Attractiveness Analysis by Test Kits
  • Figure 37: Latin America Market Value Share and BPS Analysis by Application, 2025 and 2035
  • Figure 38: Latin America Market Y-o-Y Growth Comparison by Application, 2025 to 2035
  • Figure 39: Latin America Market Attractiveness Analysis by Application
  • Figure 40: Latin America Market Value Share and BPS Analysis by End User, 2025 and 2035
  • Figure 41: Latin America Market Y-o-Y Growth Comparison by End User, 2025 to 2035
  • Figure 42: Latin America Market Attractiveness Analysis by End User
  • Figure 43: Western Europe Market Value Share and BPS Analysis by Country, 2025 and 2035
  • Figure 44: Western Europe Market Value Share and BPS Analysis by Test Kits, 2025 and 2035
  • Figure 45: Western Europe Market Y-o-Y Growth Comparison by Test Kits, 2025 to 2035
  • Figure 46: Western Europe Market Attractiveness Analysis by Test Kits
  • Figure 47: Western Europe Market Value Share and BPS Analysis by Application, 2025 and 2035
  • Figure 48: Western Europe Market Y-o-Y Growth Comparison by Application, 2025 to 2035
  • Figure 49: Western Europe Market Attractiveness Analysis by Application
  • Figure 50: Western Europe Market Value Share and BPS Analysis by End User, 2025 and 2035
  • Figure 51: Western Europe Market Y-o-Y Growth Comparison by End User, 2025 to 2035
  • Figure 52: Western Europe Market Attractiveness Analysis by End User
  • Figure 53: Eastern Europe Market Value Share and BPS Analysis by Country, 2025 and 2035
  • Figure 54: Eastern Europe Market Value Share and BPS Analysis by Test Kits, 2025 and 2035
  • Figure 55: Eastern Europe Market Y-o-Y Growth Comparison by Test Kits, 2025 to 2035
  • Figure 56: Eastern Europe Market Attractiveness Analysis by Test Kits
  • Figure 57: Eastern Europe Market Value Share and BPS Analysis by Application, 2025 and 2035
  • Figure 58: Eastern Europe Market Y-o-Y Growth Comparison by Application, 2025 to 2035
  • Figure 59: Eastern Europe Market Attractiveness Analysis by Application
  • Figure 60: Eastern Europe Market Value Share and BPS Analysis by End User, 2025 and 2035
  • Figure 61: Eastern Europe Market Y-o-Y Growth Comparison by End User, 2025 to 2035
  • Figure 62: Eastern Europe Market Attractiveness Analysis by End User
  • Figure 63: East Asia Market Value Share and BPS Analysis by Country, 2025 and 2035
  • Figure 64: East Asia Market Value Share and BPS Analysis by Test Kits, 2025 and 2035
  • Figure 65: East Asia Market Y-o-Y Growth Comparison by Test Kits, 2025 to 2035
  • Figure 66: East Asia Market Attractiveness Analysis by Test Kits
  • Figure 67: East Asia Market Value Share and BPS Analysis by Application, 2025 and 2035
  • Figure 68: East Asia Market Y-o-Y Growth Comparison by Application, 2025 to 2035
  • Figure 69: East Asia Market Attractiveness Analysis by Application
  • Figure 70: East Asia Market Value Share and BPS Analysis by End User, 2025 and 2035
  • Figure 71: East Asia Market Y-o-Y Growth Comparison by End User, 2025 to 2035
  • Figure 72: East Asia Market Attractiveness Analysis by End User
  • Figure 73: South Asia & Pacific Market Value Share and BPS Analysis by Country, 2025 and 2035
  • Figure 74: South Asia & Pacific Market Value Share and BPS Analysis by Test Kits, 2025 and 2035
  • Figure 75: South Asia & Pacific Market Y-o-Y Growth Comparison by Test Kits, 2025 to 2035
  • Figure 76: South Asia & Pacific Market Attractiveness Analysis by Test Kits
  • Figure 77: South Asia & Pacific Market Value Share and BPS Analysis by Application, 2025 and 2035
  • Figure 78: South Asia & Pacific Market Y-o-Y Growth Comparison by Application, 2025 to 2035
  • Figure 79: South Asia & Pacific Market Attractiveness Analysis by Application
  • Figure 80: South Asia & Pacific Market Value Share and BPS Analysis by End User, 2025 and 2035
  • Figure 81: South Asia & Pacific Market Y-o-Y Growth Comparison by End User, 2025 to 2035
  • Figure 82: South Asia & Pacific Market Attractiveness Analysis by End User
  • Figure 83: Middle East and Africa Market Value Share and BPS Analysis by Country, 2025 and 2035
  • Figure 84: Middle East and Africa Market Value Share and BPS Analysis by Test Kits, 2025 and 2035
  • Figure 85: Middle East and Africa Market Y-o-Y Growth Comparison by Test Kits, 2025 to 2035
  • Figure 86: Middle East and Africa Market Attractiveness Analysis by Test Kits
  • Figure 87: Middle East and Africa Market Value Share and BPS Analysis by Application, 2025 and 2035
  • Figure 88: Middle East and Africa Market Y-o-Y Growth Comparison by Application, 2025 to 2035
  • Figure 89: Middle East and Africa Market Attractiveness Analysis by Application
  • Figure 90: Middle East and Africa Market Value Share and BPS Analysis by End User, 2025 and 2035
  • Figure 91: Middle East and Africa Market Y-o-Y Growth Comparison by End User, 2025 to 2035
  • Figure 92: Middle East and Africa Market Attractiveness Analysis by End User
  • Figure 93: Global Market - Tier Structure Analysis
  • Figure 94: Global Market - Company Share Analysis

Frequently Asked Questions

What is the projected industry size of the oxytocin testing kits market by 2035?

The industry is projected to reach USD 1,351.4 million by 2035.

What is the expected CAGR of the oxytocin testing kits market from 2025 to 2035?

The industry is expected to grow at a CAGR of 6.2% from 2025 to 2035.

Which segment is expected to lead the oxytocin testing kits market in 2025?

ELISA kits are expected to dominate with 57% share in 2025.

What is the industry size of the oxytocin testing kits market in 2025?

The industry is estimated to reach USD 740.5 million in 2025.

Which region is expected to witness the highest growth in the oxytocin testing kits market?

South Asia & Pacific, particularly India, is expected to be the key growth region with a projected growth rate of 10.3%.

Explore Similar Insights

Future Market Insights

Oxytocin Testing Kits Market