Paediatric influenza treatment market
Market Insights on Paediatric influenza treatment covering sales outlook, demand forecast & up-to-date key trends
Paediatric Influenza Treatment Market by Treatment Type, End User & Region - Forecast 2022 – 2032
Paediatric Influenza Treatment Market Outlook (2022-2032)
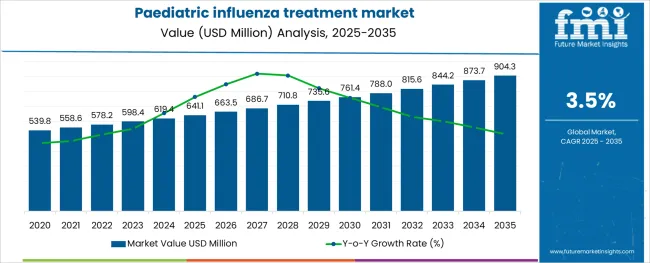
[323 Pages Report] The paediatric influenza treatment market is anticipated to rise to US$ 578.2 Million in 2022 and likely to reach US$ 847.7 Million by 2032 with a CAGR of 3.5% during the forecast period from 2022 to 2032.
Report Attribute |
Details |
Paediatric Influenza Treatment Market Value (2022) |
US$ 578.2 Million |
Paediatric Influenza Treatment Market Anticipated Forecast Value (2032) |
US$ 847.7 Million |
Paediatric Influenza Treatment Market Projected Growth Rate (2022-2032) |
3.5% |
Paediatric influenza treatment market share is likely to rise due to the increasing number of patients caused by respiratory infection during the forecast period from 2022 to 2032.
The disease can spread quickly through groups as the infection is passed from individual to individual, especially in children, which is anticipated to increase in the adoption of paediatric influenza treatment in recent years.
The patient is mainly caused by influenza A or influenza B virus, which happens in outbreaks worldwide consistently, primarily during the winter seasons in calm atmospheres. These factors directly increase the demand for paediatric influenza treatment in the coming forecast period.
The paediatric influenza treatment market growth is supposed to rise by the disease; here are a few symptoms include such as high-grade fever up to 104 degrees F, chills and shakes during fever, extreme tiredness, headache and body aches, dry, hacking cough, vomiting, and belly pain are anticipated to increase the paediatric influenza treatment market size.
The paediatric influenza treatment is the critical vector for the spread of ailment. The disease may affect newborn babies widely, which leads to an attack on their lungs and can be caused death. To avoid such things, the adoption of paediatric influenza treatment is growing all over the region during the forecast period.
However, antiviral professionally prescribed medications or antiviral medications might additionally be utilized for counteractive action in high-hazard patients, which leads to boosting in the paediatric influenza treatment statistics during the forecast period from 2022 to 2032.
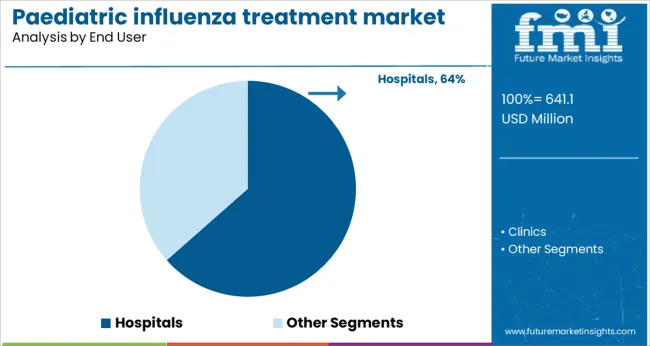
Children below 6 months are likely to provide flu vaccine as a treatment in the hospitals, and grow the paediatric influenza treatment market trends in the coming year.
Other treatments proposed by healthcare professionals include plenty of rest, plenty of fluids, and usage of acetaminophen or ibuprofen to lower fever and ease aches are driving the paediatric influenza treatment market share as per the paediatric influenza treatment market report.
Let us know your requirement to get
100% FREE customization
What Are Some Of The Factors Influencing The Paediatric Influenza Treatment Market?
Antiviral prescriptions are viable for the counteractive action of flu which is utilized for treatment and can diminish the span and seriousness of the disease and are likely to grow the paediatric influenza treatment market future trends in the coming year.
The development of the four authorized antiviral specialists, including oseltamivir, zanamivir, amantadine, and rimantadine, are some flowing flu infection strains that are likely to rise in the paediatric influenza treatment market analysis during the forecast period.
Expanding indications of flu between the age group of 1 to 9 years, coupled with a rise in the usage of antiviral drugs, have significantly contributed to enlarging the paediatric influenza treatment market growth.
The three influenza antiviral medicines approved by the U.S. (FDA) prescribed which are used during the flu season are oral oseltamivir (accessible as a generic drug or under the exchange name Tamiflu), zanamivir (Relenza - trade name), and intravenous peramivir (trade name Rapivab). There is raising awareness of the adoption of paediatric influenza treatment.
Late innovative headways in restorative antiviral drugs for treating different types of this sickness have additionally caused an expanded request worldwide, which will keep on contributing towards the development of paediatric influenza treatment market opportunities in the coming period.
However, there are factors such as a limited number of treatment options in developing economies coupled with the high very high cost of branded drugs, expensiveness, and inefficient usage of low-cost non-prescribed drugs, less availability of antiviral drugs with improper guidelines are the key factors that may restraint the paediatric influenza treatment market growth.
How Is The Performance Of The North America Paediatric Influenza Treatment Market?
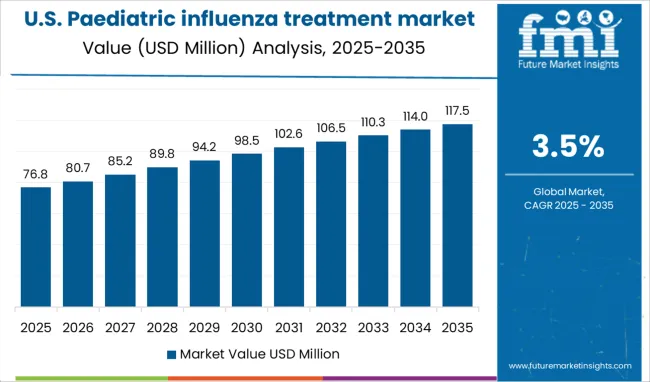
The North American region is expected to dominate the paediatric influenza treatment market share in comparison to other regions. The region acquires 34.0% of the share in the paediatric influenza treatment market size all around the region during the forecast period from 2022 to 2032.
The higher infection rate among children, higher cost of antiviral drugs and large population of patients of young age (1-9 years) suffering from paediatric influenza are leading to influence the paediatric influenza treatment market trends & forecast during the forthcoming year.
Find your sweet spots for generating winning opportunities in this market.
Talk to AnalystHow Will The Europe Paediatric Influenza Treatment Market Grow?
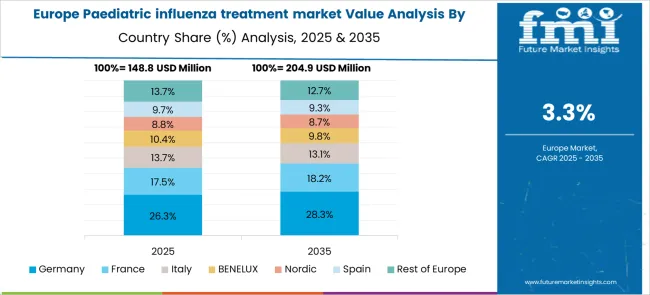
The Europe region is anticipated to grow the paediatric influenza treatment market share during the forecast period from 2022 to 2032 with a 27.3% of share in the paediatric influenza treatment market size.
High awareness levels among physicians and frequent publication of results of upcoming treatments tend to create a positive sentiment in the region, which is likely to rise the paediatric influenza treatment market demand analysis.
How Is The Start-Up Ecosystem In The Paediatric Influenza Treatment Market?
Healthy as well as chronically both may ill children due to the paediatric influenza virus itself or secondary bacterial infection are anticipated to grow the paediatric influenza treatment market growth.
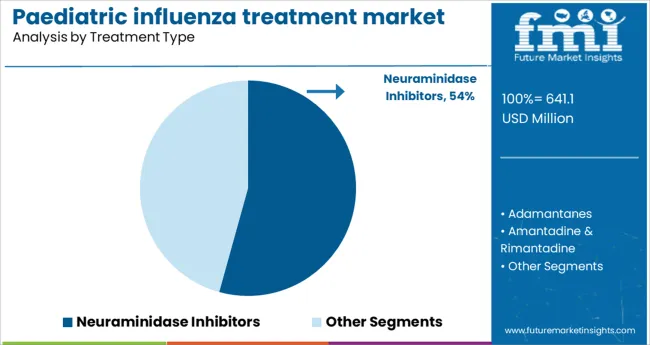
Children should be treated and tested with neuraminidase inhibitors treatments which are more effective and tolerated against the virus and are supposed to grow the paediatric influenza treatment market future trends during the forecast period from 2022 to 2032.
Seasonal paediatric influenza treatment vaccine is more effective that helps to prevent and control the virus outbreaks.
A unified Market Research Subscription Platform, built for today's disparate research needs.
Who Are Some Of The Key Competitors In The Paediatric Influenza Treatment Market?
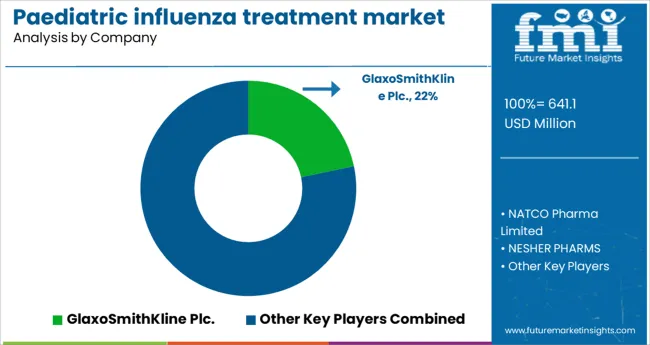
A few key players in the paediatric influenza treatment market are GlaxoSmithKline Plc., NATCO Pharma Limited., NESHER PHARMS, F. Hoffmann-La Roche Ltd, Atabay Kimya Sanayi ve Ticaret A.S., Cipla, Hetero Pharma, Teva Pharmaceutical Pvt. Ltd. and Olainfarm JSC.
The key player industries are emerging trends in paediatric influenza treatment market by adopting various market growth strategies including collaborations, mergers, partnerships, acquisitions, product launches and others.
Some of the recent developments in the paediatric influenza treatment market are as follows:
- The health department agency company FDA of the US assured public health safety from the paediatric influenza virus. A proper treatment including the security of people, vaccines, medical devices, and veterinary drugs are used to protect from the disease.
Report Scope
Report Attribute |
Details |
Growth Rate |
CAGR of 3.5% from 2022 to 2032 |
Base Year for Estimation |
2021 |
Historical Data |
2016-2021 |
Forecast Period |
2022-2032 |
Quantitative Units |
Revenue in USD Million and CAGR from 2022-2032 |
Report Coverage |
Revenue Forecast, Volume Forecast, Company Ranking, Competitive Landscape, Growth Factors, Trends and Pricing Analysis |
Segments Covered |
|
Regions Covered |
|
Key Countries Profiled |
|
Key Companies Profiled |
|
Customization |
Available Upon Request |
Frequently Asked Questions
The paediatric influenza treatment market is likely to advance at a CAGR of 3.5% through 2032.
The North American region holds the paediatric influenza treatment market share of 34.0% by 2032.
The paediatric influenza treatment market is anticipated to expect US$ 578.2 Million in 2022.
The paediatric influenza treatment market is expected to account for US$ 847.7 Million by 2032.
Table of Content
1. Executive Summary
1.1. Global Market Outlook
1.2. Demand-side Trends
1.3. Supply-side Trends
1.4. Technology Roadmap Analysis
1.5. Analysis and Recommendations
2. Market Overview
2.1. Market Coverage / Taxonomy
2.2. Market Definition / Scope / Limitations
3. Market Background
3.1. Market Dynamics
3.1.1. Drivers
3.1.2. Restraints
3.1.3. Opportunity
3.1.4. Trends
3.2. Scenario Forecast
3.2.1. Demand in Optimistic Scenario
3.2.2. Demand in Likely Scenario
3.2.3. Demand in Conservative Scenario
3.3. Opportunity Map Analysis
3.4. Investment Feasibility Matrix
3.5. PESTLE and Porter’s Analysis
3.6. Regulatory Landscape
3.6.1. By Key Regions
3.6.2. By Key Countries
3.7. Regional Parent Market Outlook
4. Global Paediatric Influenza Treatment Market Analysis 2017-2021 and Forecast, 2022-2032
4.1. Historical Market Size Value (US$ Mn) Analysis, 2017-2021
4.2. Current and Future Market Size Value (US$ Mn) Projections, 2022-2032
4.2.1. Y-o-Y Growth Trend Analysis
4.2.2. Absolute $ Opportunity Analysis
5. Global Paediatric Influenza Treatment Market Analysis 2017-2021 and Forecast 2022-2032, By Treatment Type
5.1. Introduction / Key Findings
5.2. Historical Market Size Value (US$ Mn) Analysis By Treatment Type, 2017-2021
5.3. Current and Future Market Size Value (US$ Mn) Analysis and Forecast By Treatment Type, 2022-2032
5.3.1. Adamantanes
5.3.2. Amantadine & Rimantadine
5.3.3. Neuraminidase Inhibitors
5.3.4. Oseltamivir & Zanamivir
5.4. Y-o-Y Growth Trend Analysis By Treatment Type, 2017-2021
5.5. Absolute $ Opportunity Analysis By Treatment Type, 2022-2032
6. Global Paediatric Influenza Treatment Market Analysis 2017-2021 and Forecast 2022-2032, By End User
6.1. Introduction / Key Findings
6.2. Historical Market Size Value (US$ Mn) Analysis By End User, 2017-2021
6.3. Current and Future Market Size Value (US$ Mn) Analysis and Forecast By End User, 2022-2032
6.3.1. Hospitals
6.3.2. Clinics
6.4. Y-o-Y Growth Trend Analysis By End User, 2017-2021
6.5. Absolute $ Opportunity Analysis By End User, 2022-2032
7. Global Paediatric Influenza Treatment Market Analysis 2017-2021 and Forecast 2022-2032, By Region
7.1. Introduction
7.2. Historical Market Size Value (US$ Mn) Analysis By Region, 2017-2021
7.3. Current Market Size Value (US$ Mn) Analysis and Forecast By Region, 2022-2032
7.3.1. North America
7.3.2. Latin America
7.3.3. Europe
7.3.4. Asia Pacific
7.3.5. MEA
7.4. Market Attractiveness Analysis By Region
8. North America Paediatric Influenza Treatment Market Analysis 2017-2021 and Forecast 2022-2032, By Country
8.1. Historical Market Size Value (US$ Mn) Trend Analysis By Market Taxonomy, 2017-2021
8.2. Market Size Value (US$ Mn) Forecast By Market Taxonomy, 2022-2032
8.2.1. By Country
8.2.1.1. U.S.
8.2.1.2. Canada
8.2.2. By Treatment Type
8.2.3. By End User
8.3. Market Attractiveness Analysis
8.3.1. By Country
8.3.2. By Treatment Type
8.3.3. By End User
8.4. Key Takeaways
9. Latin America Paediatric Influenza Treatment Market Analysis 2017-2021 and Forecast 2022-2032, By Country
9.1. Historical Market Size Value (US$ Mn) Trend Analysis By Market Taxonomy, 2017-2021
9.2. Market Size Value (US$ Mn) Forecast By Market Taxonomy, 2022-2032
9.2.1. By Country
9.2.1.1. Brazil
9.2.1.2. Mexico
9.2.1.3. Rest of Latin America
9.2.2. By Treatment Type
9.2.3. By End User
9.3. Market Attractiveness Analysis
9.3.1. By Country
9.3.2. By Treatment Type
9.3.3. By End User
9.4. Key Takeaways
10. Europe Paediatric Influenza Treatment Market Analysis 2017-2021 and Forecast 2022-2032, By Country
10.1. Historical Market Size Value (US$ Mn) Trend Analysis By Market Taxonomy, 2017-2021
10.2. Market Size Value (US$ Mn) Forecast By Market Taxonomy, 2022-2032
10.2.1. By Country
10.2.1.1. Germany
10.2.1.2. U.K.
10.2.1.3. France
10.2.1.4. Spain
10.2.1.5. Italy
10.2.1.6. Rest of Europe
10.2.2. By Treatment Type
10.2.3. By End User
10.3. Market Attractiveness Analysis
10.3.1. By Country
10.3.2. By Treatment Type
10.3.3. By End User
10.4. Key Takeaways
11. Asia Pacific Paediatric Influenza Treatment Market Analysis 2017-2021 and Forecast 2022-2032, By Country
11.1. Historical Market Size Value (US$ Mn) Trend Analysis By Market Taxonomy, 2017-2021
11.2. Market Size Value (US$ Mn) Forecast By Market Taxonomy, 2022-2032
11.2.1. By Country
11.2.1.1. China
11.2.1.2. Japan
11.2.1.3. South Korea
11.2.1.4. India
11.2.1.5. Malaysia
11.2.1.6. Singapore
11.2.1.7. Australia
11.2.1.8. New Zealand
11.2.1.9. Rest of APAC
11.2.2. By Treatment Type
11.2.3. By End User
11.3. Market Attractiveness Analysis
11.3.1. By Country
11.3.2. By Treatment Type
11.3.3. By End User
11.4. Key Takeaways
12. MEA Paediatric Influenza Treatment Market Analysis 2017-2021 and Forecast 2022-2032, By Country
12.1. Historical Market Size Value (US$ Mn) Trend Analysis By Market Taxonomy, 2017-2021
12.2. Market Size Value (US$ Mn) Forecast By Market Taxonomy, 2022-2032
12.2.1. By Country
12.2.1.1. GCC Countries
12.2.1.2. South Africa
12.2.1.3. Israel
12.2.1.4. Rest of MEA
12.2.2. By Treatment Type
12.2.3. By End User
12.3. Market Attractiveness Analysis
12.3.1. By Country
12.3.2. By Treatment Type
12.3.3. By End User
12.4. Key Takeaways
13. Key Countries Paediatric Influenza Treatment Market Analysis
13.1. U.S.
13.1.1. Pricing Analysis
13.1.2. Market Share Analysis, 2021
13.1.2.1. By Treatment Type
13.1.2.2. By End User
13.2. Canada
13.2.1. Pricing Analysis
13.2.2. Market Share Analysis, 2021
13.2.2.1. By Treatment Type
13.2.2.2. By End User
13.3. Brazil
13.3.1. Pricing Analysis
13.3.2. Market Share Analysis, 2021
13.3.2.1. By Treatment Type
13.3.2.2. By End User
13.4. Mexico
13.4.1. Pricing Analysis
13.4.2. Market Share Analysis, 2021
13.4.2.1. By Treatment Type
13.4.2.2. By End User
13.5. Germany
13.5.1. Pricing Analysis
13.5.2. Market Share Analysis, 2021
13.5.2.1. By Treatment Type
13.5.2.2. By End User
13.6. U.K.
13.6.1. Pricing Analysis
13.6.2. Market Share Analysis, 2021
13.6.2.1. By Treatment Type
13.6.2.2. By End User
13.7. France
13.7.1. Pricing Analysis
13.7.2. Market Share Analysis, 2021
13.7.2.1. By Treatment Type
13.7.2.2. By End User
13.8. Spain
13.8.1. Pricing Analysis
13.8.2. Market Share Analysis, 2021
13.8.2.1. By Treatment Type
13.8.2.2. By End User
13.9. Italy
13.9.1. Pricing Analysis
13.9.2. Market Share Analysis, 2021
13.9.2.1. By Treatment Type
13.9.2.2. By End User
13.10. China
13.10.1. Pricing Analysis
13.10.2. Market Share Analysis, 2021
13.10.2.1. By Treatment Type
13.10.2.2. By End User
13.11. Japan
13.11.1. Pricing Analysis
13.11.2. Market Share Analysis, 2021
13.11.2.1. By Treatment Type
13.11.2.2. By End User
13.12. South Korea
13.12.1. Pricing Analysis
13.12.2. Market Share Analysis, 2021
13.12.2.1. By Treatment Type
13.12.2.2. By End User
13.13. Malaysia
13.13.1. Pricing Analysis
13.13.2. Market Share Analysis, 2021
13.13.2.1. By Treatment Type
13.13.2.2. By End User
13.14. Singapore
13.14.1. Pricing Analysis
13.14.2. Market Share Analysis, 2021
13.14.2.1. By Treatment Type
13.14.2.2. By End User
13.15. Australia
13.15.1. Pricing Analysis
13.15.2. Market Share Analysis, 2021
13.15.2.1. By Treatment Type
13.15.2.2. By End User
13.16. New Zealand
13.16.1. Pricing Analysis
13.16.2. Market Share Analysis, 2021
13.16.2.1. By Treatment Type
13.16.2.2. By End User
13.17. GCC Countries
13.17.1. Pricing Analysis
13.17.2. Market Share Analysis, 2021
13.17.2.1. By Treatment Type
13.17.2.2. By End User
13.18. South Africa
13.18.1. Pricing Analysis
13.18.2. Market Share Analysis, 2021
13.18.2.1. By Treatment Type
13.18.2.2. By End User
13.19. Israel
13.19.1. Pricing Analysis
13.19.2. Market Share Analysis, 2021
13.19.2.1. By Treatment Type
13.19.2.2. By End User
14. Market Structure Analysis
14.1. Competition Dashboard
14.2. Competition Benchmarking
14.3. Market Share Analysis of Top Players
14.3.1. By Regional
14.3.2. By Treatment Type
14.3.3. By End User
15. Competition Analysis
15.1. Competition Deep Dive
15.1.1. GlaxoSmithKline Plc.
15.1.1.1. Overview
15.1.1.2. Product Portfolio
15.1.1.3. Profitability by Market Segments
15.1.1.4. Sales Footprint
15.1.1.5. Strategy Overview
15.1.1.5.1. Marketing Strategy
15.1.2. NATCO Pharma Limited
15.1.2.1. Overview
15.1.2.2. Product Portfolio
15.1.2.3. Profitability by Market Segments
15.1.2.4. Sales Footprint
15.1.2.5. Strategy Overview
15.1.2.5.1. Marketing Strategy
15.1.3. NESHER PHARMS
15.1.3.1. Overview
15.1.3.2. Product Portfolio
15.1.3.3. Profitability by Market Segments
15.1.3.4. Sales Footprint
15.1.3.5. Strategy Overview
15.1.3.5.1. Marketing Strategy
15.1.4. F. Hoffmann-La Roche Ltd
15.1.4.1. Overview
15.1.4.2. Product Portfolio
15.1.4.3. Profitability by Market Segments
15.1.4.4. Sales Footprint
15.1.4.5. Strategy Overview
15.1.4.5.1. Marketing Strategy
15.1.5. Atabay Kimya Sanayi ve Ticaret A.S.
15.1.5.1. Overview
15.1.5.2. Product Portfolio
15.1.5.3. Profitability by Market Segments
15.1.5.4. Sales Footprint
15.1.5.5. Strategy Overview
15.1.5.5.1. Marketing Strategy
15.1.6. Cipla
15.1.6.1. Overview
15.1.6.2. Product Portfolio
15.1.6.3. Profitability by Market Segments
15.1.6.4. Sales Footprint
15.1.6.5. Strategy Overview
15.1.6.5.1. Marketing Strategy
15.1.7. Hetero Pharma
15.1.7.1. Overview
15.1.7.2. Product Portfolio
15.1.7.3. Profitability by Market Segments
15.1.7.4. Sales Footprint
15.1.7.5. Strategy Overview
15.1.7.5.1. Marketing Strategy
15.1.8. Teva Pharmaceutical pvt. Ltd.
15.1.8.1. Overview
15.1.8.2. Product Portfolio
15.1.8.3. Profitability by Market Segments
15.1.8.4. Sales Footprint
15.1.8.5. Strategy Overview
15.1.8.5.1. Marketing Strategy
15.1.9. Olainfarm JSC
15.1.9.1. Overview
15.1.9.2. Product Portfolio
15.1.9.3. Profitability by Market Segments
15.1.9.4. Sales Footprint
15.1.9.5. Strategy Overview
15.1.9.5.1. Marketing Strategy
15.1.10. Gilead Sciences, Inc.
15.1.10.1. Overview
15.1.10.2. Product Portfolio
15.1.10.3. Profitability by Market Segments
15.1.10.4. Sales Footprint
15.1.10.5. Strategy Overview
15.1.10.5.1. Marketing Strategy
16. Assumptions & Acronyms Used
17. Research Methodology
Let us know your requirement to get
100% FREE customization
List of Tables
Table 01: Global Paediatric Influenza Treatment Market Value (US$ Mn) Forecast by Region, 2017-2032
Table 02: Global Paediatric Influenza Treatment Market Value (US$ Mn) Forecast by Treatment Type, 2017-2032
Table 03: Global Paediatric Influenza Treatment Market Value (US$ Mn) Forecast by End User, 2017-2032
Table 04: North America Paediatric Influenza Treatment Market Value (US$ Mn) Forecast by Country, 2017-2032
Table 05: North America Paediatric Influenza Treatment Market Value (US$ Mn) Forecast by Treatment Type, 2017-2032
Table 06: North America Paediatric Influenza Treatment Market Value (US$ Mn) Forecast by End User, 2017-2032
Table 07: Latin America Paediatric Influenza Treatment Market Value (US$ Mn) Forecast by Country, 2017-2032
Table 08: Latin America Paediatric Influenza Treatment Market Value (US$ Mn) Forecast by Treatment Type, 2017-2032
Table 09: Latin America Paediatric Influenza Treatment Market Value (US$ Mn) Forecast by End User, 2017-2032
Table 10: Europe Paediatric Influenza Treatment Market Value (US$ Mn) Forecast by Country, 2017-2032
Table 11: Europe Paediatric Influenza Treatment Market Value (US$ Mn) Forecast by Treatment Type, 2017-2032
Table 12: Europe Paediatric Influenza Treatment Market Value (US$ Mn) Forecast by End User, 2017-2032
Table 13: Asia Pacific Paediatric Influenza Treatment Market Value (US$ Mn) Forecast by Country, 2017-2032
Table 14: Asia Pacific Paediatric Influenza Treatment Market Value (US$ Mn) Forecast by Treatment Type, 2017-2032
Table 15: Asia Pacific Paediatric Influenza Treatment Market Value (US$ Mn) Forecast by End User, 2017-2032
Table 16: MEA Paediatric Influenza Treatment Market Value (US$ Mn) Forecast by Country, 2017-2032
Table 17: MEA Paediatric Influenza Treatment Market Value (US$ Mn) Forecast by Treatment Type, 2017-2032
Table 18: MEA Paediatric Influenza Treatment Market Value (US$ Mn) Forecast by End User, 2017-2032
Find your sweet spots for generating winning opportunities in this market.
Talk to AnalystList of Charts
Figure 01: Global Paediatric Influenza Treatment Market Value (US$ Mn) by Treatment Type, 2022-2032
Figure 02: Global Paediatric Influenza Treatment Market Value (US$ Mn) by End User, 2022-2032
Figure 03: Global Paediatric Influenza Treatment Market Value (US$ Mn) by Region, 2022-2032
Figure 04: Global Paediatric Influenza Treatment Market Value (US$ Mn) Analysis by Region, 2017-2032
Figure 05: Global Paediatric Influenza Treatment Market Value Share (%) and BPS Analysis by Region, 2022-2032
Figure 06: Global Paediatric Influenza Treatment Market Y-o-Y Growth (%) Projections by Region, 2022-2032
Figure 07: Global Paediatric Influenza Treatment Market Value (US$ Mn) Analysis by Treatment Type, 2017-2032
Figure 08: Global Paediatric Influenza Treatment Market Value Share (%) and BPS Analysis by Treatment Type, 2022-2032
Figure 09: Global Paediatric Influenza Treatment Market Y-o-Y Growth (%) Projections by Treatment Type, 2022-2032
Figure 10: Global Paediatric Influenza Treatment Market Value (US$ Mn) Analysis by End User, 2017-2032
Figure 11: Global Paediatric Influenza Treatment Market Value Share (%) and BPS Analysis by End User, 2022-2032
Figure 12: Global Paediatric Influenza Treatment Market Y-o-Y Growth (%) Projections by End User, 2022-2032
Figure 13: Global Paediatric Influenza Treatment Market Attractiveness by Treatment Type, 2022-2032
Figure 14: Global Paediatric Influenza Treatment Market Attractiveness by End User, 2022-2032
Figure 15: Global Paediatric Influenza Treatment Market Attractiveness by Region, 2022-2032
Figure 16: North America Paediatric Influenza Treatment Market Value (US$ Mn) by Treatment Type, 2022-2032
Figure 17: North America Paediatric Influenza Treatment Market Value (US$ Mn) by End User, 2022-2032
Figure 18: North America Paediatric Influenza Treatment Market Value (US$ Mn) by Country, 2022-2032
Figure 19: North America Paediatric Influenza Treatment Market Value (US$ Mn) Analysis by Country, 2017-2032
Figure 20: North America Paediatric Influenza Treatment Market Value Share (%) and BPS Analysis by Country, 2022-2032
Figure 21: North America Paediatric Influenza Treatment Market Y-o-Y Growth (%) Projections by Country, 2022-2032
Figure 22: North America Paediatric Influenza Treatment Market Value (US$ Mn) Analysis by Treatment Type, 2017-2032
Figure 23: North America Paediatric Influenza Treatment Market Value Share (%) and BPS Analysis by Treatment Type, 2022-2032
Figure 24: North America Paediatric Influenza Treatment Market Y-o-Y Growth (%) Projections by Treatment Type, 2022-2032
Figure 25: North America Paediatric Influenza Treatment Market Value (US$ Mn) Analysis by End User, 2017-2032
Figure 26: North America Paediatric Influenza Treatment Market Value Share (%) and BPS Analysis by End User, 2022-2032
Figure 27: North America Paediatric Influenza Treatment Market Y-o-Y Growth (%) Projections by End User, 2022-2032
Figure 28: North America Paediatric Influenza Treatment Market Attractiveness by Treatment Type, 2022-2032
Figure 29: North America Paediatric Influenza Treatment Market Attractiveness by End User, 2022-2032
Figure 30: North America Paediatric Influenza Treatment Market Attractiveness by Country, 2022-2032
Figure 31: Latin America Paediatric Influenza Treatment Market Value (US$ Mn) by Treatment Type, 2022-2032
Figure 32: Latin America Paediatric Influenza Treatment Market Value (US$ Mn) by End User, 2022-2032
Figure 33: Latin America Paediatric Influenza Treatment Market Value (US$ Mn) by Country, 2022-2032
Figure 34: Latin America Paediatric Influenza Treatment Market Value (US$ Mn) Analysis by Country, 2017-2032
Figure 35: Latin America Paediatric Influenza Treatment Market Value Share (%) and BPS Analysis by Country, 2022-2032
Figure 36: Latin America Paediatric Influenza Treatment Market Y-o-Y Growth (%) Projections by Country, 2022-2032
Figure 37: Latin America Paediatric Influenza Treatment Market Value (US$ Mn) Analysis by Treatment Type, 2017-2032
Figure 38: Latin America Paediatric Influenza Treatment Market Value Share (%) and BPS Analysis by Treatment Type, 2022-2032
Figure 39: Latin America Paediatric Influenza Treatment Market Y-o-Y Growth (%) Projections by Treatment Type, 2022-2032
Figure 40: Latin America Paediatric Influenza Treatment Market Value (US$ Mn) Analysis by End User, 2017-2032
Figure 41: Latin America Paediatric Influenza Treatment Market Value Share (%) and BPS Analysis by End User, 2022-2032
Figure 42: Latin America Paediatric Influenza Treatment Market Y-o-Y Growth (%) Projections by End User, 2022-2032
Figure 43: Latin America Paediatric Influenza Treatment Market Attractiveness by Treatment Type, 2022-2032
Figure 44: Latin America Paediatric Influenza Treatment Market Attractiveness by End User, 2022-2032
Figure 45: Latin America Paediatric Influenza Treatment Market Attractiveness by Country, 2022-2032
Figure 46: Europe Paediatric Influenza Treatment Market Value (US$ Mn) by Treatment Type, 2022-2032
Figure 47: Europe Paediatric Influenza Treatment Market Value (US$ Mn) by End User, 2022-2032
Figure 48: Europe Paediatric Influenza Treatment Market Value (US$ Mn) by Country, 2022-2032
Figure 49: Europe Paediatric Influenza Treatment Market Value (US$ Mn) Analysis by Country, 2017-2032
Figure 50: Europe Paediatric Influenza Treatment Market Value Share (%) and BPS Analysis by Country, 2022-2032
Figure 51: Europe Paediatric Influenza Treatment Market Y-o-Y Growth (%) Projections by Country, 2022-2032
Figure 52: Europe Paediatric Influenza Treatment Market Value (US$ Mn) Analysis by Treatment Type, 2017-2032
Figure 53: Europe Paediatric Influenza Treatment Market Value Share (%) and BPS Analysis by Treatment Type, 2022-2032
Figure 54: Europe Paediatric Influenza Treatment Market Y-o-Y Growth (%) Projections by Treatment Type, 2022-2032
Figure 55: Europe Paediatric Influenza Treatment Market Value (US$ Mn) Analysis by End User, 2017-2032
Figure 56: Europe Paediatric Influenza Treatment Market Value Share (%) and BPS Analysis by End User, 2022-2032
Figure 57: Europe Paediatric Influenza Treatment Market Y-o-Y Growth (%) Projections by End User, 2022-2032
Figure 58: Europe Paediatric Influenza Treatment Market Attractiveness by Treatment Type, 2022-2032
Figure 59: Europe Paediatric Influenza Treatment Market Attractiveness by End User, 2022-2032
Figure 60: Europe Paediatric Influenza Treatment Market Attractiveness by Country, 2022-2032
Figure 61: Asia Pacific Paediatric Influenza Treatment Market Value (US$ Mn) by Treatment Type, 2022-2032
Figure 62: Asia Pacific Paediatric Influenza Treatment Market Value (US$ Mn) by End User, 2022-2032
Figure 63: Asia Pacific Paediatric Influenza Treatment Market Value (US$ Mn) by Country, 2022-2032
Figure 64: Asia Pacific Paediatric Influenza Treatment Market Value (US$ Mn) Analysis by Country, 2017-2032
Figure 65: Asia Pacific Paediatric Influenza Treatment Market Value Share (%) and BPS Analysis by Country, 2022-2032
Figure 66: Asia Pacific Paediatric Influenza Treatment Market Y-o-Y Growth (%) Projections by Country, 2022-2032
Figure 67: Asia Pacific Paediatric Influenza Treatment Market Value (US$ Mn) Analysis by Treatment Type, 2017-2032
Figure 68: Asia Pacific Paediatric Influenza Treatment Market Value Share (%) and BPS Analysis by Treatment Type, 2022-2032
Figure 69: Asia Pacific Paediatric Influenza Treatment Market Y-o-Y Growth (%) Projections by Treatment Type, 2022-2032
Figure 70: Asia Pacific Paediatric Influenza Treatment Market Value (US$ Mn) Analysis by End User, 2017-2032
Figure 71: Asia Pacific Paediatric Influenza Treatment Market Value Share (%) and BPS Analysis by End User, 2022-2032
Figure 72: Asia Pacific Paediatric Influenza Treatment Market Y-o-Y Growth (%) Projections by End User, 2022-2032
Figure 73: Asia Pacific Paediatric Influenza Treatment Market Attractiveness by Treatment Type, 2022-2032
Figure 74: Asia Pacific Paediatric Influenza Treatment Market Attractiveness by End User, 2022-2032
Figure 75: Asia Pacific Paediatric Influenza Treatment Market Attractiveness by Country, 2022-2032
Figure 76: MEA Paediatric Influenza Treatment Market Value (US$ Mn) by Treatment Type, 2022-2032
Figure 77: MEA Paediatric Influenza Treatment Market Value (US$ Mn) by End User, 2022-2032
Figure 78: MEA Paediatric Influenza Treatment Market Value (US$ Mn) by Country, 2022-2032
Figure 79: MEA Paediatric Influenza Treatment Market Value (US$ Mn) Analysis by Country, 2017-2032
Figure 80: MEA Paediatric Influenza Treatment Market Value Share (%) and BPS Analysis by Country, 2022-2032
Figure 81: MEA Paediatric Influenza Treatment Market Y-o-Y Growth (%) Projections by Country, 2022-2032
Figure 82: MEA Paediatric Influenza Treatment Market Value (US$ Mn) Analysis by Treatment Type, 2017-2032
Figure 83: MEA Paediatric Influenza Treatment Market Value Share (%) and BPS Analysis by Treatment Type, 2022-2032
Figure 84: MEA Paediatric Influenza Treatment Market Y-o-Y Growth (%) Projections by Treatment Type, 2022-2032
Figure 85: MEA Paediatric Influenza Treatment Market Value (US$ Mn) Analysis by End User, 2017-2032
Figure 86: MEA Paediatric Influenza Treatment Market Value Share (%) and BPS Analysis by End User, 2022-2032
Figure 87: MEA Paediatric Influenza Treatment Market Y-o-Y Growth (%) Projections by End User, 2022-2032
Figure 88: MEA Paediatric Influenza Treatment Market Attractiveness by Treatment Type, 2022-2032
Figure 89: MEA Paediatric Influenza Treatment Market Attractiveness by End User, 2022-2032
Figure 90: MEA Paediatric Influenza Treatment Market Attractiveness by Country, 2022-2032
Need specific information?
Request CustomizationExplore Healthcare Insights
View Reports