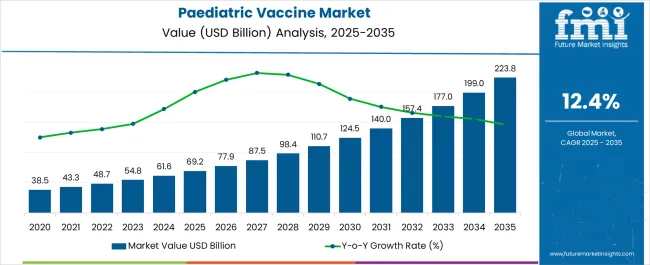
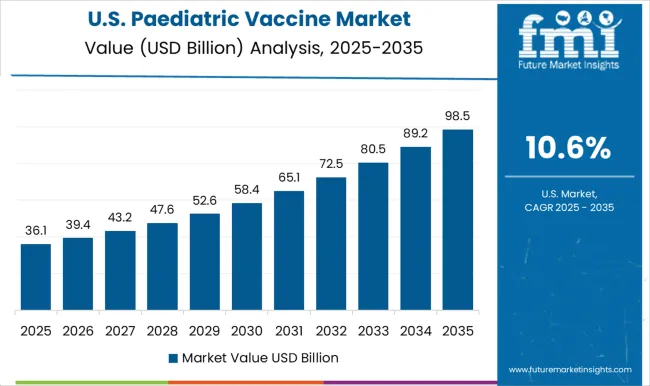
The paediatric vaccine market valuation is USD 54,130.1 million in 2023. The market is predicted to grow at a remarkable CAGR of 13.1% to reach a valuation of USD 184,706.7 million by 2033. Thus, it showcases that the paediatric vaccine market is due for significant growth over the coming years.
Production and Distribution Analysis in the Paediatric Vaccine Market
Attributes | Details |
---|---|
Paediatric Vaccine Market Value for 2023 | USD 54,130.1 million |
Projected Market Value for 2033 | USD 184,706.7 million |
Value-based CAGR for 2023 to 2033 | 13.1% |
The paediatric vaccine market grew at a rate of 9.7% during the historical period from 2017 to 2022. Increasing awareness about vaccines, the development of vaccines for children, the rising rate of approval for vaccines, and other factors are all suggested to contribute to the market's rapid growth.
Diseases that attack weakened immune systems, such as Rubella, Hepatitis A, and Hepatitis B, continue to pose threats to children. The demand for paediatric vaccines will continue unabated over the forecast period due to the prevalence of these diseases.
Historical CAGR | 9.7% |
---|---|
Forecast CAGR | 13.1% |
The arrival of the pandemic resulted in a growing demand for paediatric vaccines, which greatly boosted the market. The paediatric vaccine market expanded to USD 48,816.7 million in 2022.
The pandemic also had a negative impact on the paediatric market. While the Covid-19 vaccine helped the market, other paediatric vaccines experienced lower demand. The Covid-19 vaccines were also not suitable for children in the initial stages, losing out on a huge section of the market. However, the pandemic reinforced the need for proper preventative care in the minds of the people.
The paediatric vaccine market is expected to grow at a robust rate of 13.1% CAGR over the forecast period. By 2033, the market is predicted to reach USD 184,706.7 million.
Innovations with the help of technology are predicted to drive the market for paediatric vaccines. Gene vaccines are developed with the help of new technology, infusing DNA and RNA to combat diseases. Gene vaccines have found acceptance during the historical period, and their growth is expected to continue over the forecast period.
The rollout of vaccines for COVID-19 during the historical period initially excluded children from the list of beneficiaries. However, vaccines are being tested and approved for use on children, and thus the paediatric market is able to target a big section of the population.
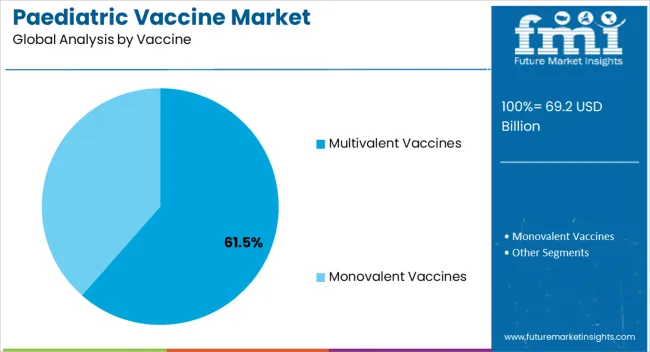
While monovalent vaccines continue to enjoy a major share of the market, there has been a growing demand for bivalent or combination vaccines. Combination vaccines combine the effects of two vaccines in one go and are thus recognized to save people’s time. As the number of vaccines grows, combination vaccines are also expected to increase in popularity due to their multi-effectiveness.
The paediatric vaccine market can be divided into the following segments: indication, technology, vaccine type, and end users. Shedding light on these segments is useful in determining the nature of the products and users of the vaccines. These insights also shed light on the preferences of users and manufacturers in the paediatric vaccine market.
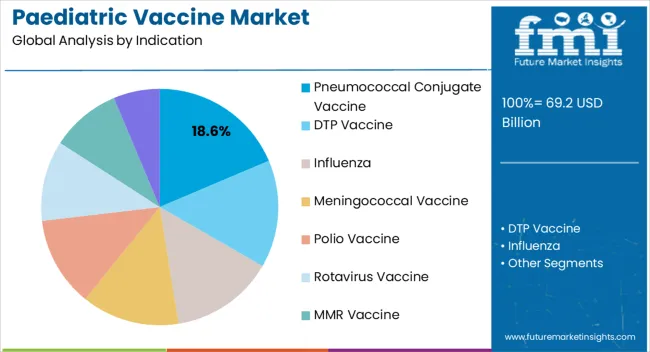
The pneumococcal vaccine is the most represented of the vaccines by indication. It enjoyed a 32.5% share in the global market in 2022, up from 31.9% in 2021.
The pneumococcal vaccine is recommended to be given to children by no less an authority than the World Health Organization (WHO). The use of pneumococcal vaccine can help prevent cases of pneumonia, meningitis, and sepsis. Thus, the pneumococcal vaccine is in high demand.
The pneumococcal vaccine is expected to grow rapidly over the forecast period. As efforts are being expanded toward shielding children from harmful diseases, the value and demand of pneumococcal vaccines are experiencing an upward trajectory.
Attributes | Details |
---|---|
Top Indication | Pneumococcal Vaccine |
Market Share in 2022 | 32.5% |
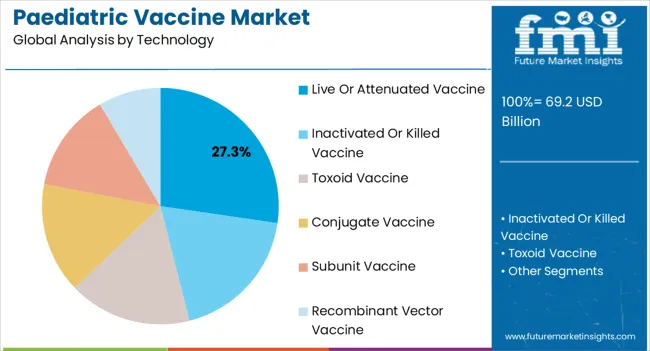
Conjugate vaccines make up the highest market share in terms of technology in the paediatric vaccines market. In 2022, they made up 32.8 % of the market share, up from 32% in 2021.
Paediatric vaccine producers rely on conjugate vaccines. They have a track record of being effective, like the Hib conjugate vaccine, which has fought meningitis convincingly. Another example is the typhoid conjugate vaccine, which has proven to reduce the risk of typhoid fever and is WHO-recommended. Conjugate vaccines are thus expected to grow rapidly over the forecast period.
Attributes | Details |
---|---|
Top Technology | Conjugate Vaccines |
Market Share in 2022 | 32.8% |
Monovalent vaccines are more popular than multivalent vaccines. They held a share of 73.6 % of the market in 2022.
Monovalent vaccines have historically been the most produced of all vaccines. Their growth is expected to continue over the forecast period. Monovalent vaccine shielding against mumps, rubella, and COVID-19 is predicted to be higher in demand over the projected period. However, multivalent vaccines are also rising. Quadrivalent vaccines are used against the threat of influenza, while new bivalent vaccines have been approved to combat COVID-19.
Attributes | Details |
---|---|
Top Type | Monovalent Vaccine |
Market Share in 2022 | 73.6% |
Institutional health centres are the most common end-use sector for paediatric vaccines. They enjoyed a significant share of the market in 2022, taking up 72.9% of the share, up from 72.3% in 2021.
Institutional health centres have qualified staff for the administration of paediatric vaccines and are trusted institutions. They also have the support of the government.
Attributes | Details |
---|---|
Top End-use Sector | Institutional health centers |
Market Share in 2022 | 72.9% |
In the paediatric vaccine market, North America and Europe continue to lead the market share. In 2022, North America held 24.3% of the market share, while Europe held sway over 26.1%.
The USA is the leading market in North America. It is poised to continue its positive upward trajectory over the forecast period. In Europe, meanwhile, the United Kingdom market is expected to grow at a rapid rate.
Some of the highest growth rates are predicted for the Asia-Pacific. The Chinese and Indian paediatric vaccine markets are expected to boom during the forecast period. The high population in these countries is a significant factor contributing to the rising demand for vaccines.
Countries | Market Share in 2022 |
---|---|
United States | 17.9% |
China | 19.6% |
India | 19.2% |
United Kingdom | 16.1% |
Australia | 9.4% |
The United States continues to hold the largest market share in the North American market. In the overall paediatric vaccines market, the United States held a market share of 17.9% in 2022.
Healthcare facilities have improved drastically, thus providing better avenues for the distribution of paediatric vaccines. There has also been a growing consciousness among the people of the importance of vaccinations. People are aware of the risks posed to children due to various diseases and are thus willing to resort to vaccines to ward them off. There has also been an increased investment in research and development, which is aiding the cause of paediatric vaccines in the United States.
China experienced the effects of Covid-19 severely. Thus, there is a high volume of paediatric patients. In these circumstances, there is a growing demand for paediatric vaccines. In addition to Covid-19, threats of meningitis, diphtheria, pertussis, and tetanus are also present. This is leading to the rising demand for vaccines like the meningococcal vaccine and the DTaP vaccine.
China’s paediatric vaccine market is expected to soar during the forecast period. It held a 19.6% share of the global market in 2022.
There is also a high volume of paediatric patients in India. As the population is booming, the number of people at risk of diseases is also increasing. Thus, the paediatric vaccine market is being propelled by the rising number of childbirths in India.
The Indian market held a share of 19.2% of the global market in 2022. Leading campaigns by the government are helping the paediatric vaccine market in India. There is a raised acknowledgment of the need for paediatric vaccines, and the market is expected to grow at a substantial rate over the forecast period.
The United Kingdom market is another market where campaigns have played a key role. Initiatives have been taken to increase immunization among the people. The government has launched programs to increase the number of vaccinated children.
The United Kingdom paediatric vaccine market held a share of 16.1% of the global market in 2022. The steps taken by the health authorities in the United Kingdom will drive the market growth during the projected period.
In the Australian market, paediatric vaccines are in demand as there is fear over the outbreak of diseases. Steps have been taken to make the paediatric population more immunized through vaccines.
The Australian paediatric vaccine market held a share of 9.4% of the global market in 2022. Some of the diseases the Australian people want paediatric vaccines for are COVID-19, Tetanus, and Hepatitis B.
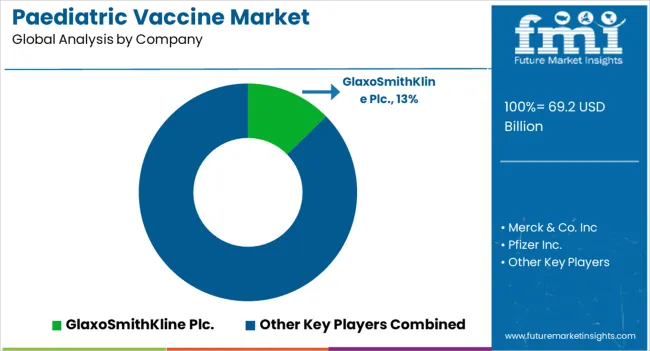
The paediatric vaccine suppliers are increasingly leveraging the benefits of collaborations. Partnerships with healthcare institutions, mergers with other manufacturers in the market, acquisitions, and collaborative strategies are some of the strategies adopted by paediatric vaccine suppliers.
The paediatric vaccines market does not feature manufacturers that are highly dominant. Instead, the market is fragmented, with several key players enjoying their share of the pie. The producers of paediatric vaccines are also receiving increasing approvals from health regulators to distribute their vaccines.
Recent Developments in the Paediatric Vaccine Market
Key Companies in the Paediatric Vaccine Market
Table 1: Global Market Value (US$ Million) Forecast by Region, 2018 to 2033
Table 2: Global Market Volume (Units) Forecast by Region, 2018 to 2033
Table 3: Global Market Value (US$ Million) Forecast by Indication, 2018 to 2033
Table 4: Global Market Volume (Units) Forecast by Indication, 2018 to 2033
Table 5: Global Market Value (US$ Million) Forecast by Technology, 2018 to 2033
Table 6: Global Market Volume (Units) Forecast by Technology, 2018 to 2033
Table 7: Global Market Value (US$ Million) Forecast by Vaccine, 2018 to 2033
Table 8: Global Market Volume (Units) Forecast by Vaccine, 2018 to 2033
Table 9: Global Market Value (US$ Million) Forecast by End User, 2018 to 2033
Table 10: Global Market Volume (Units) Forecast by End User, 2018 to 2033
Table 11: North America Market Value (US$ Million) Forecast by Country, 2018 to 2033
Table 12: North America Market Volume (Units) Forecast by Country, 2018 to 2033
Table 13: North America Market Value (US$ Million) Forecast by Indication, 2018 to 2033
Table 14: North America Market Volume (Units) Forecast by Indication, 2018 to 2033
Table 15: North America Market Value (US$ Million) Forecast by Technology, 2018 to 2033
Table 16: North America Market Volume (Units) Forecast by Technology, 2018 to 2033
Table 17: North America Market Value (US$ Million) Forecast by Vaccine, 2018 to 2033
Table 18: North America Market Volume (Units) Forecast by Vaccine, 2018 to 2033
Table 19: North America Market Value (US$ Million) Forecast by End User, 2018 to 2033
Table 20: North America Market Volume (Units) Forecast by End User, 2018 to 2033
Table 21: Latin America Market Value (US$ Million) Forecast by Country, 2018 to 2033
Table 22: Latin America Market Volume (Units) Forecast by Country, 2018 to 2033
Table 23: Latin America Market Value (US$ Million) Forecast by Indication, 2018 to 2033
Table 24: Latin America Market Volume (Units) Forecast by Indication, 2018 to 2033
Table 25: Latin America Market Value (US$ Million) Forecast by Technology, 2018 to 2033
Table 26: Latin America Market Volume (Units) Forecast by Technology, 2018 to 2033
Table 27: Latin America Market Value (US$ Million) Forecast by Vaccine, 2018 to 2033
Table 28: Latin America Market Volume (Units) Forecast by Vaccine, 2018 to 2033
Table 29: Latin America Market Value (US$ Million) Forecast by End User, 2018 to 2033
Table 30: Latin America Market Volume (Units) Forecast by End User, 2018 to 2033
Table 31: Western Europe Market Value (US$ Million) Forecast by Country, 2018 to 2033
Table 32: Western Europe Market Volume (Units) Forecast by Country, 2018 to 2033
Table 33: Western Europe Market Value (US$ Million) Forecast by Indication, 2018 to 2033
Table 34: Western Europe Market Volume (Units) Forecast by Indication, 2018 to 2033
Table 35: Western Europe Market Value (US$ Million) Forecast by Technology, 2018 to 2033
Table 36: Western Europe Market Volume (Units) Forecast by Technology, 2018 to 2033
Table 37: Western Europe Market Value (US$ Million) Forecast by Vaccine, 2018 to 2033
Table 38: Western Europe Market Volume (Units) Forecast by Vaccine, 2018 to 2033
Table 39: Western Europe Market Value (US$ Million) Forecast by End User, 2018 to 2033
Table 40: Western Europe Market Volume (Units) Forecast by End User, 2018 to 2033
Table 41: Eastern Europe Market Value (US$ Million) Forecast by Country, 2018 to 2033
Table 42: Eastern Europe Market Volume (Units) Forecast by Country, 2018 to 2033
Table 43: Eastern Europe Market Value (US$ Million) Forecast by Indication, 2018 to 2033
Table 44: Eastern Europe Market Volume (Units) Forecast by Indication, 2018 to 2033
Table 45: Eastern Europe Market Value (US$ Million) Forecast by Technology, 2018 to 2033
Table 46: Eastern Europe Market Volume (Units) Forecast by Technology, 2018 to 2033
Table 47: Eastern Europe Market Value (US$ Million) Forecast by Vaccine, 2018 to 2033
Table 48: Eastern Europe Market Volume (Units) Forecast by Vaccine, 2018 to 2033
Table 49: Eastern Europe Market Value (US$ Million) Forecast by End User, 2018 to 2033
Table 50: Eastern Europe Market Volume (Units) Forecast by End User, 2018 to 2033
Table 51: South Asia and Pacific Market Value (US$ Million) Forecast by Country, 2018 to 2033
Table 52: South Asia and Pacific Market Volume (Units) Forecast by Country, 2018 to 2033
Table 53: South Asia and Pacific Market Value (US$ Million) Forecast by Indication, 2018 to 2033
Table 54: South Asia and Pacific Market Volume (Units) Forecast by Indication, 2018 to 2033
Table 55: South Asia and Pacific Market Value (US$ Million) Forecast by Technology, 2018 to 2033
Table 56: South Asia and Pacific Market Volume (Units) Forecast by Technology, 2018 to 2033
Table 57: South Asia and Pacific Market Value (US$ Million) Forecast by Vaccine, 2018 to 2033
Table 58: South Asia and Pacific Market Volume (Units) Forecast by Vaccine, 2018 to 2033
Table 59: South Asia and Pacific Market Value (US$ Million) Forecast by End User, 2018 to 2033
Table 60: South Asia and Pacific Market Volume (Units) Forecast by End User, 2018 to 2033
Table 61: East Asia Market Value (US$ Million) Forecast by Country, 2018 to 2033
Table 62: East Asia Market Volume (Units) Forecast by Country, 2018 to 2033
Table 63: East Asia Market Value (US$ Million) Forecast by Indication, 2018 to 2033
Table 64: East Asia Market Volume (Units) Forecast by Indication, 2018 to 2033
Table 65: East Asia Market Value (US$ Million) Forecast by Technology, 2018 to 2033
Table 66: East Asia Market Volume (Units) Forecast by Technology, 2018 to 2033
Table 67: East Asia Market Value (US$ Million) Forecast by Vaccine, 2018 to 2033
Table 68: East Asia Market Volume (Units) Forecast by Vaccine, 2018 to 2033
Table 69: East Asia Market Value (US$ Million) Forecast by End User, 2018 to 2033
Table 70: East Asia Market Volume (Units) Forecast by End User, 2018 to 2033
Table 71: Middle East and Africa Market Value (US$ Million) Forecast by Country, 2018 to 2033
Table 72: Middle East and Africa Market Volume (Units) Forecast by Country, 2018 to 2033
Table 73: Middle East and Africa Market Value (US$ Million) Forecast by Indication, 2018 to 2033
Table 74: Middle East and Africa Market Volume (Units) Forecast by Indication, 2018 to 2033
Table 75: Middle East and Africa Market Value (US$ Million) Forecast by Technology, 2018 to 2033
Table 76: Middle East and Africa Market Volume (Units) Forecast by Technology, 2018 to 2033
Table 77: Middle East and Africa Market Value (US$ Million) Forecast by Vaccine, 2018 to 2033
Table 78: Middle East and Africa Market Volume (Units) Forecast by Vaccine, 2018 to 2033
Table 79: Middle East and Africa Market Value (US$ Million) Forecast by End User, 2018 to 2033
Table 80: Middle East and Africa Market Volume (Units) Forecast by End User, 2018 to 2033
Figure 1: Global Market Value (US$ Million) by Indication, 2023 to 2033
Figure 2: Global Market Value (US$ Million) by Technology, 2023 to 2033
Figure 3: Global Market Value (US$ Million) by Vaccine, 2023 to 2033
Figure 4: Global Market Value (US$ Million) by End User, 2023 to 2033
Figure 5: Global Market Value (US$ Million) by Region, 2023 to 2033
Figure 6: Global Market Value (US$ Million) Analysis by Region, 2018 to 2033
Figure 7: Global Market Volume (Units) Analysis by Region, 2018 to 2033
Figure 8: Global Market Value Share (%) and BPS Analysis by Region, 2023 to 2033
Figure 9: Global Market Y-o-Y Growth (%) Projections by Region, 2023 to 2033
Figure 10: Global Market Value (US$ Million) Analysis by Indication, 2018 to 2033
Figure 11: Global Market Volume (Units) Analysis by Indication, 2018 to 2033
Figure 12: Global Market Value Share (%) and BPS Analysis by Indication, 2023 to 2033
Figure 13: Global Market Y-o-Y Growth (%) Projections by Indication, 2023 to 2033
Figure 14: Global Market Value (US$ Million) Analysis by Technology, 2018 to 2033
Figure 15: Global Market Volume (Units) Analysis by Technology, 2018 to 2033
Figure 16: Global Market Value Share (%) and BPS Analysis by Technology, 2023 to 2033
Figure 17: Global Market Y-o-Y Growth (%) Projections by Technology, 2023 to 2033
Figure 18: Global Market Value (US$ Million) Analysis by Vaccine, 2018 to 2033
Figure 19: Global Market Volume (Units) Analysis by Vaccine, 2018 to 2033
Figure 20: Global Market Value Share (%) and BPS Analysis by Vaccine, 2023 to 2033
Figure 21: Global Market Y-o-Y Growth (%) Projections by Vaccine, 2023 to 2033
Figure 22: Global Market Value (US$ Million) Analysis by End User, 2018 to 2033
Figure 23: Global Market Volume (Units) Analysis by End User, 2018 to 2033
Figure 24: Global Market Value Share (%) and BPS Analysis by End User, 2023 to 2033
Figure 25: Global Market Y-o-Y Growth (%) Projections by End User, 2023 to 2033
Figure 26: Global Market Attractiveness by Indication, 2023 to 2033
Figure 27: Global Market Attractiveness by Technology, 2023 to 2033
Figure 28: Global Market Attractiveness by Vaccine, 2023 to 2033
Figure 29: Global Market Attractiveness by End User, 2023 to 2033
Figure 30: Global Market Attractiveness by Region, 2023 to 2033
Figure 31: North America Market Value (US$ Million) by Indication, 2023 to 2033
Figure 32: North America Market Value (US$ Million) by Technology, 2023 to 2033
Figure 33: North America Market Value (US$ Million) by Vaccine, 2023 to 2033
Figure 34: North America Market Value (US$ Million) by End User, 2023 to 2033
Figure 35: North America Market Value (US$ Million) by Country, 2023 to 2033
Figure 36: North America Market Value (US$ Million) Analysis by Country, 2018 to 2033
Figure 37: North America Market Volume (Units) Analysis by Country, 2018 to 2033
Figure 38: North America Market Value Share (%) and BPS Analysis by Country, 2023 to 2033
Figure 39: North America Market Y-o-Y Growth (%) Projections by Country, 2023 to 2033
Figure 40: North America Market Value (US$ Million) Analysis by Indication, 2018 to 2033
Figure 41: North America Market Volume (Units) Analysis by Indication, 2018 to 2033
Figure 42: North America Market Value Share (%) and BPS Analysis by Indication, 2023 to 2033
Figure 43: North America Market Y-o-Y Growth (%) Projections by Indication, 2023 to 2033
Figure 44: North America Market Value (US$ Million) Analysis by Technology, 2018 to 2033
Figure 45: North America Market Volume (Units) Analysis by Technology, 2018 to 2033
Figure 46: North America Market Value Share (%) and BPS Analysis by Technology, 2023 to 2033
Figure 47: North America Market Y-o-Y Growth (%) Projections by Technology, 2023 to 2033
Figure 48: North America Market Value (US$ Million) Analysis by Vaccine, 2018 to 2033
Figure 49: North America Market Volume (Units) Analysis by Vaccine, 2018 to 2033
Figure 50: North America Market Value Share (%) and BPS Analysis by Vaccine, 2023 to 2033
Figure 51: North America Market Y-o-Y Growth (%) Projections by Vaccine, 2023 to 2033
Figure 52: North America Market Value (US$ Million) Analysis by End User, 2018 to 2033
Figure 53: North America Market Volume (Units) Analysis by End User, 2018 to 2033
Figure 54: North America Market Value Share (%) and BPS Analysis by End User, 2023 to 2033
Figure 55: North America Market Y-o-Y Growth (%) Projections by End User, 2023 to 2033
Figure 56: North America Market Attractiveness by Indication, 2023 to 2033
Figure 57: North America Market Attractiveness by Technology, 2023 to 2033
Figure 58: North America Market Attractiveness by Vaccine, 2023 to 2033
Figure 59: North America Market Attractiveness by End User, 2023 to 2033
Figure 60: North America Market Attractiveness by Country, 2023 to 2033
Figure 61: Latin America Market Value (US$ Million) by Indication, 2023 to 2033
Figure 62: Latin America Market Value (US$ Million) by Technology, 2023 to 2033
Figure 63: Latin America Market Value (US$ Million) by Vaccine, 2023 to 2033
Figure 64: Latin America Market Value (US$ Million) by End User, 2023 to 2033
Figure 65: Latin America Market Value (US$ Million) by Country, 2023 to 2033
Figure 66: Latin America Market Value (US$ Million) Analysis by Country, 2018 to 2033
Figure 67: Latin America Market Volume (Units) Analysis by Country, 2018 to 2033
Figure 68: Latin America Market Value Share (%) and BPS Analysis by Country, 2023 to 2033
Figure 69: Latin America Market Y-o-Y Growth (%) Projections by Country, 2023 to 2033
Figure 70: Latin America Market Value (US$ Million) Analysis by Indication, 2018 to 2033
Figure 71: Latin America Market Volume (Units) Analysis by Indication, 2018 to 2033
Figure 72: Latin America Market Value Share (%) and BPS Analysis by Indication, 2023 to 2033
Figure 73: Latin America Market Y-o-Y Growth (%) Projections by Indication, 2023 to 2033
Figure 74: Latin America Market Value (US$ Million) Analysis by Technology, 2018 to 2033
Figure 75: Latin America Market Volume (Units) Analysis by Technology, 2018 to 2033
Figure 76: Latin America Market Value Share (%) and BPS Analysis by Technology, 2023 to 2033
Figure 77: Latin America Market Y-o-Y Growth (%) Projections by Technology, 2023 to 2033
Figure 78: Latin America Market Value (US$ Million) Analysis by Vaccine, 2018 to 2033
Figure 79: Latin America Market Volume (Units) Analysis by Vaccine, 2018 to 2033
Figure 80: Latin America Market Value Share (%) and BPS Analysis by Vaccine, 2023 to 2033
Figure 81: Latin America Market Y-o-Y Growth (%) Projections by Vaccine, 2023 to 2033
Figure 82: Latin America Market Value (US$ Million) Analysis by End User, 2018 to 2033
Figure 83: Latin America Market Volume (Units) Analysis by End User, 2018 to 2033
Figure 84: Latin America Market Value Share (%) and BPS Analysis by End User, 2023 to 2033
Figure 85: Latin America Market Y-o-Y Growth (%) Projections by End User, 2023 to 2033
Figure 86: Latin America Market Attractiveness by Indication, 2023 to 2033
Figure 87: Latin America Market Attractiveness by Technology, 2023 to 2033
Figure 88: Latin America Market Attractiveness by Vaccine, 2023 to 2033
Figure 89: Latin America Market Attractiveness by End User, 2023 to 2033
Figure 90: Latin America Market Attractiveness by Country, 2023 to 2033
Figure 91: Western Europe Market Value (US$ Million) by Indication, 2023 to 2033
Figure 92: Western Europe Market Value (US$ Million) by Technology, 2023 to 2033
Figure 93: Western Europe Market Value (US$ Million) by Vaccine, 2023 to 2033
Figure 94: Western Europe Market Value (US$ Million) by End User, 2023 to 2033
Figure 95: Western Europe Market Value (US$ Million) by Country, 2023 to 2033
Figure 96: Western Europe Market Value (US$ Million) Analysis by Country, 2018 to 2033
Figure 97: Western Europe Market Volume (Units) Analysis by Country, 2018 to 2033
Figure 98: Western Europe Market Value Share (%) and BPS Analysis by Country, 2023 to 2033
Figure 99: Western Europe Market Y-o-Y Growth (%) Projections by Country, 2023 to 2033
Figure 100: Western Europe Market Value (US$ Million) Analysis by Indication, 2018 to 2033
Figure 101: Western Europe Market Volume (Units) Analysis by Indication, 2018 to 2033
Figure 102: Western Europe Market Value Share (%) and BPS Analysis by Indication, 2023 to 2033
Figure 103: Western Europe Market Y-o-Y Growth (%) Projections by Indication, 2023 to 2033
Figure 104: Western Europe Market Value (US$ Million) Analysis by Technology, 2018 to 2033
Figure 105: Western Europe Market Volume (Units) Analysis by Technology, 2018 to 2033
Figure 106: Western Europe Market Value Share (%) and BPS Analysis by Technology, 2023 to 2033
Figure 107: Western Europe Market Y-o-Y Growth (%) Projections by Technology, 2023 to 2033
Figure 108: Western Europe Market Value (US$ Million) Analysis by Vaccine, 2018 to 2033
Figure 109: Western Europe Market Volume (Units) Analysis by Vaccine, 2018 to 2033
Figure 110: Western Europe Market Value Share (%) and BPS Analysis by Vaccine, 2023 to 2033
Figure 111: Western Europe Market Y-o-Y Growth (%) Projections by Vaccine, 2023 to 2033
Figure 112: Western Europe Market Value (US$ Million) Analysis by End User, 2018 to 2033
Figure 113: Western Europe Market Volume (Units) Analysis by End User, 2018 to 2033
Figure 114: Western Europe Market Value Share (%) and BPS Analysis by End User, 2023 to 2033
Figure 115: Western Europe Market Y-o-Y Growth (%) Projections by End User, 2023 to 2033
Figure 116: Western Europe Market Attractiveness by Indication, 2023 to 2033
Figure 117: Western Europe Market Attractiveness by Technology, 2023 to 2033
Figure 118: Western Europe Market Attractiveness by Vaccine, 2023 to 2033
Figure 119: Western Europe Market Attractiveness by End User, 2023 to 2033
Figure 120: Western Europe Market Attractiveness by Country, 2023 to 2033
Figure 121: Eastern Europe Market Value (US$ Million) by Indication, 2023 to 2033
Figure 122: Eastern Europe Market Value (US$ Million) by Technology, 2023 to 2033
Figure 123: Eastern Europe Market Value (US$ Million) by Vaccine, 2023 to 2033
Figure 124: Eastern Europe Market Value (US$ Million) by End User, 2023 to 2033
Figure 125: Eastern Europe Market Value (US$ Million) by Country, 2023 to 2033
Figure 126: Eastern Europe Market Value (US$ Million) Analysis by Country, 2018 to 2033
Figure 127: Eastern Europe Market Volume (Units) Analysis by Country, 2018 to 2033
Figure 128: Eastern Europe Market Value Share (%) and BPS Analysis by Country, 2023 to 2033
Figure 129: Eastern Europe Market Y-o-Y Growth (%) Projections by Country, 2023 to 2033
Figure 130: Eastern Europe Market Value (US$ Million) Analysis by Indication, 2018 to 2033
Figure 131: Eastern Europe Market Volume (Units) Analysis by Indication, 2018 to 2033
Figure 132: Eastern Europe Market Value Share (%) and BPS Analysis by Indication, 2023 to 2033
Figure 133: Eastern Europe Market Y-o-Y Growth (%) Projections by Indication, 2023 to 2033
Figure 134: Eastern Europe Market Value (US$ Million) Analysis by Technology, 2018 to 2033
Figure 135: Eastern Europe Market Volume (Units) Analysis by Technology, 2018 to 2033
Figure 136: Eastern Europe Market Value Share (%) and BPS Analysis by Technology, 2023 to 2033
Figure 137: Eastern Europe Market Y-o-Y Growth (%) Projections by Technology, 2023 to 2033
Figure 138: Eastern Europe Market Value (US$ Million) Analysis by Vaccine, 2018 to 2033
Figure 139: Eastern Europe Market Volume (Units) Analysis by Vaccine, 2018 to 2033
Figure 140: Eastern Europe Market Value Share (%) and BPS Analysis by Vaccine, 2023 to 2033
Figure 141: Eastern Europe Market Y-o-Y Growth (%) Projections by Vaccine, 2023 to 2033
Figure 142: Eastern Europe Market Value (US$ Million) Analysis by End User, 2018 to 2033
Figure 143: Eastern Europe Market Volume (Units) Analysis by End User, 2018 to 2033
Figure 144: Eastern Europe Market Value Share (%) and BPS Analysis by End User, 2023 to 2033
Figure 145: Eastern Europe Market Y-o-Y Growth (%) Projections by End User, 2023 to 2033
Figure 146: Eastern Europe Market Attractiveness by Indication, 2023 to 2033
Figure 147: Eastern Europe Market Attractiveness by Technology, 2023 to 2033
Figure 148: Eastern Europe Market Attractiveness by Vaccine, 2023 to 2033
Figure 149: Eastern Europe Market Attractiveness by End User, 2023 to 2033
Figure 150: Eastern Europe Market Attractiveness by Country, 2023 to 2033
Figure 151: South Asia and Pacific Market Value (US$ Million) by Indication, 2023 to 2033
Figure 152: South Asia and Pacific Market Value (US$ Million) by Technology, 2023 to 2033
Figure 153: South Asia and Pacific Market Value (US$ Million) by Vaccine, 2023 to 2033
Figure 154: South Asia and Pacific Market Value (US$ Million) by End User, 2023 to 2033
Figure 155: South Asia and Pacific Market Value (US$ Million) by Country, 2023 to 2033
Figure 156: South Asia and Pacific Market Value (US$ Million) Analysis by Country, 2018 to 2033
Figure 157: South Asia and Pacific Market Volume (Units) Analysis by Country, 2018 to 2033
Figure 158: South Asia and Pacific Market Value Share (%) and BPS Analysis by Country, 2023 to 2033
Figure 159: South Asia and Pacific Market Y-o-Y Growth (%) Projections by Country, 2023 to 2033
Figure 160: South Asia and Pacific Market Value (US$ Million) Analysis by Indication, 2018 to 2033
Figure 161: South Asia and Pacific Market Volume (Units) Analysis by Indication, 2018 to 2033
Figure 162: South Asia and Pacific Market Value Share (%) and BPS Analysis by Indication, 2023 to 2033
Figure 163: South Asia and Pacific Market Y-o-Y Growth (%) Projections by Indication, 2023 to 2033
Figure 164: South Asia and Pacific Market Value (US$ Million) Analysis by Technology, 2018 to 2033
Figure 165: South Asia and Pacific Market Volume (Units) Analysis by Technology, 2018 to 2033
Figure 166: South Asia and Pacific Market Value Share (%) and BPS Analysis by Technology, 2023 to 2033
Figure 167: South Asia and Pacific Market Y-o-Y Growth (%) Projections by Technology, 2023 to 2033
Figure 168: South Asia and Pacific Market Value (US$ Million) Analysis by Vaccine, 2018 to 2033
Figure 169: South Asia and Pacific Market Volume (Units) Analysis by Vaccine, 2018 to 2033
Figure 170: South Asia and Pacific Market Value Share (%) and BPS Analysis by Vaccine, 2023 to 2033
Figure 171: South Asia and Pacific Market Y-o-Y Growth (%) Projections by Vaccine, 2023 to 2033
Figure 172: South Asia and Pacific Market Value (US$ Million) Analysis by End User, 2018 to 2033
Figure 173: South Asia and Pacific Market Volume (Units) Analysis by End User, 2018 to 2033
Figure 174: South Asia and Pacific Market Value Share (%) and BPS Analysis by End User, 2023 to 2033
Figure 175: South Asia and Pacific Market Y-o-Y Growth (%) Projections by End User, 2023 to 2033
Figure 176: South Asia and Pacific Market Attractiveness by Indication, 2023 to 2033
Figure 177: South Asia and Pacific Market Attractiveness by Technology, 2023 to 2033
Figure 178: South Asia and Pacific Market Attractiveness by Vaccine, 2023 to 2033
Figure 179: South Asia and Pacific Market Attractiveness by End User, 2023 to 2033
Figure 180: South Asia and Pacific Market Attractiveness by Country, 2023 to 2033
Figure 181: East Asia Market Value (US$ Million) by Indication, 2023 to 2033
Figure 182: East Asia Market Value (US$ Million) by Technology, 2023 to 2033
Figure 183: East Asia Market Value (US$ Million) by Vaccine, 2023 to 2033
Figure 184: East Asia Market Value (US$ Million) by End User, 2023 to 2033
Figure 185: East Asia Market Value (US$ Million) by Country, 2023 to 2033
Figure 186: East Asia Market Value (US$ Million) Analysis by Country, 2018 to 2033
Figure 187: East Asia Market Volume (Units) Analysis by Country, 2018 to 2033
Figure 188: East Asia Market Value Share (%) and BPS Analysis by Country, 2023 to 2033
Figure 189: East Asia Market Y-o-Y Growth (%) Projections by Country, 2023 to 2033
Figure 190: East Asia Market Value (US$ Million) Analysis by Indication, 2018 to 2033
Figure 191: East Asia Market Volume (Units) Analysis by Indication, 2018 to 2033
Figure 192: East Asia Market Value Share (%) and BPS Analysis by Indication, 2023 to 2033
Figure 193: East Asia Market Y-o-Y Growth (%) Projections by Indication, 2023 to 2033
Figure 194: East Asia Market Value (US$ Million) Analysis by Technology, 2018 to 2033
Figure 195: East Asia Market Volume (Units) Analysis by Technology, 2018 to 2033
Figure 196: East Asia Market Value Share (%) and BPS Analysis by Technology, 2023 to 2033
Figure 197: East Asia Market Y-o-Y Growth (%) Projections by Technology, 2023 to 2033
Figure 198: East Asia Market Value (US$ Million) Analysis by Vaccine, 2018 to 2033
Figure 199: East Asia Market Volume (Units) Analysis by Vaccine, 2018 to 2033
Figure 200: East Asia Market Value Share (%) and BPS Analysis by Vaccine, 2023 to 2033
Figure 201: East Asia Market Y-o-Y Growth (%) Projections by Vaccine, 2023 to 2033
Figure 202: East Asia Market Value (US$ Million) Analysis by End User, 2018 to 2033
Figure 203: East Asia Market Volume (Units) Analysis by End User, 2018 to 2033
Figure 204: East Asia Market Value Share (%) and BPS Analysis by End User, 2023 to 2033
Figure 205: East Asia Market Y-o-Y Growth (%) Projections by End User, 2023 to 2033
Figure 206: East Asia Market Attractiveness by Indication, 2023 to 2033
Figure 207: East Asia Market Attractiveness by Technology, 2023 to 2033
Figure 208: East Asia Market Attractiveness by Vaccine, 2023 to 2033
Figure 209: East Asia Market Attractiveness by End User, 2023 to 2033
Figure 210: East Asia Market Attractiveness by Country, 2023 to 2033
Figure 211: Middle East and Africa Market Value (US$ Million) by Indication, 2023 to 2033
Figure 212: Middle East and Africa Market Value (US$ Million) by Technology, 2023 to 2033
Figure 213: Middle East and Africa Market Value (US$ Million) by Vaccine, 2023 to 2033
Figure 214: Middle East and Africa Market Value (US$ Million) by End User, 2023 to 2033
Figure 215: Middle East and Africa Market Value (US$ Million) by Country, 2023 to 2033
Figure 216: Middle East and Africa Market Value (US$ Million) Analysis by Country, 2018 to 2033
Figure 217: Middle East and Africa Market Volume (Units) Analysis by Country, 2018 to 2033
Figure 218: Middle East and Africa Market Value Share (%) and BPS Analysis by Country, 2023 to 2033
Figure 219: Middle East and Africa Market Y-o-Y Growth (%) Projections by Country, 2023 to 2033
Figure 220: Middle East and Africa Market Value (US$ Million) Analysis by Indication, 2018 to 2033
Figure 221: Middle East and Africa Market Volume (Units) Analysis by Indication, 2018 to 2033
Figure 222: Middle East and Africa Market Value Share (%) and BPS Analysis by Indication, 2023 to 2033
Figure 223: Middle East and Africa Market Y-o-Y Growth (%) Projections by Indication, 2023 to 2033
Figure 224: Middle East and Africa Market Value (US$ Million) Analysis by Technology, 2018 to 2033
Figure 225: Middle East and Africa Market Volume (Units) Analysis by Technology, 2018 to 2033
Figure 226: Middle East and Africa Market Value Share (%) and BPS Analysis by Technology, 2023 to 2033
Figure 227: Middle East and Africa Market Y-o-Y Growth (%) Projections by Technology, 2023 to 2033
Figure 228: Middle East and Africa Market Value (US$ Million) Analysis by Vaccine, 2018 to 2033
Figure 229: Middle East and Africa Market Volume (Units) Analysis by Vaccine, 2018 to 2033
Figure 230: Middle East and Africa Market Value Share (%) and BPS Analysis by Vaccine, 2023 to 2033
Figure 231: Middle East and Africa Market Y-o-Y Growth (%) Projections by Vaccine, 2023 to 2033
Figure 232: Middle East and Africa Market Value (US$ Million) Analysis by End User, 2018 to 2033
Figure 233: Middle East and Africa Market Volume (Units) Analysis by End User, 2018 to 2033
Figure 234: Middle East and Africa Market Value Share (%) and BPS Analysis by End User, 2023 to 2033
Figure 235: Middle East and Africa Market Y-o-Y Growth (%) Projections by End User, 2023 to 2033
Figure 236: Middle East and Africa Market Attractiveness by Indication, 2023 to 2033
Figure 237: Middle East and Africa Market Attractiveness by Technology, 2023 to 2033
Figure 238: Middle East and Africa Market Attractiveness by Vaccine, 2023 to 2033
Figure 239: Middle East and Africa Market Attractiveness by End User, 2023 to 2033
Figure 240: Middle East and Africa Market Attractiveness by Country, 2023 to 2033
The paediatric vaccine market is projected to grow at a rate of 13.1% through 2033.
Pfizer Inc., GlaxoSmithKline Plc, and Merck & Co. Inc. are some of the prominent companies in the market.
The market is predicted to reach a valuation of USD 184,706.7 million by 2033.
The pneumococcal vaccine is the leading vaccine type by indication.
Rising health awareness among the people is the major factor driving the demand for paediatric vaccines.
Explore Similar Insights
Thank you!
You will receive an email from our Business Development Manager. Please be sure to check your SPAM/JUNK folder too.