Paediatric Oncology Therapeutics Market Size and Share Forecast Outlook 2025 to 2035

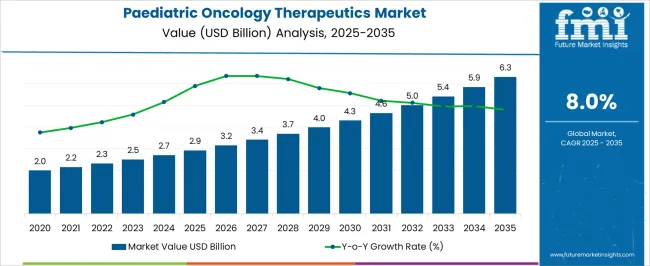
The Paediatric Oncology Therapeutics Market is estimated to be valued at USD 2.9 billion in 2025 and is projected to reach USD 6.3 billion by 2035, registering a compound annual growth rate (CAGR) of 8.0% over the forecast period.
Quick Stats for Paediatric Oncology Therapeutics Market

  • Paediatric Oncology Therapeutics Market Value (2025): USD 2.9 billion
  • Paediatric Oncology Therapeutics Market Forecast Value (2035): USD 6.3 billion
  • Paediatric Oncology Therapeutics Market Forecast CAGR: 8.0%
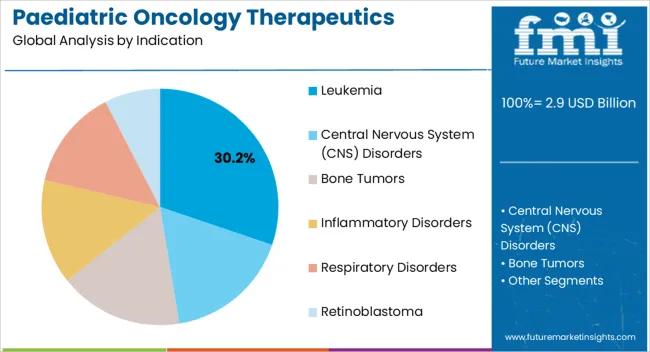
  • Leading Segment in Paediatric Oncology Therapeutics Market in 2025: Leukemia (30.2%)
  • Key Growth Regions in Paediatric Oncology Therapeutics Market: North America, Asia-Pacific, Europe
  • Top Key Players in Paediatric Oncology Therapeutics Market: Pfizer Inc., Novartis AG, F. Hoffmann-La Roche Ltd., Bristol Myers Squibb Company, Merck & Co., Inc., Sanofi S.A., AbbVie Inc., Takeda Pharmaceutical Company Limited, GlaxoSmithKline plc, AstraZeneca plc

Paediatric Oncology Therapeutics Market Market Value Analysis

Paediatric Oncology Therapeutics Market Key Takeaways

Metric Value
Paediatric Oncology Therapeutics Market Estimated Value in (2025 E) USD 2.9 billion
Paediatric Oncology Therapeutics Market Forecast Value in (2035 F) USD 6.3 billion
Forecast CAGR (2025 to 2035) 8.0%

Why is the Paediatric Oncology Therapeutics Market Growing?

The Paediatric Oncology Therapeutics market is advancing steadily, fueled by the increasing incidence of childhood cancers and the urgent need for effective, age-appropriate treatment options. Rising investments in research and development are expanding the therapeutic pipeline, with a focus on targeted therapies, immunotherapies, and precision medicine approaches tailored for paediatric patients. Improvements in early diagnostic technologies and growing awareness among healthcare providers and parents are also contributing to higher treatment adoption rates.

In addition, global health organizations and governments are strengthening support for paediatric oncology care through funding initiatives, awareness programs, and better access to treatment facilities. While challenges remain, such as treatment-related side effects and limited availability of paediatric-specific formulations, technological advancements and novel drug development are helping overcome these barriers. Increasing collaboration between pharmaceutical companies, research institutes, and regulatory agencies is fostering innovation and accelerating clinical trials.

As survivorship rates improve, demand for therapies that minimize long-term complications is shaping the market’s evolution Collectively, these factors are expected to sustain the growth of the Paediatric Oncology Therapeutics market across both developed and emerging healthcare systems.

Segmental Analysis

The paediatric oncology therapeutics market is segmented by indication, treatment, and geographic regions. By indication, paediatric oncology therapeutics market is divided into Leukemia, Central Nervous System (CNS) Disorders, Bone Tumors, Inflammatory Disorders, Respiratory Disorders, and Retinoblastoma. In terms of treatment, paediatric oncology therapeutics market is classified into Chemotherapy, Radiotheraphy, Tumor Surgery, Blood And Marrow Transplantation, and Drug Therapy. Regionally, the paediatric oncology therapeutics industry is classified into North America, Latin America, Western Europe, Eastern Europe, Balkan & Baltic Countries, Russia & Belarus, Central Asia, East Asia, South Asia & Pacific, and the Middle East & Africa.
Insights into the Leukemia Indication Segment

Paediatric Oncology Therapeutics Market Analysis By Indication

The leukemia indication segment is projected to account for 30.2% of the Paediatric Oncology Therapeutics market revenue in 2025, making it the leading indication. The high prevalence of leukemia among children compared to other cancer types is driving demand for specialized therapeutic interventions. Leukemia treatment protocols have become increasingly effective due to advancements in targeted therapies, stem cell transplantation, and supportive care measures, which are improving survival outcomes.

The integration of genetic and molecular diagnostics is further refining treatment approaches, allowing for more precise and personalized therapy regimens. Governments and non-profit organizations are also enhancing awareness and improving access to early screening programs, which increases the likelihood of timely interventions.

The psychological and clinical complexities of treating paediatric leukemia necessitate continuous innovations in therapy design to reduce toxicity and long-term side effects As investment in research accelerates and global efforts expand to develop paediatric-specific drug formulations, leukemia is expected to remain the most significant contributor to the paediatric oncology therapeutics market, reinforcing its leadership in the years ahead.
Insights into the Chemotherapy Treatment Segment

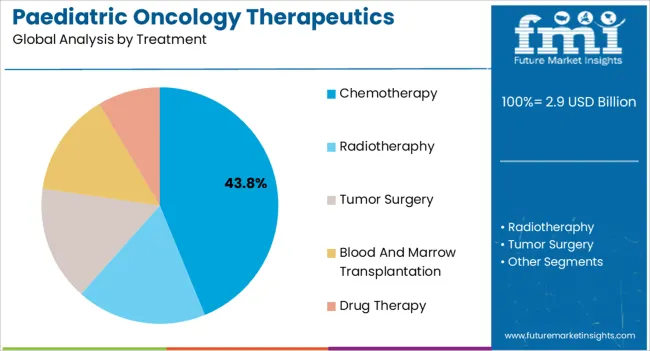
Paediatric Oncology Therapeutics Market Analysis By Treatment

The chemotherapy treatment segment is expected to hold 43.8% of the Paediatric Oncology Therapeutics market revenue in 2025, consolidating its position as the leading treatment approach. Despite the emergence of advanced therapies, chemotherapy continues to be the standard of care due to its proven efficacy in treating a wide range of childhood cancers, including leukemia, lymphomas, and solid tumors. The segment’s dominance is reinforced by its established role in combination regimens, where chemotherapy is administered alongside radiation, targeted therapies, or immunotherapies to improve patient outcomes.

Ongoing advancements in dosage optimization and supportive care are mitigating adverse effects, making chemotherapy safer and more tolerable for paediatric patients. The widespread availability of chemotherapy drugs, coupled with healthcare systems’ familiarity with their administration, further supports their continued preference.

Moreover, affordability compared to advanced biologics ensures accessibility in both developed and developing markets While innovations in targeted and precision therapies are reshaping the future, chemotherapy’s critical role in front-line treatment and relapse management ensures it will remain a cornerstone of paediatric oncology therapeutics over the forecast period.

Market Overview

Paediatric Oncology Therapeutics Market Overview

Children are affected by different forms of cancer than adults, there also exists a major difference between children and adults regarding treatment and development of new oncology therapies. The prominent variation is the concept of survival.

With adult cancer patients, it is acceptable to look to immediate, 5 and 10-year survival rates, along with quality of life, for the best approximations of therapeutic success. On the other hand, a child cancer patient receives treatment to be cured.

A typical difference between adult and pediatric oncologists is in treatment protocols; pediatric protocols are much more vigorous, often hitting patients “as hard as possible” to achieve a successful, long-term cure.
Analysis of Paediatric Oncology Therapeutics Market By Key Countries

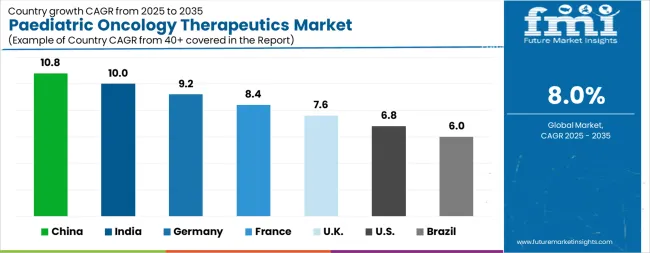
Paediatric Oncology Therapeutics Market Cagr Analysis By Country

Country CAGR
China 10.8%
India 10.0%
Germany 9.2%
France 8.4%
UK 7.6%
USA 6.8%
Brazil 6.0%

Country-wise Analysis

The Paediatric Oncology Therapeutics Market is expected to register a CAGR of 8.0% during the forecast period, exhibiting varied country level momentum. China leads with the highest CAGR of 10.8%, followed by India at 10.0%. Developed markets such as Germany, France, and the UK continue to expand steadily, while the USA is likely to grow at consistent rates. Brazil posts the lowest CAGR at 6.0%, yet still underscores a broadly positive trajectory for the global Paediatric Oncology Therapeutics Market. In 2024, Germany held a dominant revenue in the Western Europe market and is expected to grow with a CAGR of 9.2%. The USA Paediatric Oncology Therapeutics Market is estimated to be valued at USD 1.1 billion in 2025 and is anticipated to reach a valuation of USD 2.1 billion by 2035. Sales are projected to rise at a CAGR of 6.8% over the forecast period between 2025 and 2035. While Japan and South Korea markets are estimated to be valued at USD 151.3 million and USD 100.9 million respectively in 2025.
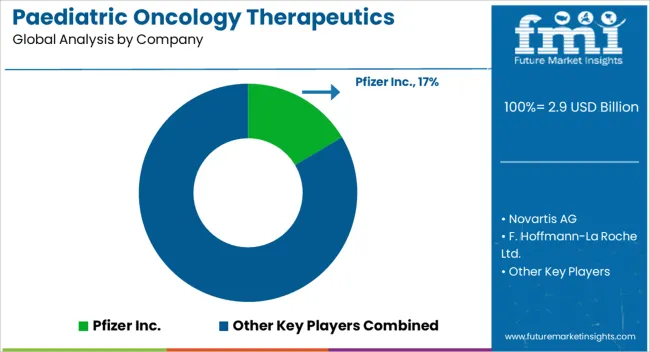
Key Players in the Paediatric Oncology Therapeutics Market

Paediatric Oncology Therapeutics Market Analysis By Company

  • Pfizer Inc.
  • Novartis AG
  • F. Hoffmann-La Roche Ltd.
  • Bristol Myers Squibb Company
  • Merck & Co., Inc.
  • Sanofi S.A.
  • AbbVie Inc.
  • Takeda Pharmaceutical Company Limited
  • GlaxoSmithKline plc
  • AstraZeneca plc

Scope of the Report

Item Value
Quantitative Units USD 2.9 Billion
Indication Leukemia, Central Nervous System (CNS) Disorders, Bone Tumors, Inflammatory Disorders, Respiratory Disorders, and Retinoblastoma
Treatment Chemotherapy, Radiotheraphy, Tumor Surgery, Blood And Marrow Transplantation, and Drug Therapy
Regions Covered North America, Europe, Asia-Pacific, Latin America, Middle East & Africa
Country Covered United States, Canada, Germany, France, United Kingdom, China, Japan, India, Brazil, South Africa
Key Companies Profiled Pfizer Inc., Novartis AG, F. Hoffmann-La Roche Ltd., Bristol Myers Squibb Company, Merck & Co., Inc., Sanofi S.A., AbbVie Inc., Takeda Pharmaceutical Company Limited, GlaxoSmithKline plc, and AstraZeneca plc

Paediatric Oncology Therapeutics Market by Segments

Indication:

  • Leukemia
  • Central Nervous System (CNS) Disorders
  • Bone Tumors
  • Inflammatory Disorders
  • Respiratory Disorders
  • Retinoblastoma

Treatment:

  • Chemotherapy
  • Radiotheraphy
  • Tumor Surgery
  • Blood And Marrow Transplantation
  • Drug Therapy

Region:

  • North America
    • USA
    • Canada
    • Mexico
  • Latin America
    • Brazil
    • Chile
    • Rest of Latin America
  • Western Europe
    • Germany
    • UK
    • Italy
    • Spain
    • France
    • Nordic
    • BENELUX
    • Rest of Western Europe
  • Eastern Europe
    • Russia
    • Poland
    • Hungary
    • Balkan & Baltic
    • Rest of Eastern Europe
  • East Asia
    • China
    • Japan
    • South Korea
  • South Asia and Pacific
    • India
    • ASEAN
    • Australia & New Zealand
    • Rest of South Asia and Pacific
  • Middle East & Africa
    • Kingdom of Saudi Arabia
    • Other GCC Countries
    • Turkiye
    • South Africa
    • Other African Union
    • Rest of Middle East & Africa

Table of Content

  1. Executive Summary
    • Global Market Outlook
    • Demand-side Trends
    • Supply-side Trends
    • Technology Roadmap Analysis
    • Analysis and Recommendations
  2. Market Overview
    • Market Coverage / Taxonomy
    • Market Definition / Scope / Limitations
  3. Market Background
    • Market Dynamics
      • Drivers
      • Restraints
      • Opportunity
      • Trends
    • Scenario Forecast
      • Demand in Optimistic Scenario
      • Demand in Likely Scenario
      • Demand in Conservative Scenario
    • Opportunity Map Analysis
    • Product Life Cycle Analysis
    • Supply Chain Analysis
    • Investment Feasibility Matrix
    • Value Chain Analysis
    • PESTLE and Porter’s Analysis
    • Regulatory Landscape
    • Regional Parent Market Outlook
    • Production and Consumption Statistics
    • Import and Export Statistics
  4. Global Market Analysis 2020 to 2024 and Forecast, 2025 to 2035
    • Historical Market Size Value (USD Million) Analysis, 2020 to 2024
    • Current and Future Market Size Value (USD Million) Projections, 2025 to 2035
      • Y-o-Y Growth Trend Analysis
      • Absolute $ Opportunity Analysis
  5. Global Market Pricing Analysis 2020 to 2024 and Forecast 2025 to 2035
  6. Global Market Analysis 2020 to 2024 and Forecast 2025 to 2035, By Indication
    • Introduction / Key Findings
    • Historical Market Size Value (USD Million) Analysis By Indication , 2020 to 2024
    • Current and Future Market Size Value (USD Million) Analysis and Forecast By Indication , 2025 to 2035
      • Leukemia
      • Central Nervous System (CNS) Disorders
      • Bone Tumors
      • Inflammatory Disorders
      • Respiratory Disorders
      • Retinoblastoma
    • Y-o-Y Growth Trend Analysis By Indication , 2020 to 2024
    • Absolute $ Opportunity Analysis By Indication , 2025 to 2035
  7. Global Market Analysis 2020 to 2024 and Forecast 2025 to 2035, By Treatment
    • Introduction / Key Findings
    • Historical Market Size Value (USD Million) Analysis By Treatment, 2020 to 2024
    • Current and Future Market Size Value (USD Million) Analysis and Forecast By Treatment, 2025 to 2035
      • Chemotherapy
      • Radiotheraphy
      • Tumor Surgery
      • Blood And Marrow Transplantation
      • Drug Therapy
    • Y-o-Y Growth Trend Analysis By Treatment, 2020 to 2024
    • Absolute $ Opportunity Analysis By Treatment, 2025 to 2035
  8. Global Market Analysis 2020 to 2024 and Forecast 2025 to 2035, By Region
    • Introduction
    • Historical Market Size Value (USD Million) Analysis By Region, 2020 to 2024
    • Current Market Size Value (USD Million) Analysis and Forecast By Region, 2025 to 2035
      • North America
      • Latin America
      • Western Europe
      • Eastern Europe
      • East Asia
      • South Asia and Pacific
      • Middle East & Africa
    • Market Attractiveness Analysis By Region
  9. North America Market Analysis 2020 to 2024 and Forecast 2025 to 2035, By Country
    • Historical Market Size Value (USD Million) Trend Analysis By Market Taxonomy, 2020 to 2024
    • Market Size Value (USD Million) Forecast By Market Taxonomy, 2025 to 2035
      • By Country
        • USA
        • Canada
        • Mexico
      • By Indication
      • By Treatment
    • Market Attractiveness Analysis
      • By Country
      • By Indication
      • By Treatment
    • Key Takeaways
  10. Latin America Market Analysis 2020 to 2024 and Forecast 2025 to 2035, By Country
    • Historical Market Size Value (USD Million) Trend Analysis By Market Taxonomy, 2020 to 2024
    • Market Size Value (USD Million) Forecast By Market Taxonomy, 2025 to 2035
      • By Country
        • Brazil
        • Chile
        • Rest of Latin America
      • By Indication
      • By Treatment
    • Market Attractiveness Analysis
      • By Country
      • By Indication
      • By Treatment
    • Key Takeaways
  11. Western Europe Market Analysis 2020 to 2024 and Forecast 2025 to 2035, By Country
    • Historical Market Size Value (USD Million) Trend Analysis By Market Taxonomy, 2020 to 2024
    • Market Size Value (USD Million) Forecast By Market Taxonomy, 2025 to 2035
      • By Country
        • Germany
        • UK
        • Italy
        • Spain
        • France
        • Nordic
        • BENELUX
        • Rest of Western Europe
      • By Indication
      • By Treatment
    • Market Attractiveness Analysis
      • By Country
      • By Indication
      • By Treatment
    • Key Takeaways
  12. Eastern Europe Market Analysis 2020 to 2024 and Forecast 2025 to 2035, By Country
    • Historical Market Size Value (USD Million) Trend Analysis By Market Taxonomy, 2020 to 2024
    • Market Size Value (USD Million) Forecast By Market Taxonomy, 2025 to 2035
      • By Country
        • Russia
        • Poland
        • Hungary
        • Balkan & Baltic
        • Rest of Eastern Europe
      • By Indication
      • By Treatment
    • Market Attractiveness Analysis
      • By Country
      • By Indication
      • By Treatment
    • Key Takeaways
  13. East Asia Market Analysis 2020 to 2024 and Forecast 2025 to 2035, By Country
    • Historical Market Size Value (USD Million) Trend Analysis By Market Taxonomy, 2020 to 2024
    • Market Size Value (USD Million) Forecast By Market Taxonomy, 2025 to 2035
      • By Country
        • China
        • Japan
        • South Korea
      • By Indication
      • By Treatment
    • Market Attractiveness Analysis
      • By Country
      • By Indication
      • By Treatment
    • Key Takeaways
  14. South Asia and Pacific Market Analysis 2020 to 2024 and Forecast 2025 to 2035, By Country
    • Historical Market Size Value (USD Million) Trend Analysis By Market Taxonomy, 2020 to 2024
    • Market Size Value (USD Million) Forecast By Market Taxonomy, 2025 to 2035
      • By Country
        • India
        • ASEAN
        • Australia & New Zealand
        • Rest of South Asia and Pacific
      • By Indication
      • By Treatment
    • Market Attractiveness Analysis
      • By Country
      • By Indication
      • By Treatment
    • Key Takeaways
  15. Middle East & Africa Market Analysis 2020 to 2024 and Forecast 2025 to 2035, By Country
    • Historical Market Size Value (USD Million) Trend Analysis By Market Taxonomy, 2020 to 2024
    • Market Size Value (USD Million) Forecast By Market Taxonomy, 2025 to 2035
      • By Country
        • Kingdom of Saudi Arabia
        • Other GCC Countries
        • Turkiye
        • South Africa
        • Other African Union
        • Rest of Middle East & Africa
      • By Indication
      • By Treatment
    • Market Attractiveness Analysis
      • By Country
      • By Indication
      • By Treatment
    • Key Takeaways
  16. Key Countries Market Analysis
    • USA
      • Pricing Analysis
      • Market Share Analysis, 2024
        • By Indication
        • By Treatment
    • Canada
      • Pricing Analysis
      • Market Share Analysis, 2024
        • By Indication
        • By Treatment
    • Mexico
      • Pricing Analysis
      • Market Share Analysis, 2024
        • By Indication
        • By Treatment
    • Brazil
      • Pricing Analysis
      • Market Share Analysis, 2024
        • By Indication
        • By Treatment
    • Chile
      • Pricing Analysis
      • Market Share Analysis, 2024
        • By Indication
        • By Treatment
    • Germany
      • Pricing Analysis
      • Market Share Analysis, 2024
        • By Indication
        • By Treatment
    • UK
      • Pricing Analysis
      • Market Share Analysis, 2024
        • By Indication
        • By Treatment
    • Italy
      • Pricing Analysis
      • Market Share Analysis, 2024
        • By Indication
        • By Treatment
    • Spain
      • Pricing Analysis
      • Market Share Analysis, 2024
        • By Indication
        • By Treatment
    • France
      • Pricing Analysis
      • Market Share Analysis, 2024
        • By Indication
        • By Treatment
    • India
      • Pricing Analysis
      • Market Share Analysis, 2024
        • By Indication
        • By Treatment
    • ASEAN
      • Pricing Analysis
      • Market Share Analysis, 2024
        • By Indication
        • By Treatment
    • Australia & New Zealand
      • Pricing Analysis
      • Market Share Analysis, 2024
        • By Indication
        • By Treatment
    • China
      • Pricing Analysis
      • Market Share Analysis, 2024
        • By Indication
        • By Treatment
    • Japan
      • Pricing Analysis
      • Market Share Analysis, 2024
        • By Indication
        • By Treatment
    • South Korea
      • Pricing Analysis
      • Market Share Analysis, 2024
        • By Indication
        • By Treatment
    • Russia
      • Pricing Analysis
      • Market Share Analysis, 2024
        • By Indication
        • By Treatment
    • Poland
      • Pricing Analysis
      • Market Share Analysis, 2024
        • By Indication
        • By Treatment
    • Hungary
      • Pricing Analysis
      • Market Share Analysis, 2024
        • By Indication
        • By Treatment
    • Kingdom of Saudi Arabia
      • Pricing Analysis
      • Market Share Analysis, 2024
        • By Indication
        • By Treatment
    • Turkiye
      • Pricing Analysis
      • Market Share Analysis, 2024
        • By Indication
        • By Treatment
    • South Africa
      • Pricing Analysis
      • Market Share Analysis, 2024
        • By Indication
        • By Treatment
  17. Market Structure Analysis
    • Competition Dashboard
    • Competition Benchmarking
    • Market Share Analysis of Top Players
      • By Regional
      • By Indication
      • By Treatment
  18. Competition Analysis
    • Competition Deep Dive
      • Pfizer Inc.
        • Overview
        • Product Portfolio
        • Profitability by Market Segments (Product/Age /Sales Channel/Region)
        • Sales Footprint
        • Strategy Overview
          • Marketing Strategy
          • Product Strategy
          • Channel Strategy
      • Novartis AG
      • F. Hoffmann-La Roche Ltd.
      • Bristol Myers Squibb Company
      • Merck & Co., Inc.
      • Sanofi S.A.
      • AbbVie Inc.
      • Takeda Pharmaceutical Company Limited
      • GlaxoSmithKline plc
      • AstraZeneca plc
  19. Assumptions & Acronyms Used
  20. Research Methodology

List of Tables

  • Table 1: Global Market Value (USD Million) Forecast by Region, 2020 to 2035
  • Table 2: Global Market Value (USD Million) Forecast by Indication , 2020 to 2035
  • Table 3: Global Market Value (USD Million) Forecast by Treatment, 2020 to 2035
  • Table 4: North America Market Value (USD Million) Forecast by Country, 2020 to 2035
  • Table 5: North America Market Value (USD Million) Forecast by Indication , 2020 to 2035
  • Table 6: North America Market Value (USD Million) Forecast by Treatment, 2020 to 2035
  • Table 7: Latin America Market Value (USD Million) Forecast by Country, 2020 to 2035
  • Table 8: Latin America Market Value (USD Million) Forecast by Indication , 2020 to 2035
  • Table 9: Latin America Market Value (USD Million) Forecast by Treatment, 2020 to 2035
  • Table 10: Western Europe Market Value (USD Million) Forecast by Country, 2020 to 2035
  • Table 11: Western Europe Market Value (USD Million) Forecast by Indication , 2020 to 2035
  • Table 12: Western Europe Market Value (USD Million) Forecast by Treatment, 2020 to 2035
  • Table 13: Eastern Europe Market Value (USD Million) Forecast by Country, 2020 to 2035
  • Table 14: Eastern Europe Market Value (USD Million) Forecast by Indication , 2020 to 2035
  • Table 15: Eastern Europe Market Value (USD Million) Forecast by Treatment, 2020 to 2035
  • Table 16: East Asia Market Value (USD Million) Forecast by Country, 2020 to 2035
  • Table 17: East Asia Market Value (USD Million) Forecast by Indication , 2020 to 2035
  • Table 18: East Asia Market Value (USD Million) Forecast by Treatment, 2020 to 2035
  • Table 19: South Asia and Pacific Market Value (USD Million) Forecast by Country, 2020 to 2035
  • Table 20: South Asia and Pacific Market Value (USD Million) Forecast by Indication , 2020 to 2035
  • Table 21: South Asia and Pacific Market Value (USD Million) Forecast by Treatment, 2020 to 2035
  • Table 22: Middle East & Africa Market Value (USD Million) Forecast by Country, 2020 to 2035
  • Table 23: Middle East & Africa Market Value (USD Million) Forecast by Indication , 2020 to 2035
  • Table 24: Middle East & Africa Market Value (USD Million) Forecast by Treatment, 2020 to 2035

List of Figures

  • Figure 1: Global Market Pricing Analysis
  • Figure 2: Global Market Value (USD Million) Forecast 2020-2035
  • Figure 3: Global Market Value Share and BPS Analysis by Indication , 2025 and 2035
  • Figure 4: Global Market Y-o-Y Growth Comparison by Indication , 2025-2035
  • Figure 5: Global Market Attractiveness Analysis by Indication
  • Figure 6: Global Market Value Share and BPS Analysis by Treatment, 2025 and 2035
  • Figure 7: Global Market Y-o-Y Growth Comparison by Treatment, 2025-2035
  • Figure 8: Global Market Attractiveness Analysis by Treatment
  • Figure 9: Global Market Value (USD Million) Share and BPS Analysis by Region, 2025 and 2035
  • Figure 10: Global Market Y-o-Y Growth Comparison by Region, 2025-2035
  • Figure 11: Global Market Attractiveness Analysis by Region
  • Figure 12: North America Market Incremental Dollar Opportunity, 2025-2035
  • Figure 13: Latin America Market Incremental Dollar Opportunity, 2025-2035
  • Figure 14: Western Europe Market Incremental Dollar Opportunity, 2025-2035
  • Figure 15: Eastern Europe Market Incremental Dollar Opportunity, 2025-2035
  • Figure 16: East Asia Market Incremental Dollar Opportunity, 2025-2035
  • Figure 17: South Asia and Pacific Market Incremental Dollar Opportunity, 2025-2035
  • Figure 18: Middle East & Africa Market Incremental Dollar Opportunity, 2025-2035
  • Figure 19: North America Market Value Share and BPS Analysis by Country, 2025 and 2035
  • Figure 20: North America Market Value Share and BPS Analysis by Indication , 2025 and 2035
  • Figure 21: North America Market Y-o-Y Growth Comparison by Indication , 2025-2035
  • Figure 22: North America Market Attractiveness Analysis by Indication
  • Figure 23: North America Market Value Share and BPS Analysis by Treatment, 2025 and 2035
  • Figure 24: North America Market Y-o-Y Growth Comparison by Treatment, 2025-2035
  • Figure 25: North America Market Attractiveness Analysis by Treatment
  • Figure 26: Latin America Market Value Share and BPS Analysis by Country, 2025 and 2035
  • Figure 27: Latin America Market Value Share and BPS Analysis by Indication , 2025 and 2035
  • Figure 28: Latin America Market Y-o-Y Growth Comparison by Indication , 2025-2035
  • Figure 29: Latin America Market Attractiveness Analysis by Indication
  • Figure 30: Latin America Market Value Share and BPS Analysis by Treatment, 2025 and 2035
  • Figure 31: Latin America Market Y-o-Y Growth Comparison by Treatment, 2025-2035
  • Figure 32: Latin America Market Attractiveness Analysis by Treatment
  • Figure 33: Western Europe Market Value Share and BPS Analysis by Country, 2025 and 2035
  • Figure 34: Western Europe Market Value Share and BPS Analysis by Indication , 2025 and 2035
  • Figure 35: Western Europe Market Y-o-Y Growth Comparison by Indication , 2025-2035
  • Figure 36: Western Europe Market Attractiveness Analysis by Indication
  • Figure 37: Western Europe Market Value Share and BPS Analysis by Treatment, 2025 and 2035
  • Figure 38: Western Europe Market Y-o-Y Growth Comparison by Treatment, 2025-2035
  • Figure 39: Western Europe Market Attractiveness Analysis by Treatment
  • Figure 40: Eastern Europe Market Value Share and BPS Analysis by Country, 2025 and 2035
  • Figure 41: Eastern Europe Market Value Share and BPS Analysis by Indication , 2025 and 2035
  • Figure 42: Eastern Europe Market Y-o-Y Growth Comparison by Indication , 2025-2035
  • Figure 43: Eastern Europe Market Attractiveness Analysis by Indication
  • Figure 44: Eastern Europe Market Value Share and BPS Analysis by Treatment, 2025 and 2035
  • Figure 45: Eastern Europe Market Y-o-Y Growth Comparison by Treatment, 2025-2035
  • Figure 46: Eastern Europe Market Attractiveness Analysis by Treatment
  • Figure 47: East Asia Market Value Share and BPS Analysis by Country, 2025 and 2035
  • Figure 48: East Asia Market Value Share and BPS Analysis by Indication , 2025 and 2035
  • Figure 49: East Asia Market Y-o-Y Growth Comparison by Indication , 2025-2035
  • Figure 50: East Asia Market Attractiveness Analysis by Indication
  • Figure 51: East Asia Market Value Share and BPS Analysis by Treatment, 2025 and 2035
  • Figure 52: East Asia Market Y-o-Y Growth Comparison by Treatment, 2025-2035
  • Figure 53: East Asia Market Attractiveness Analysis by Treatment
  • Figure 54: South Asia and Pacific Market Value Share and BPS Analysis by Country, 2025 and 2035
  • Figure 55: South Asia and Pacific Market Value Share and BPS Analysis by Indication , 2025 and 2035
  • Figure 56: South Asia and Pacific Market Y-o-Y Growth Comparison by Indication , 2025-2035
  • Figure 57: South Asia and Pacific Market Attractiveness Analysis by Indication
  • Figure 58: South Asia and Pacific Market Value Share and BPS Analysis by Treatment, 2025 and 2035
  • Figure 59: South Asia and Pacific Market Y-o-Y Growth Comparison by Treatment, 2025-2035
  • Figure 60: South Asia and Pacific Market Attractiveness Analysis by Treatment
  • Figure 61: Middle East & Africa Market Value Share and BPS Analysis by Country, 2025 and 2035
  • Figure 62: Middle East & Africa Market Value Share and BPS Analysis by Indication , 2025 and 2035
  • Figure 63: Middle East & Africa Market Y-o-Y Growth Comparison by Indication , 2025-2035
  • Figure 64: Middle East & Africa Market Attractiveness Analysis by Indication
  • Figure 65: Middle East & Africa Market Value Share and BPS Analysis by Treatment, 2025 and 2035
  • Figure 66: Middle East & Africa Market Y-o-Y Growth Comparison by Treatment, 2025-2035
  • Figure 67: Middle East & Africa Market Attractiveness Analysis by Treatment
  • Figure 68: Global Market - Tier Structure Analysis
  • Figure 69: Global Market - Company Share Analysis

Frequently Asked Questions

How big is the paediatric oncology therapeutics market in 2025?

The global paediatric oncology therapeutics market is estimated to be valued at USD 2.9 billion in 2025.

What will be the size of paediatric oncology therapeutics market in 2035?

The market size for the paediatric oncology therapeutics market is projected to reach USD 6.3 billion by 2035.

How much will be the paediatric oncology therapeutics market growth between 2025 and 2035?

The paediatric oncology therapeutics market is expected to grow at a 8.0% CAGR between 2025 and 2035.

What are the key product types in the paediatric oncology therapeutics market?

The key product types in paediatric oncology therapeutics market are leukemia, central nervous system (cns) disorders, bone tumors, inflammatory disorders, respiratory disorders and retinoblastoma.

Which treatment segment to contribute significant share in the paediatric oncology therapeutics market in 2025?

In terms of treatment, chemotherapy segment to command 43.8% share in the paediatric oncology therapeutics market in 2025.

Explore Similar Insights

Future Market Insights

Paediatric Oncology Therapeutics Market

Chat With

MaRIA

Hi There, I am MaRIA, Your Market Research Intelligence Assistant. How may I help you?