Reports

- Global Locations -

Headquarters

Future Market Insights, Inc.

Christiana Corporate, 200
Continental Drive, Suite 401,
Newark, Delaware - 19713,
United States

T: +1-845-579-5705

Americas

Future Market Insights, Inc.

616 Corporate Way, Suite 2-9018,
Valley Cottage, NY 10989, United States

T: +1-347-918-3531

MEA

Future Market Insights

1602-6 Jumeirah Bay X2 Tower, Plot No: JLT-PH2-X2A,
Jumeirah Lakes Towers, Dubai,
United Arab Emirates

Europe

Future Market Insights

3rd Floor, 207 Regent Street,
W1B 3HH London
United Kingdom

T: + 44 (0) 20 8123 9659
D: +44 (0) 20 3287 4268

Asia Pacific

Future Market Insights

IndiaLand Global Tech Park, Unit UG-1, Behind Grand HighStreet, Phase 1, Hinjawadi, MH, Pune – 411057, India

Paediatric Spasticity Treatment Market Outlook (2022-2032)

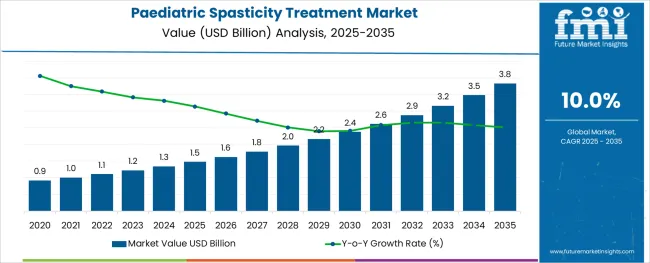
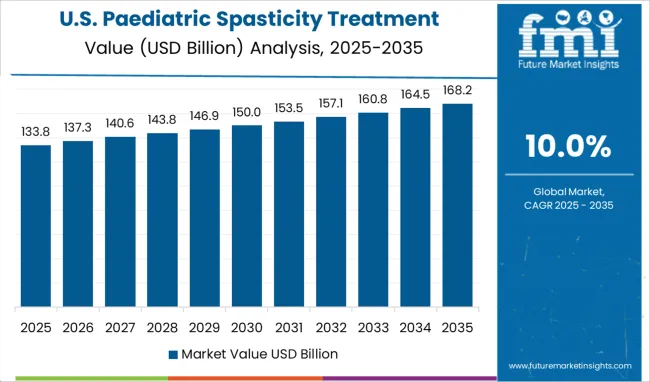
[324 Pages Report] The paediatric spasticity treatment market is expected to register a CAGR of 10% during the forecast period.

The global paediatric spasticity treatment market is fueled by rising demand for combination products such as benzodiazepines, imidazole, and gamma-aminobutyric acid analogs. In addition to this, demand for paediatric spasticity treatment is rising on account of raising awareness and investing in research and development.

Attributes Details
Paediatric Spasticity Treatment Market CAGR 10%
Paediatric Spasticity Treatment Market Size US$ 1.11 Billion in 2022

Improvement in healthcare infrastructure is also projected to contribute to the growth of the paediatric spasticity treatment market share.

The report sheds light on the factors improving the sales of paediatric spasticity treatment and, in turn, the opportunities for the market players. However, the paediatric spasticity treatment market also faces some challenges, which might limit the paediatric spasticity treatment market share from reaching its potential.

Some of the key paediatric spasticity treatment market trends promoting the demand for paediatric spasticity treatment include improvements in the innovation and technology in the industry as well as growing awareness of the pediatric spasticity treatment.

The advancement and development of new therapeutic treatments, as well as the growing number of clinical trials for paediatric spasticity treatment, provide a significant opportunity for the sales of paediatric spasticity treatment to grow over the forecast period.

In order to design a scale plan, organizations engaged in the paediatric spasticity treatment market must first identify their future goals, then analyze the many types of scale that could help them reach those goals, and finally decide which type of scale will bring the greatest organizational value.

Don't pay for what you don't need

Customize your report by selecting specific countries or regions and save 30%!

What are the Key Dynamics to the Paediatric Spasticity Treatment Market Share?

Increasing awareness, growing research and development for drug development drive the sales of paediatric spasticity treatment in the near future. Changing lifestyle, developing new and innovative technology, and improving healthcare infrastructure are expected to fuel the demand for paediatric spasticity treatment in the forecast period.

The launch of novel therapeutics and growing per capita income in emerging economies such as China and Brazil is further driving the sales of paediatric spasticity treatment.

Some key factors that might hinder the growth of paediatric spasticity treatment market include the high cost of treatment and low awareness in underdeveloped and developing countries, and rigorous regulations for the approval of drug.

The progress and development of new therapeutic treatments, as well as the growing number of clinical trials for paediatric spasticity treatment, provide a significant opportunity for the demand for paediatric spasticity treatment to grow over the forecast period. Collaboration and partnership among leading companies for the development of novel medications, as well as increased research funding, will boost the sales of paediatric spasticity treatment in the near future.
Which is the Key Paediatric Spasticity Treatment Market?

North America is expected to contribute to a major share in the global paediatric spasticity treatment market, owing to the increasing population, increasing number of screening procedures, presence of major manufacturers, and growing clinical trials.

Well-developed healthcare facilities and government funding for drug development further drive the sales of paediatric spasticity treatment. Europe contributes the second-largest share with significant growth in the demand for paediatric spasticity treatment owing to technological advancement in the treatment coupled with growing adoption of a new treatments. Asia Pacific paediatric spasticity treatment market is primarily driven by the factors such as growing prevalence, increasing population, and growing awareness of new treatment options.

China is expected to register rapid growth in the sales of paediatric spasticity treatment due to the large patient pool and availability of new drugs for the paediatric spasticity treatment. Latin America and Middle East & Africa are projected to show a slow rise in demand for paediatric spasticity treatment due to less awareness, lack of adequate healthcare facilities, and less developed infrastructure.
Sabyasachi Ghosh
Sabyasachi Ghosh

Principal Consultant

Talk to Analyst

Find your sweet spots for generating winning opportunities in this market.

How is the Competitive Landscape in the Paediatric Spasticity Treatment Market?

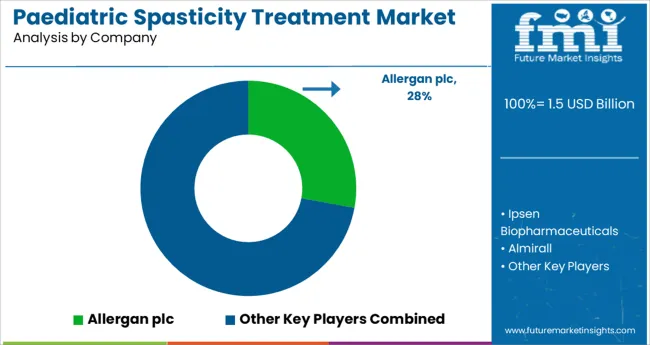
Some of the key players present in the global paediatric spasticity treatment are Allergan plc, Ipsen Biopharmaceuticals, Inc., Almirall, S.A, Piramal Critical Care, Inc., Genentech, Inc, Sanofi, Saol Therapeutics, and US WorldMeds, LLC among others.

The demand for paediatric spasticity treatment is moderately competitive, with several significant players. In terms of sales of paediatric spasticity treatment, just a few of the market's top firms are currently producing new products to solve unmet market challenges.

Recent Developments in the paediatric spasticity treatment market include:

The US Food and Drug Administration (FDA) accepted a supplementary Biologics License Application for XEOMIN in August 2020. (incobotulinumtoxinA).

The United States Food and Drug Administration (FDA) approved the expanded use of Dysport (abobotulinumtoxinA) for the treatment of Spasticity in paediatric patients in July 2020, according to Ipsen Biopharmaceuticals.

The report consists of key players, contributing to the paediatric spasticity treatment market share. It also consists of organic and inorganic growth strategies adopted by market players to improve their market positions. This exclusive report analysis the competitive landscape and paediatric spasticity treatment market share acquired by players to strengthen their market position.

Scope Of Report

Report Attribute Details
Growth rate CAGR of 10% from 2022 to 2032
Base year for estimation 2021
Historical data 2015 to 2021
Forecast period 2022 to 2032
Quantitative units Revenue in USD Million, volume in kilotons, and CAGR from 2022 to 2032
Report coverage Revenue forecast, volume forecast, company ranking, competitive landscape, growth factors, and trends, Pricing Analysis
Segments covered Drug type, route of administration, distribution channel, region
Regional scope North America; Western Europe, Eastern Europe, Middle East, Africa, ASEAN, South Asia, Rest of Asia, Australia and New Zealand
Country scope USA; Canada; Mexico; Germany; UK.; France; Italy; Spain; Russia; Belgium; Poland; Czech Republic; China; India; Japan; Australia; Brazil; Argentina; Colombia; Saudi Arabia; UAE; Iran; South Africa
Key companies profiled Allergan plc, Ipsen Biopharmaceuticals Inc.., Almirall, S.A, Piramal Critical Care, Inc., Genentech Inc, Sanofi, Saol Therapeutics, US WorldMeds, LLC among others.
Customization scope Free report customization (equivalent to up to 8 analysts working days) with purchase. Addition or alteration to country, regional & segment scope.
Pricing and purchase options Avail customized purchase options to meet your exact research needs.

Get the data you need at a Fraction of the cost

Personalize your report by choosing insights you need
and save 40%!

Key Segments

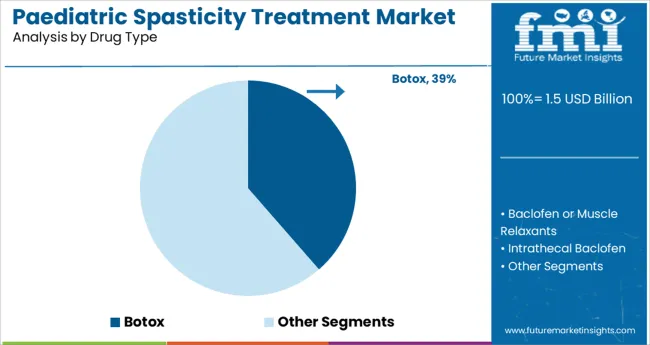
By Drug Type:

  • Baclofen or Muscle Relaxants
  • Botox
  • Intrathecal Baclofen
  • Clonazepam
  • Diazepam
  • Tizanidine
  • Others

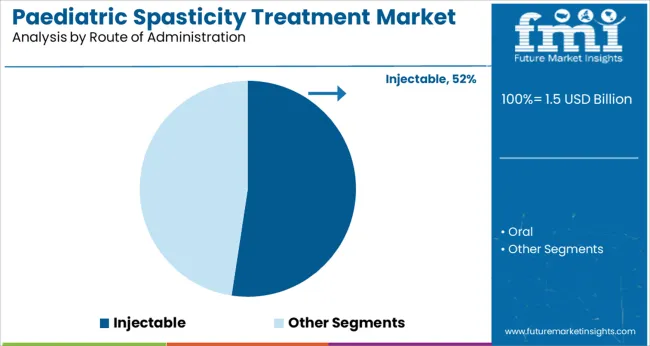
By Route of Administration:

  • Oral
  • Injectable

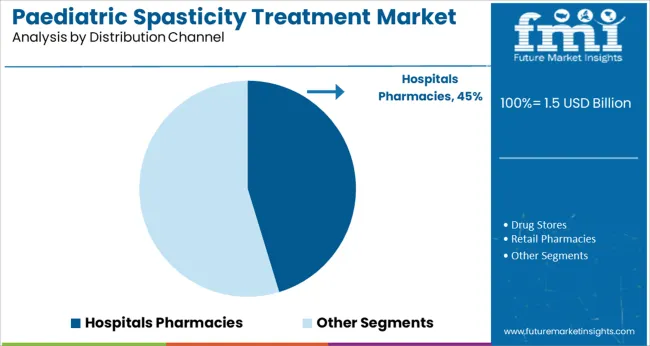
By Distribution Channel:

  • Hospitals Pharmacies
  • Drug Stores
  • Retail Pharmacies
  • Mail Order Pharmacies

By Region:

  • North America
  • Latin America
  • Asia Pacific
  • Europe
  • MEA

Frequently Asked Questions

What is the Growth Outlook for the Paediatric Spasticity Treatment Market?

The paediatric spasticity treatment market is likely to register a CAGR of 10% during the forecast period.

Who are the Key Players in the Paediatric Spasticity Treatment Market?

Key players holding substantial paediatric spasticity treatment market share include Allergan plc, Ipsen Biopharmaceuticals, Inc., Almirall, S.A, Piramal Critical Care, Inc., Genentech, Inc, Sanofi, Saol Therapeutics, and U.S. WorldMeds, LLC among others.

Which is the Key Driver in the Paediatric Spasticity Treatment Market?

Demand for paediatric spasticity treatment is likely to rise on the back of increasing global awareness and consistent investment in research and development.

Table of Content

1. Executive Summary

    1.1. Global Market Outlook

    1.2. Demand-side Trends

    1.3. Supply-side Trends

    1.4. Technology Roadmap Analysis

    1.5. Analysis and Recommendations

2. Market Overview

    2.1. Market Coverage / Taxonomy

    2.2. Market Definition / Scope / Limitations

3. Market Background

    3.1. Market Dynamics

        3.1.1. Drivers

        3.1.2. Restraints

        3.1.3. Opportunity 

        3.1.4. Trends

    3.2. Scenario Forecast

        3.2.1. Demand in Optimistic Scenario

        3.2.2. Demand in Likely Scenario

        3.2.3. Demand in Conservative Scenario

    3.3. Opportunity Map Analysis

    3.4. Product Life Cycle Analysis

    3.5. Investment Feasibility Matrix

    3.6. PESTLE and Porter’s Analysis

    3.7. Regulatory Landscape

        3.7.1. By Key Regions

        3.7.2. By Key Countries

    3.8. Regional Parent Market Outlook

4. Global Paediatric Spasticity Treatment Market Analysis 2017-2021 and Forecast, 2022-2032

    4.1. Historical Market Size Value (US$ Mn) Analysis, 2017-2021

    4.2. Current and Future Market Size Value (US$ Mn) Projections, 2022-2032

        4.2.1. Y-o-Y Growth Trend Analysis

        4.2.2. Absolute $ Opportunity Analysis

5. Global Paediatric Spasticity Treatment Market Analysis 2017-2021 and Forecast 2022-2032, By Drug Type

    5.1. Introduction / Key Findings

    5.2. Historical Market Size Value (US$ Mn) Analysis By Drug Type, 2017-2021

    5.3. Current and Future Market Size Value (US$ Mn) Analysis and Forecast By Drug Type, 2022-2032

        5.3.1. Baclofen or Muscle Relaxants

        5.3.2. Botox

        5.3.3. Intrathecal Baclofen

        5.3.4. Clonazepam

        5.3.5. Diazepam

        5.3.6. Tizanidine

        5.3.7. Others 

    5.4. Y-o-Y Growth Trend Analysis By Drug Type, 2017-2021

    5.5. Absolute $ Opportunity Analysis By Drug Type, 2022-2032

6. Global Paediatric Spasticity Treatment Market Analysis 2017-2021 and Forecast 2022-2032, By Route of Administration

    6.1. Introduction / Key Findings

    6.2. Historical Market Size Value (US$ Mn) Analysis By Route of Administration, 2017-2021

    6.3. Current and Future Market Size Value (US$ Mn) Analysis and Forecast By Route of Administration, 2022-2032

        6.3.1. Oral

        6.3.2. Injectable

    6.4. Y-o-Y Growth Trend Analysis By Route of Administration, 2017-2021

    6.5. Absolute $ Opportunity Analysis By Route of Administration, 2022-2032

7. Global Paediatric Spasticity Treatment Market Analysis 2017-2021 and Forecast 2022-2032, By Distribution Channel

    7.1. Introduction / Key Findings

    7.2. Historical Market Size Value (US$ Mn) Analysis By Distribution Channel, 2017-2021

    7.3. Current and Future Market Size Value (US$ Mn) Analysis and Forecast By Distribution Channel, 2022-2032

        7.3.1. Hospitals Pharmacies

        7.3.2. Drug Stores

        7.3.3. Retail Pharmacies

        7.3.4. Mail Order Pharmacies

    7.4. Y-o-Y Growth Trend Analysis By Distribution Channel, 2017-2021

    7.5. Absolute $ Opportunity Analysis By Distribution Channel, 2022-2032

8. Global Paediatric Spasticity Treatment Market Analysis 2017-2021 and Forecast 2022-2032, By Region

    8.1. Introduction

    8.2. Historical Market Size Value (US$ Mn) Analysis By Region, 2017-2021

    8.3. Current Market Size Value (US$ Mn) Analysis and Forecast By Region, 2022-2032

        8.3.1. North America

        8.3.2. Latin America

        8.3.3. Europe

        8.3.4. Asia Pacific

        8.3.5. Middle East and Africa

    8.4. Market Attractiveness Analysis By Region

9. North America Paediatric Spasticity Treatment Market Analysis 2017-2021 and Forecast 2022-2032, By Country

    9.1. Historical Market Size Value (US$ Mn) Trend Analysis By Market Taxonomy, 2017-2021

    9.2. Market Size Value (US$ Mn) Forecast By Market Taxonomy, 2022-2032

        9.2.1. By Country

            9.2.1.1. U.S.

            9.2.1.2. Canada

        9.2.2. By Drug Type

        9.2.3. By Route of Administration

        9.2.4. By Distribution Channel

    9.3. Market Attractiveness Analysis

        9.3.1. By Country

        9.3.2. By Drug Type

        9.3.3. By Route of Administration

        9.3.4. By Distribution Channel

    9.4. Key Takeaways

10. Latin America Paediatric Spasticity Treatment Market Analysis 2017-2021 and Forecast 2022-2032, By Country

    10.1. Historical Market Size Value (US$ Mn) Trend Analysis By Market Taxonomy, 2017-2021

    10.2. Market Size Value (US$ Mn) Forecast By Market Taxonomy, 2022-2032

        10.2.1. By Country

            10.2.1.1. Brazil

            10.2.1.2. Mexico

            10.2.1.3. Rest of Latin America

        10.2.2. By Drug Type

        10.2.3. By Route of Administration

        10.2.4. By Distribution Channel

    10.3. Market Attractiveness Analysis

        10.3.1. By Country

        10.3.2. By Drug Type

        10.3.3. By Route of Administration

        10.3.4. By Distribution Channel

    10.4. Key Takeaways

11. Europe Paediatric Spasticity Treatment Market Analysis 2017-2021 and Forecast 2022-2032, By Country

    11.1. Historical Market Size Value (US$ Mn) Trend Analysis By Market Taxonomy, 2017-2021

    11.2. Market Size Value (US$ Mn) Forecast By Market Taxonomy, 2022-2032

        11.2.1. By Country

            11.2.1.1. Germany

            11.2.1.2. Italy

            11.2.1.3. France

            11.2.1.4. U.K.

            11.2.1.5. Russia

            11.2.1.6. BENELUX

            11.2.1.7. Rest of Europe

        11.2.2. By Drug Type

        11.2.3. By Route of Administration

        11.2.4. By Distribution Channel

    11.3. Market Attractiveness Analysis

        11.3.1. By Country

        11.3.2. By Drug Type

        11.3.3. By Route of Administration

        11.3.4. By Distribution Channel

    11.4. Key Takeaways

12. Asia Pacific Paediatric Spasticity Treatment Market Analysis 2017-2021 and Forecast 2022-2032, By Country

    12.1. Historical Market Size Value (US$ Mn) Trend Analysis By Market Taxonomy, 2017-2021

    12.2. Market Size Value (US$ Mn) Forecast By Market Taxonomy, 2022-2032

        12.2.1. By Country

            12.2.1.1. China

            12.2.1.2. Japan

            12.2.1.3. South Korea

            12.2.1.4. Rest of Asia Pacific

        12.2.2. By Drug Type

        12.2.3. By Route of Administration

        12.2.4. By Distribution Channel

    12.3. Market Attractiveness Analysis

        12.3.1. By Country

        12.3.2. By Drug Type

        12.3.3. By Route of Administration

        12.3.4. By Distribution Channel

    12.4. Key Takeaways

13. Middle East and Africa Paediatric Spasticity Treatment Market Analysis 2017-2021 and Forecast 2022-2032, By Country

    13.1. Historical Market Size Value (US$ Mn) Trend Analysis By Market Taxonomy, 2017-2021

    13.2. Market Size Value (US$ Mn) Forecast By Market Taxonomy, 2022-2032

        13.2.1. By Country

            13.2.1.1. GCC Countries

            13.2.1.2. South Africa

            13.2.1.3. Turkey

            13.2.1.4. Rest of Middle East and Africa

        13.2.2. By Drug Type

        13.2.3. By Route of Administration

        13.2.4. By Distribution Channel

    13.3. Market Attractiveness Analysis

        13.3.1. By Country

        13.3.2. By Drug Type

        13.3.3. By Route of Administration

        13.3.4. By Distribution Channel

    13.4. Key Takeaways

14. Key Countries Paediatric Spasticity Treatment Market Analysis

    14.1. U.S.

        14.1.1. Pricing Analysis

        14.1.2. Market Share Analysis, 2021

            14.1.2.1. By Drug Type

            14.1.2.2. By Route of Administration

            14.1.2.3. By Distribution Channel

    14.2. Canada

        14.2.1. Pricing Analysis

        14.2.2. Market Share Analysis, 2021

            14.2.2.1. By Drug Type

            14.2.2.2. By Route of Administration

            14.2.2.3. By Distribution Channel

    14.3. Brazil

        14.3.1. Pricing Analysis

        14.3.2. Market Share Analysis, 2021

            14.3.2.1. By Drug Type

            14.3.2.2. By Route of Administration

            14.3.2.3. By Distribution Channel

    14.4. Mexico

        14.4.1. Pricing Analysis

        14.4.2. Market Share Analysis, 2021

            14.4.2.1. By Drug Type

            14.4.2.2. By Route of Administration

            14.4.2.3. By Distribution Channel

    14.5. Germany

        14.5.1. Pricing Analysis

        14.5.2. Market Share Analysis, 2021

            14.5.2.1. By Drug Type

            14.5.2.2. By Route of Administration

            14.5.2.3. By Distribution Channel

    14.6. Italy

        14.6.1. Pricing Analysis

        14.6.2. Market Share Analysis, 2021

            14.6.2.1. By Drug Type

            14.6.2.2. By Route of Administration

            14.6.2.3. By Distribution Channel

    14.7. France

        14.7.1. Pricing Analysis

        14.7.2. Market Share Analysis, 2021

            14.7.2.1. By Drug Type

            14.7.2.2. By Route of Administration

            14.7.2.3. By Distribution Channel

    14.8. U.K.

        14.8.1. Pricing Analysis

        14.8.2. Market Share Analysis, 2021

            14.8.2.1. By Drug Type

            14.8.2.2. By Route of Administration

            14.8.2.3. By Distribution Channel

    14.9. Russia

        14.9.1. Pricing Analysis

        14.9.2. Market Share Analysis, 2021

            14.9.2.1. By Drug Type

            14.9.2.2. By Route of Administration

            14.9.2.3. By Distribution Channel

    14.10. BENELUX

        14.10.1. Pricing Analysis

        14.10.2. Market Share Analysis, 2021

            14.10.2.1. By Drug Type

            14.10.2.2. By Route of Administration

            14.10.2.3. By Distribution Channel

    14.11. China

        14.11.1. Pricing Analysis

        14.11.2. Market Share Analysis, 2021

            14.11.2.1. By Drug Type

            14.11.2.2. By Route of Administration

            14.11.2.3. By Distribution Channel

    14.12. Japan

        14.12.1. Pricing Analysis

        14.12.2. Market Share Analysis, 2021

            14.12.2.1. By Drug Type

            14.12.2.2. By Route of Administration

            14.12.2.3. By Distribution Channel

    14.13. South Korea

        14.13.1. Pricing Analysis

        14.13.2. Market Share Analysis, 2021

            14.13.2.1. By Drug Type

            14.13.2.2. By Route of Administration

            14.13.2.3. By Distribution Channel

    14.14. GCC Countries

        14.14.1. Pricing Analysis

        14.14.2. Market Share Analysis, 2021

            14.14.2.1. By Drug Type

            14.14.2.2. By Route of Administration

            14.14.2.3. By Distribution Channel

    14.15. South Africa

        14.15.1. Pricing Analysis

        14.15.2. Market Share Analysis, 2021

            14.15.2.1. By Drug Type

            14.15.2.2. By Route of Administration

            14.15.2.3. By Distribution Channel

    14.16. Turkey

        14.16.1. Pricing Analysis

        14.16.2. Market Share Analysis, 2021

            14.16.2.1. By Drug Type

            14.16.2.2. By Route of Administration

            14.16.2.3. By Distribution Channel

15. Market Structure Analysis

    15.1. Competition Dashboard

    15.2. Competition Benchmarking

    15.3. Market Share Analysis of Top Players

        15.3.1. By Regional

        15.3.2. By Drug Type

        15.3.3. By Route of Administration

        15.3.4. By Distribution Channel

16. Competition Analysis

    16.1. Competition Deep Dive

        16.1.1. Allergan plc

            16.1.1.1. Overview

            16.1.1.2. Product Portfolio

            16.1.1.3. Profitability by Market Segments

            16.1.1.4. Sales Footprint

            16.1.1.5. Strategy Overview

                16.1.1.5.1. Marketing Strategy

        16.1.2. Ipsen Biopharmaceuticals

            16.1.2.1. Overview

            16.1.2.2. Product Portfolio

            16.1.2.3. Profitability by Market Segments

            16.1.2.4. Sales Footprint

            16.1.2.5. Strategy Overview

                16.1.2.5.1. Marketing Strategy

        16.1.3. Almirall

            16.1.3.1. Overview

            16.1.3.2. Product Portfolio

            16.1.3.3. Profitability by Market Segments

            16.1.3.4. Sales Footprint

            16.1.3.5. Strategy Overview

                16.1.3.5.1. Marketing Strategy

        16.1.4. Piramal Critical Care

            16.1.4.1. Overview

            16.1.4.2. Product Portfolio

            16.1.4.3. Profitability by Market Segments

            16.1.4.4. Sales Footprint

            16.1.4.5. Strategy Overview

                16.1.4.5.1. Marketing Strategy

        16.1.5. Genentech

            16.1.5.1. Overview

            16.1.5.2. Product Portfolio

            16.1.5.3. Profitability by Market Segments

            16.1.5.4. Sales Footprint

            16.1.5.5. Strategy Overview

                16.1.5.5.1. Marketing Strategy

        16.1.6. Sanofi

            16.1.6.1. Overview

            16.1.6.2. Product Portfolio

            16.1.6.3. Profitability by Market Segments

            16.1.6.4. Sales Footprint

            16.1.6.5. Strategy Overview

                16.1.6.5.1. Marketing Strategy

        16.1.7. Saol Therapeutics

            16.1.7.1. Overview

            16.1.7.2. Product Portfolio

            16.1.7.3. Profitability by Market Segments

            16.1.7.4. Sales Footprint

            16.1.7.5. Strategy Overview

                16.1.7.5.1. Marketing Strategy

        16.1.8. US WorldMeds

            16.1.8.1. Overview

            16.1.8.2. Product Portfolio

            16.1.8.3. Profitability by Market Segments

            16.1.8.4. Sales Footprint

            16.1.8.5. Strategy Overview

                16.1.8.5.1. Marketing Strategy

17. Assumptions & Acronyms Used

18. Research Methodology

Don't pay for what you don't need

Customize your report by selecting specific countries or regions and save 30%!

List of Tables

Table 1: Global Paediatric Spasticity Treatment Market Value (US$ Mn) Forecast by Region, 2017-2032

Table 2: Global Paediatric Spasticity Treatment Market Value (US$ Mn) Forecast by Drug Type, 2017-2032

Table 3: Global Paediatric Spasticity Treatment Market Value (US$ Mn) Forecast by Route of Administration, 2017-2032

Table 4: Global Paediatric Spasticity Treatment Market Value (US$ Mn) Forecast by Distribution Channel, 2017-2032

Table 5: North America Paediatric Spasticity Treatment Market Value (US$ Mn) Forecast by Country, 2017-2032

Table 6: North America Paediatric Spasticity Treatment Market Value (US$ Mn) Forecast by Drug Type, 2017-2032

Table 7: North America Paediatric Spasticity Treatment Market Value (US$ Mn) Forecast by Route of Administration, 2017-2032

Table 8: North America Paediatric Spasticity Treatment Market Value (US$ Mn) Forecast by Distribution Channel, 2017-2032

Table 9: Latin America Paediatric Spasticity Treatment Market Value (US$ Mn) Forecast by Country, 2017-2032

Table 10: Latin America Paediatric Spasticity Treatment Market Value (US$ Mn) Forecast by Drug Type, 2017-2032

Table 11: Latin America Paediatric Spasticity Treatment Market Value (US$ Mn) Forecast by Route of Administration, 2017-2032

Table 12: Latin America Paediatric Spasticity Treatment Market Value (US$ Mn) Forecast by Distribution Channel, 2017-2032

Table 13: Europe Paediatric Spasticity Treatment Market Value (US$ Mn) Forecast by Country, 2017-2032

Table 14: Europe Paediatric Spasticity Treatment Market Value (US$ Mn) Forecast by Drug Type, 2017-2032

Table 15: Europe Paediatric Spasticity Treatment Market Value (US$ Mn) Forecast by Route of Administration, 2017-2032

Table 16: Europe Paediatric Spasticity Treatment Market Value (US$ Mn) Forecast by Distribution Channel, 2017-2032

Table 17: Asia Pacific Paediatric Spasticity Treatment Market Value (US$ Mn) Forecast by Country, 2017-2032

Table 18: Asia Pacific Paediatric Spasticity Treatment Market Value (US$ Mn) Forecast by Drug Type, 2017-2032

Table 19: Asia Pacific Paediatric Spasticity Treatment Market Value (US$ Mn) Forecast by Route of Administration, 2017-2032

Table 20: Asia Pacific Paediatric Spasticity Treatment Market Value (US$ Mn) Forecast by Distribution Channel, 2017-2032

Table 21: Middle East and Africa Paediatric Spasticity Treatment Market Value (US$ Mn) Forecast by Country, 2017-2032

Table 22: Middle East and Africa Paediatric Spasticity Treatment Market Value (US$ Mn) Forecast by Drug Type, 2017-2032

Table 23: Middle East and Africa Paediatric Spasticity Treatment Market Value (US$ Mn) Forecast by Route of Administration, 2017-2032

Table 24: Middle East and Africa Paediatric Spasticity Treatment Market Value (US$ Mn) Forecast by Distribution Channel, 2017-2032
Sabyasachi Ghosh
Sabyasachi Ghosh

Principal Consultant

Talk to Analyst

Find your sweet spots for generating winning opportunities in this market.

List of Charts

Figure 1: Global Paediatric Spasticity Treatment Market Value (US$ Mn) by Drug Type, 2022-2032

Figure 2: Global Paediatric Spasticity Treatment Market Value (US$ Mn) by Route of Administration, 2022-2032

Figure 3: Global Paediatric Spasticity Treatment Market Value (US$ Mn) by Distribution Channel, 2022-2032

Figure 4: Global Paediatric Spasticity Treatment Market Value (US$ Mn) by Region, 2022-2032

Figure 5: Global Paediatric Spasticity Treatment Market Value (US$ Mn) Analysis by Region, 2017-2032

Figure 6: Global Paediatric Spasticity Treatment Market Value Share (%) and BPS Analysis by Region, 2022-2032

Figure 7: Global Paediatric Spasticity Treatment Market Y-o-Y Growth (%) Projections by Region, 2022-2032

Figure 8: Global Paediatric Spasticity Treatment Market Value (US$ Mn) Analysis by Drug Type, 2017-2032

Figure 9: Global Paediatric Spasticity Treatment Market Value Share (%) and BPS Analysis by Drug Type, 2022-2032

Figure 10: Global Paediatric Spasticity Treatment Market Y-o-Y Growth (%) Projections by Drug Type, 2022-2032

Figure 11: Global Paediatric Spasticity Treatment Market Value (US$ Mn) Analysis by Route of Administration, 2017-2032

Figure 12: Global Paediatric Spasticity Treatment Market Value Share (%) and BPS Analysis by Route of Administration, 2022-2032

Figure 13: Global Paediatric Spasticity Treatment Market Y-o-Y Growth (%) Projections by Route of Administration, 2022-2032

Figure 14: Global Paediatric Spasticity Treatment Market Value (US$ Mn) Analysis by Distribution Channel, 2017-2032

Figure 15: Global Paediatric Spasticity Treatment Market Value Share (%) and BPS Analysis by Distribution Channel, 2022-2032

Figure 16: Global Paediatric Spasticity Treatment Market Y-o-Y Growth (%) Projections by Distribution Channel, 2022-2032

Figure 17: Global Paediatric Spasticity Treatment Market Attractiveness by Drug Type, 2022-2032

Figure 18: Global Paediatric Spasticity Treatment Market Attractiveness by Route of Administration, 2022-2032

Figure 19: Global Paediatric Spasticity Treatment Market Attractiveness by Distribution Channel, 2022-2032

Figure 20: Global Paediatric Spasticity Treatment Market Attractiveness by Region, 2022-2032

Figure 21: North America Paediatric Spasticity Treatment Market Value (US$ Mn) by Drug Type, 2022-2032

Figure 22: North America Paediatric Spasticity Treatment Market Value (US$ Mn) by Route of Administration, 2022-2032

Figure 23: North America Paediatric Spasticity Treatment Market Value (US$ Mn) by Distribution Channel, 2022-2032

Figure 24: North America Paediatric Spasticity Treatment Market Value (US$ Mn) by Country, 2022-2032

Figure 25: North America Paediatric Spasticity Treatment Market Value (US$ Mn) Analysis by Country, 2017-2032

Figure 26: North America Paediatric Spasticity Treatment Market Value Share (%) and BPS Analysis by Country, 2022-2032

Figure 27: North America Paediatric Spasticity Treatment Market Y-o-Y Growth (%) Projections by Country, 2022-2032

Figure 28: North America Paediatric Spasticity Treatment Market Value (US$ Mn) Analysis by Drug Type, 2017-2032

Figure 29: North America Paediatric Spasticity Treatment Market Value Share (%) and BPS Analysis by Drug Type, 2022-2032

Figure 30: North America Paediatric Spasticity Treatment Market Y-o-Y Growth (%) Projections by Drug Type, 2022-2032

Figure 31: North America Paediatric Spasticity Treatment Market Value (US$ Mn) Analysis by Route of Administration, 2017-2032

Figure 32: North America Paediatric Spasticity Treatment Market Value Share (%) and BPS Analysis by Route of Administration, 2022-2032

Figure 33: North America Paediatric Spasticity Treatment Market Y-o-Y Growth (%) Projections by Route of Administration, 2022-2032

Figure 34: North America Paediatric Spasticity Treatment Market Value (US$ Mn) Analysis by Distribution Channel, 2017-2032

Figure 35: North America Paediatric Spasticity Treatment Market Value Share (%) and BPS Analysis by Distribution Channel, 2022-2032

Figure 36: North America Paediatric Spasticity Treatment Market Y-o-Y Growth (%) Projections by Distribution Channel, 2022-2032

Figure 37: North America Paediatric Spasticity Treatment Market Attractiveness by Drug Type, 2022-2032

Figure 38: North America Paediatric Spasticity Treatment Market Attractiveness by Route of Administration, 2022-2032

Figure 39: North America Paediatric Spasticity Treatment Market Attractiveness by Distribution Channel, 2022-2032

Figure 40: North America Paediatric Spasticity Treatment Market Attractiveness by Country, 2022-2032

Figure 41: Latin America Paediatric Spasticity Treatment Market Value (US$ Mn) by Drug Type, 2022-2032

Figure 42: Latin America Paediatric Spasticity Treatment Market Value (US$ Mn) by Route of Administration, 2022-2032

Figure 43: Latin America Paediatric Spasticity Treatment Market Value (US$ Mn) by Distribution Channel, 2022-2032

Figure 44: Latin America Paediatric Spasticity Treatment Market Value (US$ Mn) by Country, 2022-2032

Figure 45: Latin America Paediatric Spasticity Treatment Market Value (US$ Mn) Analysis by Country, 2017-2032

Figure 46: Latin America Paediatric Spasticity Treatment Market Value Share (%) and BPS Analysis by Country, 2022-2032

Figure 47: Latin America Paediatric Spasticity Treatment Market Y-o-Y Growth (%) Projections by Country, 2022-2032

Figure 48: Latin America Paediatric Spasticity Treatment Market Value (US$ Mn) Analysis by Drug Type, 2017-2032

Figure 49: Latin America Paediatric Spasticity Treatment Market Value Share (%) and BPS Analysis by Drug Type, 2022-2032

Figure 50: Latin America Paediatric Spasticity Treatment Market Y-o-Y Growth (%) Projections by Drug Type, 2022-2032

Figure 51: Latin America Paediatric Spasticity Treatment Market Value (US$ Mn) Analysis by Route of Administration, 2017-2032

Figure 52: Latin America Paediatric Spasticity Treatment Market Value Share (%) and BPS Analysis by Route of Administration, 2022-2032

Figure 53: Latin America Paediatric Spasticity Treatment Market Y-o-Y Growth (%) Projections by Route of Administration, 2022-2032

Figure 54: Latin America Paediatric Spasticity Treatment Market Value (US$ Mn) Analysis by Distribution Channel, 2017-2032

Figure 55: Latin America Paediatric Spasticity Treatment Market Value Share (%) and BPS Analysis by Distribution Channel, 2022-2032

Figure 56: Latin America Paediatric Spasticity Treatment Market Y-o-Y Growth (%) Projections by Distribution Channel, 2022-2032

Figure 57: Latin America Paediatric Spasticity Treatment Market Attractiveness by Drug Type, 2022-2032

Figure 58: Latin America Paediatric Spasticity Treatment Market Attractiveness by Route of Administration, 2022-2032

Figure 59: Latin America Paediatric Spasticity Treatment Market Attractiveness by Distribution Channel, 2022-2032

Figure 60: Latin America Paediatric Spasticity Treatment Market Attractiveness by Country, 2022-2032

Figure 61: Europe Paediatric Spasticity Treatment Market Value (US$ Mn) by Drug Type, 2022-2032

Figure 62: Europe Paediatric Spasticity Treatment Market Value (US$ Mn) by Route of Administration, 2022-2032

Figure 63: Europe Paediatric Spasticity Treatment Market Value (US$ Mn) by Distribution Channel, 2022-2032

Figure 64: Europe Paediatric Spasticity Treatment Market Value (US$ Mn) by Country, 2022-2032

Figure 65: Europe Paediatric Spasticity Treatment Market Value (US$ Mn) Analysis by Country, 2017-2032

Figure 66: Europe Paediatric Spasticity Treatment Market Value Share (%) and BPS Analysis by Country, 2022-2032

Figure 67: Europe Paediatric Spasticity Treatment Market Y-o-Y Growth (%) Projections by Country, 2022-2032

Figure 68: Europe Paediatric Spasticity Treatment Market Value (US$ Mn) Analysis by Drug Type, 2017-2032

Figure 69: Europe Paediatric Spasticity Treatment Market Value Share (%) and BPS Analysis by Drug Type, 2022-2032

Figure 70: Europe Paediatric Spasticity Treatment Market Y-o-Y Growth (%) Projections by Drug Type, 2022-2032

Figure 71: Europe Paediatric Spasticity Treatment Market Value (US$ Mn) Analysis by Route of Administration, 2017-2032

Figure 72: Europe Paediatric Spasticity Treatment Market Value Share (%) and BPS Analysis by Route of Administration, 2022-2032

Figure 73: Europe Paediatric Spasticity Treatment Market Y-o-Y Growth (%) Projections by Route of Administration, 2022-2032

Figure 74: Europe Paediatric Spasticity Treatment Market Value (US$ Mn) Analysis by Distribution Channel, 2017-2032

Figure 75: Europe Paediatric Spasticity Treatment Market Value Share (%) and BPS Analysis by Distribution Channel, 2022-2032

Figure 76: Europe Paediatric Spasticity Treatment Market Y-o-Y Growth (%) Projections by Distribution Channel, 2022-2032

Figure 77: Europe Paediatric Spasticity Treatment Market Attractiveness by Drug Type, 2022-2032

Figure 78: Europe Paediatric Spasticity Treatment Market Attractiveness by Route of Administration, 2022-2032

Figure 79: Europe Paediatric Spasticity Treatment Market Attractiveness by Distribution Channel, 2022-2032

Figure 80: Europe Paediatric Spasticity Treatment Market Attractiveness by Country, 2022-2032

Figure 81: Asia Pacific Paediatric Spasticity Treatment Market Value (US$ Mn) by Drug Type, 2022-2032

Figure 82: Asia Pacific Paediatric Spasticity Treatment Market Value (US$ Mn) by Route of Administration, 2022-2032

Figure 83: Asia Pacific Paediatric Spasticity Treatment Market Value (US$ Mn) by Distribution Channel, 2022-2032

Figure 84: Asia Pacific Paediatric Spasticity Treatment Market Value (US$ Mn) by Country, 2022-2032

Figure 85: Asia Pacific Paediatric Spasticity Treatment Market Value (US$ Mn) Analysis by Country, 2017-2032

Figure 86: Asia Pacific Paediatric Spasticity Treatment Market Value Share (%) and BPS Analysis by Country, 2022-2032

Figure 87: Asia Pacific Paediatric Spasticity Treatment Market Y-o-Y Growth (%) Projections by Country, 2022-2032

Figure 88: Asia Pacific Paediatric Spasticity Treatment Market Value (US$ Mn) Analysis by Drug Type, 2017-2032

Figure 89: Asia Pacific Paediatric Spasticity Treatment Market Value Share (%) and BPS Analysis by Drug Type, 2022-2032

Figure 90: Asia Pacific Paediatric Spasticity Treatment Market Y-o-Y Growth (%) Projections by Drug Type, 2022-2032

Figure 91: Asia Pacific Paediatric Spasticity Treatment Market Value (US$ Mn) Analysis by Route of Administration, 2017-2032

Figure 92: Asia Pacific Paediatric Spasticity Treatment Market Value Share (%) and BPS Analysis by Route of Administration, 2022-2032

Figure 93: Asia Pacific Paediatric Spasticity Treatment Market Y-o-Y Growth (%) Projections by Route of Administration, 2022-2032

Figure 94: Asia Pacific Paediatric Spasticity Treatment Market Value (US$ Mn) Analysis by Distribution Channel, 2017-2032

Figure 95: Asia Pacific Paediatric Spasticity Treatment Market Value Share (%) and BPS Analysis by Distribution Channel, 2022-2032

Figure 96: Asia Pacific Paediatric Spasticity Treatment Market Y-o-Y Growth (%) Projections by Distribution Channel, 2022-2032

Figure 97: Asia Pacific Paediatric Spasticity Treatment Market Attractiveness by Drug Type, 2022-2032

Figure 98: Asia Pacific Paediatric Spasticity Treatment Market Attractiveness by Route of Administration, 2022-2032

Figure 99: Asia Pacific Paediatric Spasticity Treatment Market Attractiveness by Distribution Channel, 2022-2032

Figure 100: Asia Pacific Paediatric Spasticity Treatment Market Attractiveness by Country, 2022-2032

Figure 101: Middle East and Africa Paediatric Spasticity Treatment Market Value (US$ Mn) by Drug Type, 2022-2032

Figure 102: Middle East and Africa Paediatric Spasticity Treatment Market Value (US$ Mn) by Route of Administration, 2022-2032

Figure 103: Middle East and Africa Paediatric Spasticity Treatment Market Value (US$ Mn) by Distribution Channel, 2022-2032

Figure 104: Middle East and Africa Paediatric Spasticity Treatment Market Value (US$ Mn) by Country, 2022-2032

Figure 105: Middle East and Africa Paediatric Spasticity Treatment Market Value (US$ Mn) Analysis by Country, 2017-2032

Figure 106: Middle East and Africa Paediatric Spasticity Treatment Market Value Share (%) and BPS Analysis by Country, 2022-2032

Figure 107: Middle East and Africa Paediatric Spasticity Treatment Market Y-o-Y Growth (%) Projections by Country, 2022-2032

Figure 108: Middle East and Africa Paediatric Spasticity Treatment Market Value (US$ Mn) Analysis by Drug Type, 2017-2032

Figure 109: Middle East and Africa Paediatric Spasticity Treatment Market Value Share (%) and BPS Analysis by Drug Type, 2022-2032

Figure 110: Middle East and Africa Paediatric Spasticity Treatment Market Y-o-Y Growth (%) Projections by Drug Type, 2022-2032

Figure 111: Middle East and Africa Paediatric Spasticity Treatment Market Value (US$ Mn) Analysis by Route of Administration, 2017-2032

Figure 112: Middle East and Africa Paediatric Spasticity Treatment Market Value Share (%) and BPS Analysis by Route of Administration, 2022-2032

Figure 113: Middle East and Africa Paediatric Spasticity Treatment Market Y-o-Y Growth (%) Projections by Route of Administration, 2022-2032

Figure 114: Middle East and Africa Paediatric Spasticity Treatment Market Value (US$ Mn) Analysis by Distribution Channel, 2017-2032

Figure 115: Middle East and Africa Paediatric Spasticity Treatment Market Value Share (%) and BPS Analysis by Distribution Channel, 2022-2032

Figure 116: Middle East and Africa Paediatric Spasticity Treatment Market Y-o-Y Growth (%) Projections by Distribution Channel, 2022-2032

Figure 117: Middle East and Africa Paediatric Spasticity Treatment Market Attractiveness by Drug Type, 2022-2032

Figure 118: Middle East and Africa Paediatric Spasticity Treatment Market Attractiveness by Route of Administration, 2022-2032

Figure 119: Middle East and Africa Paediatric Spasticity Treatment Market Attractiveness by Distribution Channel, 2022-2032

Figure 120: Middle East and Africa Paediatric Spasticity Treatment Market Attractiveness by Country, 2022-2032

Recommendations

Healthcare

Paediatric Vaccine Market

Published : September 2023

Healthcare

Pediatric Respiratory Syncytial Virus Infection Market

Published : January 2023

Explore Healthcare Insights

View Reports

Paediatric Spasticity Treatment Market