Spasticity Treatment Market Size and Share Forecast Outlook (2023 to 2033)

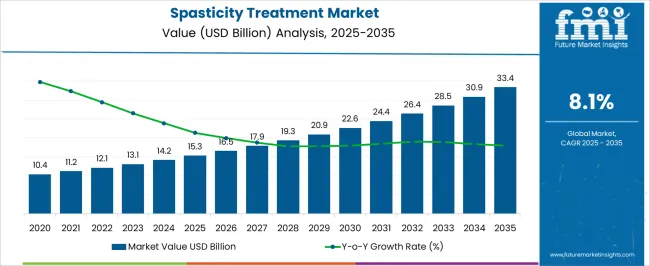
According to Future Market Insights (FMI) analysis in a recent market survey, the global spasticity treatment market was valued at USD 12.2 Billion in 2022 and is set to reach USD 28.4 Billion by 2033.

Market Outlook:

Data Points Market Insights
Market Value 2022 USD 12.2 Billion
Market Value 2023 USD 13.1 Billion
Market Value 2033 USD 28.4 Billion
CAGR 2023 to 2033 8.1%
Share of Top 5 Countries 54.0%
Key Players Medtronic Plc; Piramal Enterprises Ltd.; AbbVie, Inc. (Allergan); Ipsen Pharma; F. Hoffmann-La Roche Ltd; GlaxoSmithKline plc; Pfizer Inc.; Elite Pharmaceuticals Inc.; Orient Pharma; Acorda Therapeutics, Inc.; Sun Pharmaceutical Industries Ltd; Novartis AG (Alcon); Teva Pharmaceutical Industries Ltd; Zydus Cadila Healthcare Ltd.; Beximco Pharmaceuticals Ltd; Merz Pharma; Thought Technology Ltd.; UltraCare PRO; Invacare Corporation; ATI Physical Therapy; P.T. Services Rehabilitation, Inc.; Banner Health.

Spasticity is one of many clinical traits or motor behavior that can appear following injury to the area of the brain or spinal cord that regulates voluntary movements. Upper motor neuron syndrome is the term used to describe these symptoms taken together.

One of the key factors promoting the growth of the spasticity treatment market is the rising prevalence of neuro-musculoskeletal disorders. Spasticity is becoming more common as chronic neuro-musculoskeletal illnesses become more common on a global scale.

  • For instance, the multiple sclerosis Trust estimates that in 2020, there were around 2.5 million multiple sclerosis patients worldwide. External factors that harm the spinal cord or the brain directly contribute to spinal cord injury and traumatic brain injury, respectively.

The high prevalence of these illnesses worldwide is a result of an increase in slips, accidents, assaults, and other incidents. A diagnosis of spasticity was made in more than 50% to 60% of these cases. The global market thus benefits from the rising prevalence of various chronic disorders due to the close association between the aforementioned chronic conditions and spasticity. This rising incidence will drive market expansion over the forecast period.

Overall, the adoption of spasticity treatment in healthcare facilities, which will boost the market in the coming years.

2012 to 2022 Spasticity Treatment Sales Vs Forecast for 2023 to 2033

Sales of the global market grew at a CAGR of 5.4% between 2012 and 2022. Spasticity treatment market contributes 29.6% revenue share to the global neurodegenerative disease treatment market value at USD 41.2 Billion in 2022.

The ageing population is one of the primary factors fueling the market for spasticity treatments.

  • According to projections from the World Health Organization (WHO), the number of people in the world who are 60 years of age or older is expected to increase from 1 billion in 2020 to 1.4 billion by 2050. By 2050, there will be twice as many people in the world who are 60 years or older (2.1 billion), compared to 2020.

Age-related changes in the brain, traumas like stroke or traumatic brain damage, addiction, and diseases like multiple sclerosis (MS), stroke, and brain tumours, among others, can all have a substantial impact on brain health, which will increase the prevalence of spasticity and its related indications, which will boost the market for spasticity treatments.

Advanced procurement operations provide businesses and manufacturers with chances to develop and expand their clientele to buyers and suppliers that collaborate to create cutting-edge products that increase sales and profits for all parties. By implementing several techniques into their processes, they adopt an integrated approach to creating new goods and procedures.

Different key strategies such as new product launches, acquisitions, collaborations, and expansion are being used by companies and different manufacturers for the advancement and development of new products and therapies.

  • For instance, In August 2020, Teva Pharmaceuticals & Biopharmaceutical Company Alvotech collaborated to expand their sales in the USA.
  • Ipsen and Accent Therapeutics (Accent) signed an exclusive global collaboration agreement to conduct research, develop, produce, and market the products on October 18, 2021.

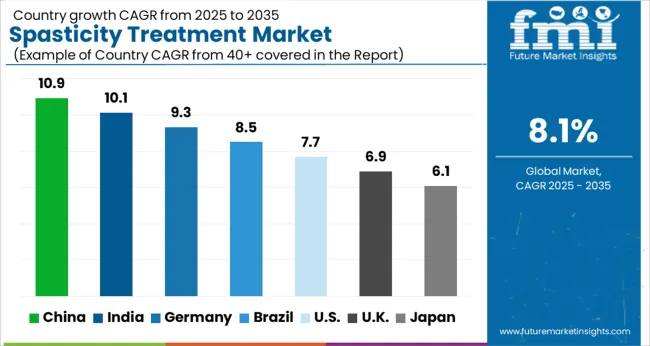
Considering this, FMI expects the global market to grow at a CAGR of 8.1% through the forecasted years.

Key Opportunities for Spasticity Treatment Providers

Cognitive knowledge and evaluation of everyday things and issues is one of the most important indicators of a person's mental health and ability to think and act in life-or-death situations.

The brain is a sophisticated organ that has a significant impact on one's overall health and well-being. Brain health can be significantly impacted by ageing-related changes in the brain and traumas like stroke or traumatic brain injury. While certain factors that affect brain health cannot be avoided, there are other lifestyle changes that can be beneficial.

Since they improve brain glucose metabolism and reduce the risk of mental disorders, improved brain and mental fitness is becoming more and more in demand, opening up new treatment options for spasticity.

Increased testing of combination therapies in patients will pave the way for new drug discoveries and treatment options, ultimately leading to the introduction of new products into the market.

Potential Restraints Impacting Spasticity Treatment Demand

For the spasticity treatment process, there is a requirement of skilled specialists such as physiatrists, neurologists, rehabilitation nurses, physical and occupational therapists, speech and language pathologists, psychologists, social workers, recreational therapists, etc.

The non-availability and limited number of such well-trained specialists can have an adverse impact on the treatment of patients with spasticity and also lower the growth of the organizations that are involved in the treatment. Due to these factors, the quality of services can get affected, and this will ultimately have a negative impact on the growth of the spasticity treatment market.

The dearth of skilled professionals in these fields can lower the quality of services offered, ultimately affecting the growth of the spasticity treatment market.

These factors are expected to hamper revenue growth of the global market over the forecast period.
Country-Wise Insights into the Spasticity Treatment Landscape

What Makes the USA Dominate the Global Market?

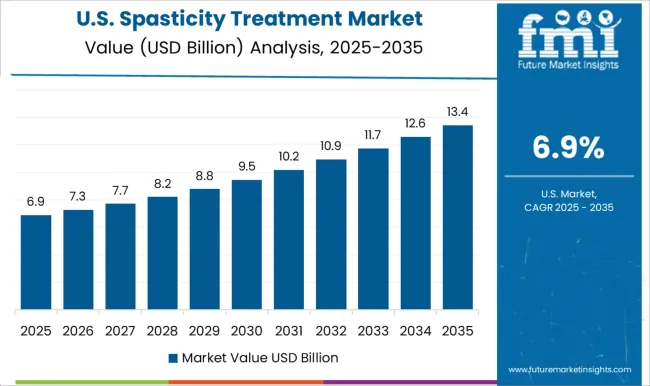
The USA market dominated the global market with value of around USD 3.63 Bilion in 2022 and is expected to register a CAGR of 8.3% during the forecast period.

The high prevalence of spasticity in the United States will accelerate the acceptance of various treatment alternatives.

  • According to the MERZ PHARMACEUTICALS, Spasticity is estimated to affect more than 12 million people worldwide and approximately 50,000 persons in the United States yearly. 38% of stroke survivors develop spasticity within a year of their initial stroke, while the prevalence of post-stroke spasticity overall (the percentage of people who experience it in the general population) is roughly 0.2%.

Due to the high prevalence, more treatments, including over-the-counter products, will experience a high adoption rate among patients. The demand for spasticity treatment will increase due to high prevalence, which will drive the expansion of the market.
Why is Germany considered to be a Lucrative Region for Spasticity Treatment Market in Europe?

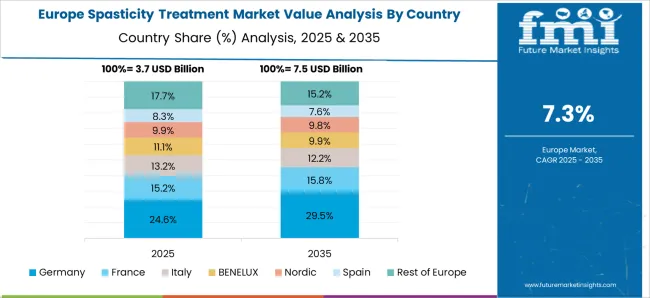
Germany dominated the European market for spasticity treatment and accounted for around 22.3% of the regional market share in 2022.

Increasing technological advancements in spasticity treatment therapies in Germany is driving the overall Europe spasticity treatment market.

Virtual reality technology can be used to provide immersive therapy experiences for patients with spasticity. These experiences can help patients to improve their motor skills and reduce spasticity through interactive and engaging activities. This therapy has been found to be effective in reducing spasticity in patients with cerebral palsy, multiple sclerosis, and other neurological conditions.

The safe and successful spasticity treatment therapies in Germany will influence other European countries to also opt for this treatment method, ultimately expanding the overall market.

What Makes China an Emerging Market for Spasticity Treatment?

China is projected to be the most attractive market in the East Asia region, and is expected to grow over a significant CAGR of 7.7% during the forecast duration.

The spasticity treatment market in China is expected to grow significantly in the coming years due to several factors.

One of the main factors driving the growth of the spasticity treatment market in China is the increasing awareness of the condition among the general public and healthcare professionals. As more people become aware of the condition, they are more likely to seek treatment, which is leading to increased demand for treatments for spasticity.

Another factor contributing to the growth of the spasticity treatment market in China is the increasing availability of advanced medical technologies and treatments. China has made significant investments in its healthcare infrastructure, and many new hospitals and clinics have been built in recent years. This has allowed for the introduction of advanced treatments such as botox injections and surgery, which were not widely available in the past.

Category-Wise Insights into Spasticity Management Solutions

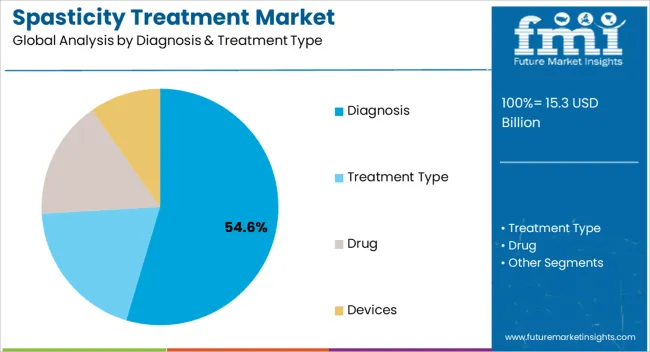
Why Treatment type Is Largely Adopted for Spasticity?

The treatment segment utilizing drugs, physical therapy, Botulinum toxin, surgical treatment and others treatment options held the major chunk of about 68.4% in global market by the end of 2022.

With advances in medical technology, it has become easier to diagnose spasticity accurately. This has led to more people being diagnosed with the condition, which in turn has increased the demand for treatment. There is now more awareness about spasticity among healthcare providers, patients, and the general public. This has helped to reduce the stigma associated with the condition and encouraged more people to seek treatment.

There have been significant advances in the development of new treatments for spasticity, including medications, physical therapy, and surgical procedures. These treatments can help to reduce spasticity and improve overall quality of life for people with the condition.

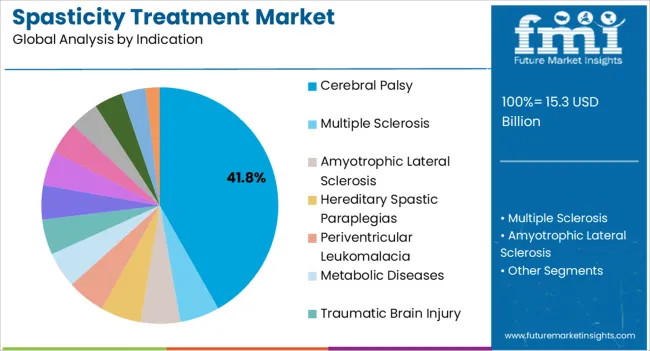
Why Cerebral Palsy Is Dominating Indication for Spasticity?

The Cerebral Palsy segment held the major chunk of about 14.4% in global market by the end of 2022.

Increased awareness of cerebral palsy and improved diagnostic techniques have led to more accurate diagnosis and reporting of cases, contributing to the observed increase in prevalence. Certain risk factors, such as maternal infections during pregnancy, prematurity, and low birth weight, have become more common in recent years. This has contributed to the increase in the incidence of cerebral palsy and spasticity.

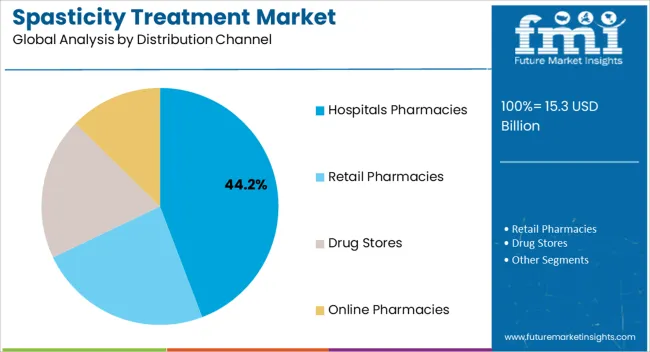
Which Distribution Channel Dominates the Global Market in 2022?

The hospital pharmacies segment accounted for revenue share of 38.3% in the global market at the end of 2022.

Hospital pharmacies offer convenient access to treatment options, with many providing over-the-counter and prescription medications for a range of conditions, including cerebral palsy, multiple sclerosis among others. Patients can typically purchase these treatments without an appointment, making it more convenient for them to manage their condition.

Overall, hospital pharmacies offers a convenient and accessible distribution channel for spasticity treating products, making it the largest channel for these treatments.

Which Service Providers Dominates the Global Market in 2022?

The hospitals segment accounted for revenue share of 37.1% in the global market at the end of 2022.

Hospitals typically have access to a wide range of specialized medical professionals, including neurologists, physiatrists, orthopedic surgeons, and physical therapists, who can collaborate to provide comprehensive spasticity treatment.

Overall, hospitals are a leading segment for spasticity treatment because they provide access to specialized medical professionals, advanced diagnostic tools, multimodal treatments, specialized equipment and facilities, and both inpatient and outpatient services.
Competitive Landscape of the Spasticity Treatment Market

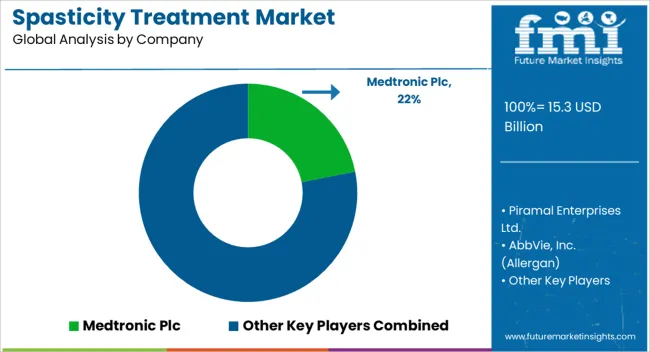
Key players in the market are focused on increase their product portfolio to strengthen their position in the spasticity treatment market, and also to expand their footprint in emerging markets. The key strategy adopted by manufacturers to gain competitive edge in the market are the pricing strategies, market strategies, technological advancements, regulatory compliance and acquisition of other companies to expand their business.

For instance:

  • In August 2022, Medtronic completed the acquisition of Affera. This acquisition gave Medtronic access to Affera's Prism-1™ cardiac mapping and navigation platform, which is compatible with Medtronic's therapeutic catheters as well as a number of competing technologies.
  • In January 2020, Botox manufacturer Allergan received regulatory approval to use the drug to treat young patients with upper limb spasticity.

Similarly, recent developments have been tracked by the team at Future Market Insights related to companies in the spasticity treatment market space, which are available in the full report

Scope of the Spasticity Treatment Industry Report

Attribute Details
Forecast Period 2023 to 2033
Historical Data Available for 2012 to 2022
Market Analysis USD Million for Value
Key Regions Covered North America; Latin America; Europe; South Asia; East Asia; Oceania; Middle East and Africa (MEA)
Key Countries Covered USA, Canada, Brazil, Mexico, Argentina, Germany, United Kingdom, France, Italy, Spain, Russia, BENELUX, Nordics, India, Thailand, Indonesia, Malaysia, Philippines, Vietnam, China, Japan, South Korea, Australia, New Zealand, Türkiye, South Africa, North Africa and GCC Countries
Key Segments Covered Diagnosis & Treatment Type, Indication, Distribution Channel, Service Providers, and Region
Key Companies Profiled Medtronic Plc; Piramal Enterprises Ltd.; AbbVie, Inc. (Allergan); Ipsen Pharma; F. Hoffmann-La Roche Ltd; GlaxoSmithKline plc; Pfizer Inc.; Elite Pharmaceuticals Inc.; Orient Pharma; Acorda Therapeutics, Inc.; Sun Pharmaceutical Industries Ltd; Novartis AG (Alcon); Teva Pharmaceutical Industries Ltd; Zydus Cadila Healthcare Ltd.; Beximco Pharmaceuticals Ltd; Merz Pharma; Thought Technology Ltd.; UltraCare PRO; Invacare Corporation; ATI Physical Therapy; P.T. Services Rehabilitation, Inc.; Banner Health
Report Coverage Market Forecast, Competition Intelligence, DROT Analysis, Market Dynamics and Challenges, Strategic Growth Initiatives
Customization & Pricing Available upon Request

Key Segments Covered in Spasticity Treatment Industry Research

By Diagnosis & Treatment Type:

  • Diagnosis
    • Inpatient
    • Outpatient
  • Treatment Type
    • Drug
      • Baclofen
      • Tizanidine
      • Dantrolene sodium
      • Diazepam
      • Clonazepam
      • Gabapentin
    • Physical Therapy
    • Botulinum injection
    • Surgery Treatment
    • Other Treatment
  • Devices
    • Reciprocal EMG-Triggered Stimulation
    • Transcutaneous Electrical Nerve Stimulation
    • Bracing and Cuff
    • Leg lifter
    • Cane and Crunches
    • Wheelchair
    • Others

By Indication:

  • Cerebral Palsy
  • Multiple Sclerosis
  • Amyotrophic Lateral Sclerosis
  • Hereditary Spastic Paraplegias
  • Periventricular Leukomalacia
  • Metabolic Diseases
  • Traumatic Brain Injury
  • Spinal Cord Injury
  • Stroke
  • Multiple System Atrophy
  • Stiff-Person Syndrome
  • Infectious Transvers Myelitis
  • Encephalopathy
  • Brain Tumor
  • Krabbe Disease
  • Johns Hopkins Disease

By Distribution Channel:

  • Hospitals Pharmacies
  • Retail Pharmacies
  • Drug Stores
  • Online Pharmacies

By Service Providers:

  • Hospitals
  • Ambulatory Surgical Centers
  • Home Care Settings
  • Specialty Clinics
  • Diagnostic Centers

By Region:

  • North America
  • Latin America
  • Europe
  • South Asia
  • East Asia
  • Oceania
  • Middle East and Africa (MEA)

Table of Content

  • 1. Global Market - Executive Summary 
  • 2. Market Overview
  • 3. Key Market Trends
  • 4. Value Added Insights
  • 5. Market Background
  • 6. Global Market Demand (in Value USD Million) Analysis 2012 to 2022 and Forecast, 2023 to 2033
  • 7. Global Market Analysis 2012 to 2022 and Forecast 2023 to 2033, by Diagnosis & Treatment Type
    • 7.1. Diagnosis
      • 7.1.1. Inpatient
      • 7.1.2. Outpatient
    • 7.2. Treatment Type
      • 7.2.1. Drug
        • 7.2.1.1. Baclofen
        • 7.2.1.2. Tizanidine
        • 7.2.1.3. Dantrolene sodium
        • 7.2.1.4. Diazepam
        • 7.2.1.5. Clonazepam
        • 7.2.1.6. Gabapentin
        • 7.2.1.7. Others
      • 7.2.2. Physical Therapy
      • 7.2.3. Botulinum injection
      • 7.2.4. Surgery Treatment
      • 7.2.5. Other Treatment
    • 7.3. Devices
      • 7.3.1. Reciprocal EMG-Triggered Stimulation
      • 7.3.2. Transcutaneous Electrical Nerve Stimulation
      • 7.3.3. Bracing and Cuff
      • 7.3.4. Leg Lifter
      • 7.3.5. Cane and Crutches
      • 7.3.6. Wheelchair
      • 7.3.7. Others
  • 8. Global Market Analysis 2012 to 2022 and Forecast 2023 to 2033, by Indication
    • 8.1. Cerebral Palsy
    • 8.2. Multiple Sclerosis
    • 8.3. Amyotrophic Lateral Sclerosis
    • 8.4. Hereditary Spastic Paraplegias
    • 8.5. Periventricular Leukomalacia
    • 8.6. Metabolic Diseases
    • 8.7. Traumatic Brain Injury
    • 8.8. Spinal Cord Injury
    • 8.9. Stroke
    • 8.10. Multiple System Atrophy
    • 8.11. Stiff-Person Syndrome
    • 8.12. Infectious Transverse Myelitis
    • 8.13. Encephalopathy
    • 8.14. Brain Tumor
    • 8.15. Krabbe Disease
    • 8.16. Multiple System Atrophy
    • 8.17. Johns Hopkins Disease
  • 9. Global Market Analysis 2012 to 2022 and Forecast 2023 to 2033, By Distribution Channel
    • 9.1. Hospital Pharmacies
    • 9.2. Retail Pharmacies
    • 9.3. Drug Stores
    • 9.4. Online Pharmacies
  • 10. Global Market Analysis 2012 to 2022 and Forecast 2023 to 2033, By Service Providers
    • 10.1. Hospitals
    • 10.2. Ambulatory Surgical Centers
    • 10.3. Home Care Settings
    • 10.4. Specialty Clinics
    • 10.5. Diagnostic Centers
  • 11. Global Market Analysis 2012 to 2022 and Forecast 2023 to 2033, by Region
    • 11.1. North America
    • 11.2. Latin America
    • 11.3. Europe
    • 11.4. South Asia
    • 11.5. East Asia
    • 11.6. Oceania
    • 11.7. Middle East & Africa (MEA)
  • 12. North America Market Analysis 2012 to 2022 and Forecast 2023 to 2033
  • 13. Latin America Market Analysis 2012 to 2022 and Forecast 2023 to 2033
  • 14. Europe Market Analysis 2012 to 2022 and Forecast 2023 to 2033
  • 15. South Asia Market Analysis 2012 to 2022 and Forecast 2023 to 2033
  • 16. East Asia Market Analysis 2012 to 2022 and Forecast 2023 to 2033
  • 17. Oceania Market Analysis 2012 to 2022 and Forecast 2023 to 2033
  • 18. Middle East & Africa Market Analysis 2012 to 2022 and Forecast 2023 to 2033
  • 19. Competition Analysis
    • 19.1. Medtronic Plc
    • 19.2. Piramal Enterprises Ltd.
    • 19.3. AbbVie, Inc. (Allergan)
    • 19.4. Ipsen Pharma
    • 19.5. F. Hoffmann-La Roche Ltd.
    • 19.6. GlaxoSmithKline plc
    • 19.7. Pfizer Inc.
    • 19.8. Elite Pharmaceuticals Inc.
    • 19.9. Orient Pharma
    • 19.10. Acorda Therapeutics, Inc.
    • 19.11. Sun Pharmaceutical Industries Ltd.
    • 19.12. Novartis AG (Alcon)
    • 19.13. Teva Pharmaceutical Industries Ltd.
    • 19.14. Zydus Cadila Healthcare Ltd.
    • 19.15. Beximco Pharmaceuticals Ltd.
    • 19.16. Merz Pharma
    • 19.17. Thought Technology Ltd.
    • 19.18. UltraCare PRO
    • 19.19. Invacare Corporation
    • 19.20. ATI Physical Therapy
    • 19.21. P.T. Services Rehabilitation, Inc.
    • 19.22. Banner Health
  • 20. Assumptions and Acronyms Used
  • 21. Research Methodology

List of Tables

Table 01: Global Market Size (US$ Million) Analysis 2012 to 2022 and Forecast 2023 to 2033, By Diagnosis & Treatment Type

Table 02: Global Market Size (US$ Million) Analysis 2012 to 2022 and Forecast 2023 to 2033, By Diagnosis & Treatment Type

Table 03: Global Market Size (US$ Million) Analysis 2012 to 2022 and Forecast 2023 to 2033, By Diagnosis & Treatment Type

Table 04: Global Market Size (US$ Million) Analysis 2012 to 2022 and Forecast 2023 to 2033, By Diagnosis & Treatment Type

Table 05: Global Market Size (US$ Million) Analysis 2012 to 2022 and Forecast 2023 to 2033, By Indication

Table 06: Global Market Size (US$ Million) Analysis 2012 to 2022 and Forecast 2023 to 2033, By Indication

Table 07: Global Market Size (US$ Million) Analysis 2012 to 2022 and Forecast 2023 to 2033, By Distribution Channel

Table 08: Global Market Size (US$ Million) Analysis 2012 to 2022 and Forecast 2023 to 2033, By Distribution Channel

Table 09: Global Market Size (US$ Million) Analysis 2012 to 2022 and Forecast 2023 to 2033, By Service Provider

Table 10: Global Market Size (US$ Million) Analysis 2012 to 2022 and Forecast 2023 to 2033, By Service Provider

Table 11: Global Market Size (US$ Million) Analysis 2012 to 2022 and Forecast 2023 to 2033, By Region

Table 12: Global Market Size (US$ Million) Analysis 2012 to 2022 and Forecast 2023 to 2033, By Region

Table 13: North America Market Size (US$ Million) Analysis 2012 to 2022 and Forecast 2023 to 2033, By Country

Table 14: North America Market Size (US$ Million) Analysis 2012 to 2022 and Forecast 2023 to 2033, By Country

Table 15: North America Market Size (US$ Million) Analysis 2012 to 2022 and Forecast 2023 to 2033, By Diagnosis & Treatment Type

Table 16: North America Market Size (US$ Million) Analysis 2012 to 2022 and Forecast 2023 to 2033, By Diagnosis & Treatment Type

Table 17: North America Market Size (US$ Million) Analysis 2012 to 2022 and Forecast 2023 to 2033, By Diagnosis & Treatment Type

Table 18: North America Market Size (US$ Million) Analysis 2012 to 2022 and Forecast 2023 to 2033, By Diagnosis & Treatment Type

Table 19: North America Market Size (US$ Million) Analysis 2012 to 2022 and Forecast 2023 to 2033, By Indication

Table 20: North America Market Size (US$ Million) Analysis 2012 to 2022 and Forecast 2023 to 2033, By Indication

Table 21: North America Market Size (US$ Million) Analysis 2012 to 2022 and Forecast 2023 to 2033, By Distribution Channel

Table 22: North America Market Size (US$ Million) Analysis 2012 to 2022 and Forecast 2023 to 2033, By Distribution Channel

Table 23: North America Market Size (US$ Million) Analysis 2012 to 2022 and Forecast 2023 to 2033, By Service Provider

Table 24: North America Market Size (US$ Million) Analysis 2012 to 2022 and Forecast 2023 to 2033, By Service Provider

Table 25: Latin America Market Size (US$ Million) Analysis 2012 to 2022 and Forecast 2023 to 2033, By Country

Table 26: Latin America Market Size (US$ Million) Analysis 2012 to 2022 and Forecast 2023 to 2033, By Country

Table 27: Latin America Market Size (US$ Million) Analysis 2012 to 2022 and Forecast 2023 to 2033, By Diagnosis & Treatment Type

Table 28: Latin America Market Size (US$ Million) Analysis 2012 to 2022 and Forecast 2023 to 2033, By Diagnosis & Treatment Type

Table 29: Latin America Market Size (US$ Million) Analysis 2012 to 2022 and Forecast 2023 to 2033, By Diagnosis & Treatment Type

Table 30: Latin America Market Size (US$ Million) Analysis 2012 to 2022 and Forecast 2023 to 2033, By Diagnosis & Treatment Type

Table 31: Latin America Market Size (US$ Million) Analysis 2012 to 2022 and Forecast 2023 to 2033, By Indication

Table 32: Latin America Market Size (US$ Million) Analysis 2012 to 2022 and Forecast 2023 to 2033, By Indication

Table 33: Latin America Market Size (US$ Million) Analysis 2012 to 2022 and Forecast 2023 to 2033, By Distribution Channel

Table 34: Latin America Market Size (US$ Million) Analysis 2012 to 2022 and Forecast 2023 to 2033, By Distribution Channel

Table 35: Latin America Market Size (US$ Million) Analysis 2012 to 2022 and Forecast 2023 to 2033, By Service Provider

Table 36: Latin America Market Size (US$ Million) Analysis 2012 to 2022 and Forecast 2023 to 2033, By Service Provider

Table 37: Europe Market Size (US$ Million) Analysis 2012 to 2022 and Forecast 2023 to 2033, By Country

Table 38: Europe Market Size (US$ Million) Analysis 2012 to 2022 and Forecast 2023 to 2033, By Country

Table 39: Europe Market Size (US$ Million) Analysis 2012 to 2022 and Forecast 2023 to 2033, By Diagnosis & Treatment Type

Table 40: Europe Market Size (US$ Million) Analysis 2012 to 2022 and Forecast 2023 to 2033, By Diagnosis & Treatment Type

Table 41: Europe Market Size (US$ Million) Analysis 2012 to 2022 and Forecast 2023 to 2033, By Diagnosis & Treatment Type

Table 42: Europe Market Size (US$ Million) Analysis 2012 to 2022 and Forecast 2023 to 2033, By Diagnosis & Treatment Type

Table 43: Europe Market Size (US$ Million) Analysis 2012 to 2022 and Forecast 2023 to 2033, By Indication

Table 44: Europe Market Size (US$ Million) Analysis 2012 to 2022 and Forecast 2023 to 2033, By Indication

Table 45: Europe Market Size (US$ Million) Analysis 2012 to 2022 and Forecast 2023 to 2033, By Distribution Channel

Table 46: Europe Market Size (US$ Million) Analysis 2012 to 2022 and Forecast 2023 to 2033, By Distribution Channel

Table 47: Europe Market Size (US$ Million) Analysis 2012 to 2022 and Forecast 2023 to 2033, By Service Provider

Table 48: Europe Market Size (US$ Million) Analysis 2012 to 2022 and Forecast 2023 to 2033, By Service Provider

Table 49: South Asia Market Size (US$ Million) Analysis 2012 to 2022 and Forecast 2023 to 2033, By Country

Table 50: South Asia Market Size (US$ Million) Analysis 2012 to 2022 and Forecast 2023 to 2033, By Country

Table 51: South Asia Market Size (US$ Million) Analysis 2012 to 2022 and Forecast 2023 to 2033, By Diagnosis & Treatment Type

Table 52: South Asia Market Size (US$ Million) Analysis 2012 to 2022 and Forecast 2023 to 2033, By Diagnosis & Treatment Type

Table 53: South Asia Market Size (US$ Million) Analysis 2012 to 2022 and Forecast 2023 to 2033, By Diagnosis & Treatment Type

Table 54: South Asia Market Size (US$ Million) Analysis 2012 to 2022 and Forecast 2023 to 2033, By Diagnosis & Treatment Type

Table 55: South Asia Market Size (US$ Million) Analysis 2012 to 2022 and Forecast 2023 to 2033, By Indication

Table 56: South Asia Market Size (US$ Million) Analysis 2012 to 2022 and Forecast 2023 to 2033, By Indication

Table 57: South Asia Market Size (US$ Million) Analysis 2012 to 2022 and Forecast 2023 to 2033, By Distribution Channel

Table 58: South Asia Market Size (US$ Million) Analysis 2012 to 2022 and Forecast 2023 to 2033, By Distribution Channel

Table 59: South Asia Market Size (US$ Million) Analysis 2012 to 2022 and Forecast 2023 to 2033, By Service Provider

Table 60: South Asia Market Size (US$ Million) Analysis 2012 to 2022 and Forecast 2023 to 2033, By Service Provider

Table 61: East Asia Market Size (US$ Million) Analysis 2012 to 2022 and Forecast 2023 to 2033, By Country

Table 62: East Asia Market Size (US$ Million) Analysis 2012 to 2022 and Forecast 2023 to 2033, By Country

Table 63: East Asia Market Size (US$ Million) Analysis 2012 to 2022 and Forecast 2023 to 2033, By Diagnosis & Treatment Type

Table 64: East Asia Market Size (US$ Million) Analysis 2012 to 2022 and Forecast 2023 to 2033, By Diagnosis & Treatment Type

Table 65: East Asia Market Size (US$ Million) Analysis 2012 to 2022 and Forecast 2023 to 2033, By Diagnosis & Treatment Type

Table 66: East Asia Market Size (US$ Million) Analysis 2012 to 2022 and Forecast 2023 to 2033, By Diagnosis & Treatment Type

Table 67: East Asia Market Size (US$ Million) Analysis 2012 to 2022 and Forecast 2023 to 2033, By Indication

Table 68: East Asia Market Size (US$ Million) Analysis 2012 to 2022 and Forecast 2023 to 2033, By Indication

Table 69: East Asia Market Size (US$ Million) Analysis 2012 to 2022 and Forecast 2023 to 2033, By Distribution Channel

Table 70: East Asia Market Size (US$ Million) Analysis 2012 to 2022 and Forecast 2023 to 2033, By Distribution Channel

Table 71: East Asia Market Size (US$ Million) Analysis 2012 to 2022 and Forecast 2023 to 2033, By Service Provider

Table 72: East Asia Market Size (US$ Million) Analysis 2012 to 2022 and Forecast 2023 to 2033, By Service Provider

Table 73: Oceania Market Size (US$ Million) Analysis 2012 to 2022 and Forecast 2023 to 2033, By Country

Table 74: Oceania Market Size (US$ Million) Analysis 2012 to 2022 and Forecast 2023 to 2033, By Country

Table 75: Oceania Market Size (US$ Million) Analysis 2012 to 2022 and Forecast 2023 to 2033, By Diagnosis & Treatment Type

Table 76: Oceania Market Size (US$ Million) Analysis 2012 to 2022 and Forecast 2023 to 2033, By Diagnosis & Treatment Type

Table 77: Oceania Market Size (US$ Million) Analysis 2012 to 2022 and Forecast 2023 to 2033, By Diagnosis & Treatment Type

Table 78: Oceania Market Size (US$ Million) Analysis 2012 to 2022 and Forecast 2023 to 2033, By Diagnosis & Treatment Type

Table 79: Oceania Market Size (US$ Million) Analysis 2012 to 2022 and Forecast 2023 to 2033, By Indication

Table 80: Oceania Market Size (US$ Million) Analysis 2012 to 2022 and Forecast 2023 to 2033, By Indication

Table 81: Oceania Market Size (US$ Million) Analysis 2012 to 2022 and Forecast 2023 to 2033, By Distribution Channel

Table 82: Oceania Market Size (US$ Million) Analysis 2012 to 2022 and Forecast 2023 to 2033, By Distribution Channel

Table 83: Oceania Market Size (US$ Million) Analysis 2012 to 2022 and Forecast 2023 to 2033, By Service Provider

Table 84: Oceania Market Size (US$ Million) Analysis 2012 to 2022 and Forecast 2023 to 2033, By Service Provider

Table 85: Middle East and Africa Market Size (US$ Million) Analysis 2012 to 2022 and Forecast 2023 to 2033, By Country

Table 86: Middle East and Africa Market Size (US$ Million) Analysis 2012 to 2022 and Forecast 2023 to 2033, By Country

Table 87: Middle East & Africa Market Size (US$ Million) Analysis 2012 to 2022 and Forecast 2023 to 2033, By Diagnosis & Treatment Type

Table 88: Middle East & Africa Market Size (US$ Million) Analysis 2012 to 2022 and Forecast 2023 to 2033, By Diagnosis & Treatment Type

Table 89: Middle East & Africa Market Size (US$ Million) Analysis 2012 to 2022 and Forecast 2023 to 2033, By Diagnosis & Treatment Type

Table 90: Middle East & Africa Market Size (US$ Million) Analysis 2012 to 2022 and Forecast 2023 to 2033, By Diagnosis & Treatment Type

Table 91: Middle East & Africa Market Size (US$ Million) Analysis 2012 to 2022 and Forecast 2023 to 2033, By Indication

Table 92: Middle East & Africa Market Size (US$ Million) Analysis 2012 to 2022 and Forecast 2023 to 2033, By Indication

Table 93: Middle East & Africa Market Size (US$ Million) Analysis 2012 to 2022 and Forecast 2023 to 2033, By Distribution Channel

Table 94: Middle East & Africa Market Size (US$ Million) Analysis 2012 to 2022 and Forecast 2023 to 2033, By Distribution Channel

Table 95: Middle East & Africa Market Size (US$ Million) Analysis 2012 to 2022 and Forecast 2023 to 2033, By Service Provider

Table 96: Middle East & Africa Market Size (US$ Million) Analysis 2012 to 2022 and Forecast 2023 to 2033, By Service Provider

List of Figures

Figure 01: Global Market Size (US$ Million) Analysis, 2012 to 2022

Figure 02: Global Market Size (US$ Million) & Y-o-Y Growth (%) Analysis, 2023 to 2033

Figure 03: Global Market Absolute $ Opportunity Analysis, 2022-2033

Figure 04: Global Market Analysis By Diagnosis & Treatment Type –2022 & 2033

Figure 05: Global Market Y-o-Y Growth Projections By Diagnosis & Treatment Type , 2023 to 2033

Figure 06: Global Market Attractiveness, By Diagnosis & Treatment Type, 2022- 2032

Figure 07: Global Market Analysis By Indication –2022 & 2033

Figure 08: Global Market Y-o-Y Growth Projections By Indication , 2023 to 2033

Figure 09: Global Market Attractiveness, By Indication, 2022- 2032

Figure 10: Global Market Analysis by Distribution Channel –2022 & 2033

Figure 11: Global Market Y-o-Y Growth Projections by Distribution Channel , 2023 to 2033

Figure 12: Global Market Attractiveness, by Distribution Channel, 2022- 2032

Figure 13: Global Market Analysis By Service Provider–2022 & 2033

Figure 14: Global Market Y-o-Y Growth Projections By Service Provider, 2023 to 2033

Figure 15: Global Market Attractiveness, By Service Provider, 2023 to 2033

Figure 16: Global Market Analysis by Region–2022 & 2033

Figure 17: Global Market Y-o-Y Growth Projections by Region, 2023 to 2033

Figure 18: Global Market Attractiveness, By Region, 2023 to 2033

Figure 19: North America Market Value Share, By Diagnosis & Treatment Type 2023 (E)

Figure 20: North America Market Value Share, By Indication 2023 (E)

Figure 21: North America Market Value Share, by Distribution Channel 2023 (E)

Figure 22: North America Market Value Share, by Service Provider 2023 (E)

Figure 23: North America Market Value Share, by Country 2023 (E)

Figure 24: North America Market Size (US$ Million) Analysis, 2012 to 2022

Figure 25: North America Market Size (US$ Million) & Y-o-Y Growth (%) Analysis, 2023 to 2033

Figure 26: North America Market Attractiveness Analysis , by Country

Figure 27: North America Market Attractiveness Analysis, By Diagnosis & Treatment Type

Figure 28: North America Market Attractiveness, By Indication

Figure 29: North America Market Attractiveness Analysis , by Distribution Channel

Figure 30: North America Market Attractiveness Analysis, By Service Provider

Figure 31: USA Market Value Proportion Analysis, 2022

Figure 32: Global Vs. USA Growth Comparison, 2022-2033

Figure 33: USA Market Share Analysis (%), By Diagnosis & Treatment Type, 2022 & 2033

Figure 34: USA Market Share Analysis (%), By Indication, 2022 & 2033

Figure 35: USA Market Share Analysis (%), By Distribution Channel, 2022 & 2033

Figure 36: USA Market Share Analysis (%), By Service Providers, 2022 & 2033

Figure 37: Canada Market Value Proportion Analysis, 2022

Figure 38: Global Vs. Canada Growth Comparison, 2022-2033

Figure 39: Canada Market Share Analysis (%), By Diagnosis & Treatment Type, 2022 & 2033

Figure 40: Canada Market Share Analysis (%), By Indication, 2022 & 2033

Figure 41: Canada Market Share Analysis (%), By Distribution Channel, 2022 & 2033

Figure 42: Canada Market Share Analysis (%), By Service Providers, 2022 & 2033

Figure 43: Latin America Market Value Share, By Diagnosis & Treatment Type 2023 (E)

Figure 44: Latin America Market Value Share, By Indication 2023 (E)

Figure 45: Latin America Market Value Share, by Distribution Channel 2023 (E)

Figure 46: Latin America Market Value Share, by Service Provider 2023 (E)

Figure 47: Latin America Market Value Share, by Country 2023 (E)

Figure 48: Latin America Market Size (US$ Million) Analysis, 2012 to 2022

Figure 49: Latin America Market Size (US$ Million) & Y-o-Y Growth (%) Analysis, 2023 to 2033

Figure 50: Latin America Market Attractiveness Analysis , by Country

Figure 51: Latin America Market Attractiveness Analysis, By Diagnosis & Treatment Type

Figure 52: Latin America Market Attractiveness, By Indication

Figure 53: Latin America Market Attractiveness Analysis , by Distribution Channel

Figure 54: Latin America Market Attractiveness Analysis, By Service Provider

Figure 55: Brazil Market Value Proportion Analysis, 2022

Figure 56: Global Vs. Brazil Growth Comparison, 2022-2033

Figure 57: Brazil Market Share Analysis (%), By Diagnosis & Treatment Type, 2022 & 2033

Figure 58: Brazil Market Share Analysis (%), By Indication, 2022 & 2033

Figure 59: Brazil Market Share Analysis (%), By Distribution Channel, 2022 & 2033

Figure 60: Brazil Market Share Analysis (%), By Service Providers, 2022 & 2033

Figure 61: Mexico Market Value Proportion Analysis, 2022

Figure 62: Global Vs. Mexico Growth Comparison, 2022-2033

Figure 63: Mexico Market Share Analysis (%), By Diagnosis & Treatment Type, 2022 & 2033

Figure 64: Mexico Market Share Analysis (%), By Indication, 2022 & 2033

Figure 65: Mexico Market Share Analysis (%), By Distribution Channel, 2022 & 2033

Figure 66: Mexico Market Share Analysis (%), By Service Providers, 2022 & 2033

Figure 67: Argentina Market Value Proportion Analysis, 2022

Figure 68: Global Vs. Argentina Growth Comparison, 2022-2033

Figure 69: Argentina Market Share Analysis (%), By Diagnosis & Treatment Type, 2022 & 2033

Figure 70: Argentina Market Share Analysis (%), By Indication, 2022 & 2033

Figure 71: Argentina Market Share Analysis (%), By Distribution Channel, 2022 & 2033

Figure 72: Argentina Market Share Analysis (%), By Service Providers, 2022 & 2033

Figure 73: Europe Market Value Share, By Diagnosis & Treatment Type 2023 (E)

Figure 74: Europe Market Value Share, By Indication 2023 (E)

Figure 75: Europe Market Value Share, by Distribution Channel 2023 (E)

Figure 76: Europe Market Value Share, by Service Provider 2023 (E)

Figure 77: Europe Market Value Share, by Country 2023 (E)

Figure 78: Europe Market Size (US$ Million) Analysis, 2012 to 2022

Figure 79: Europe Market Size (US$ Million) & Y-o-Y Growth (%) Analysis, 2023 to 2033

Figure 80: Europe Market Attractiveness Analysis , by Country

Figure 81: Europe Market Attractiveness Analysis, By Diagnosis & Treatment Type

Figure 82: Europe Market Attractiveness, By Indication

Figure 83: Europe Market Attractiveness Analysis , by Distribution Channel

Figure 84: Europe Market Attractiveness Analysis, By Service Provider

Figure 85: Germany Market Value Proportion Analysis, 2022

Figure 86: Global Vs. Germany Growth Comparison, 2022-2033

Figure 87: Germany Market Share Analysis (%), By Diagnosis & Treatment Type, 2022 & 2033

Figure 88: Germany Market Share Analysis (%), By Indication, 2022 & 2033

Figure 89: Germany Market Share Analysis (%), By Distribution Channel, 2022 & 2033

Figure 90: Germany Market Share Analysis (%), By Service Providers, 2022 & 2033

Figure 91: Italy Market Value Proportion Analysis, 2022

Figure 92: Global Vs. Italy Growth Comparison, 2022-2033

Figure 93: Italy Market Share Analysis (%), By Diagnosis & Treatment Type, 2022 & 2033

Figure 94: Italy Market Share Analysis (%), By Indication, 2022 & 2033

Figure 95: Italy Market Share Analysis (%), By Distribution Channel, 2022 & 2033

Figure 96: Italy Market Share Analysis (%), By Service Providers, 2022 & 2033

Figure 97: France Market Value Proportion Analysis, 2022

Figure 98: Global Vs. France Growth Comparison, 2022-2033

Figure 99: France Market Share Analysis (%), By Diagnosis & Treatment Type, 2022 & 2033

Figure 100: France Market Share Analysis (%), By Indication, 2022 & 2033

Figure 101: France Market Share Analysis (%), By Distribution Channel, 2022 & 2033

Figure 102: France Market Share Analysis (%), By Service Providers, 2022 & 2033

Figure 103: United Kingdom Market Value Proportion Analysis, 2022

Figure 104: Global Vs. United Kingdom Growth Comparison, 2022-2033

Figure 105: United Kingdom Market Share Analysis (%), By Diagnosis & Treatment Type, 2022 & 2033

Figure 106: United Kingdom Market Share Analysis (%), By Indication, 2022 & 2033

Figure 107: United Kingdom Market Share Analysis (%), By Distribution Channel, 2022 & 2033

Figure 108: United Kingdom Market Share Analysis (%), By Service Providers, 2022 & 2033

Figure 109: Spain Market Value Proportion Analysis, 2022

Figure 110: Global Vs. Spain Growth Comparison, 2022-2033

Figure 111: Spain Market Share Analysis (%), By Diagnosis & Treatment Type, 2022 & 2033

Figure 112: Spain Market Share Analysis (%), By Indication, 2022 & 2033

Figure 113: Spain Market Share Analysis (%), By Distribution Channel, 2022 & 2033

Figure 114: Spain Market Share Analysis (%), By Service Providers, 2022 & 2033

Figure 115: BENELUX Market Value Proportion Analysis, 2022

Figure 116: Global Vs. BENELUX Growth Comparison, 2022-2033

Figure 117: BENELUX Market Share Analysis (%), By Diagnosis & Treatment Type, 2022 & 2033

Figure 118: BENELUX Market Share Analysis (%), By Indication, 2022 & 2033

Figure 119: BENELUX Market Share Analysis (%), By Distribution Channel, 2022 & 2033

Figure 120: BENELUX Market Share Analysis (%), By Service Providers, 2022 & 2033

Figure 121: Nordic Countries Market Value Proportion Analysis, 2022

Figure 122: Global Vs. Nordic Countries Growth Comparison, 2022-2033

Figure 123: Nordic Countries Market Share Analysis (%), By Diagnosis & Treatment Type, 2022 & 2033

Figure 124: Nordic Countries Market Share Analysis (%), By Indication, 2022 & 2033

Figure 125: Nordic Countries Market Share Analysis (%), By Distribution Channel, 2022 & 2033

Figure 126: Nordic Countries Market Share Analysis (%), By Service Providers, 2022 & 2033

Figure 127: Russia Market Value Proportion Analysis, 2022

Figure 128: Global Vs. Russia Growth Comparison, 2022-2033

Figure 129: Russia Market Share Analysis (%), By Diagnosis & Treatment Type, 2022 & 2033

Figure 130: Russia Market Share Analysis (%), By Indication, 2022 & 2033

Figure 131: Russia Market Share Analysis (%), By Distribution Channel, 2022 & 2033

Figure 132: Russia Market Share Analysis (%), By Service Providers, 2022 & 2033

Figure 133: South Asia Market Value Share, By Diagnosis & Treatment Type 2023 (E)

Figure 134: South Asia Market Value Share, By Indication 2023 (E)

Figure 135: South Asia Market Value Share, by Distribution Channel 2023 (E)

Figure 136: South Asia Market Value Share, by Service Provider 2023 (E)

Figure 137: South Asia Market Value Share, by Country 2023 (E)

Figure 138: South Asia Market Size (US$ Million) Analysis, 2012 to 2022

Figure 139: South Asia Market Size (US$ Million) & Y-o-Y Growth (%) Analysis, 2023 to 2033

Figure 140: South Asia Market Attractiveness Analysis , by Country

Figure 141: South Asia Market Attractiveness Analysis, By Diagnosis & Treatment Type

Figure 142: South Asia Market Attractiveness, By Indication

Figure 143: South Asia Market Attractiveness Analysis , by Distribution Channel

Figure 144: South Asia Market Attractiveness Analysis, By Service Provider

Figure 145: India Market Value Proportion Analysis, 2022

Figure 146: Global Vs. India Growth Comparison, 2022-2033

Figure 147: India Market Share Analysis (%), By Diagnosis & Treatment Type, 2022 & 2033

Figure 148: India Market Share Analysis (%), By Indication, 2022 & 2033

Figure 149: India Market Share Analysis (%), By Distribution Channel, 2022 & 2033

Figure 150: India Market Share Analysis (%), By Service Providers, 2022 & 2033

Figure 151: Thailand Market Value Proportion Analysis, 2022

Figure 152: Global Vs. Thailand Growth Comparison, 2022-2033

Figure 153: Thailand Market Share Analysis (%), By Diagnosis & Treatment Type, 2022 & 2033

Figure 154: Thailand Market Share Analysis (%), By Indication, 2022 & 2033

Figure 155: Thailand Market Share Analysis (%), By Distribution Channel, 2022 & 2033

Figure 156: Thailand Market Share Analysis (%), By Service Providers, 2022 & 2033

Figure 157: Indonesia Market Value Proportion Analysis, 2022

Figure 158: Global Vs. Indonesia Growth Comparison, 2022-2033

Figure 159: Indonesia Market Share Analysis (%), By Diagnosis & Treatment Type, 2022 & 2033

Figure 160: Indonesia Market Share Analysis (%), By Indication, 2022 & 2033

Figure 161: Indonesia Market Share Analysis (%), By Distribution Channel, 2022 & 2033

Figure 162: Indonesia Market Share Analysis (%), By Service Providers, 2022 & 2033

Figure 163: Malaysia Market Value Proportion Analysis, 2022

Figure 164: Global Vs. Malaysia Growth Comparison, 2022-2033

Figure 165: Malaysia Market Share Analysis (%), By Diagnosis & Treatment Type, 2022 & 2033

Figure 166: Malaysia Market Share Analysis (%), By Indication, 2022 & 2033

Figure 167: Malaysia Market Share Analysis (%), By Distribution Channel, 2022 & 2033

Figure 168: Malaysia Market Share Analysis (%), By Service Providers, 2022 & 2033

Figure 169: Philippines Market Value Proportion Analysis, 2022

Figure 170: Global Vs. Philippines Growth Comparison, 2022-2033

Figure 171: Philippines Market Share Analysis (%), By Diagnosis & Treatment Type, 2022 & 2033

Figure 172: Philippines Market Share Analysis (%), By Indication, 2022 & 2033

Figure 173: Philippines Market Share Analysis (%), By Distribution Channel, 2022 & 2033

Figure 174: Philippines Market Share Analysis (%), By Service Providers, 2022 & 2033

Figure 175: Vietnam Market Value Proportion Analysis, 2022

Figure 176: Global Vs. Vietnam Growth Comparison, 2022-2033

Figure 177: Vietnam Market Share Analysis (%), By Diagnosis & Treatment Type, 2022 & 2033

Figure 178: Vietnam Market Share Analysis (%), By Indication, 2022 & 2033

Figure 179: Vietnam Market Share Analysis (%), By Distribution Channel, 2022 & 2033

Figure 180: Vietnam Market Share Analysis (%), By Service Providers, 2022 & 2033

Figure 181: East Asia Market Value Share, By Diagnosis & Treatment Type 2023 (E)

Figure 182: East Asia Market Value Share, By Indication 2023 (E)

Figure 183: East Asia Market Value Share, by Distribution Channel 2023 (E)

Figure 184: East Asia Market Value Share, by Service Provider 2023 (E)

Figure 185: East Asia Market Value Share, by Country 2023 (E)

Figure 186: East Asia Market Size (US$ Million) Analysis, 2012 to 2022

Figure 187: East Asia Market Size (US$ Million) & Y-o-Y Growth (%) Analysis, 2023 to 2033

Figure 188: East Asia Market Attractiveness Analysis , by Country

Figure 189: East Asia Market Attractiveness Analysis, By Diagnosis & Treatment Type

Figure 190: East Asia Market Attractiveness, By Indication

Figure 191: East Asia Market Attractiveness Analysis , by Distribution Channel

Figure 192: East Asia Market Attractiveness Analysis, By Service Provider

Figure 193: China Market Value Proportion Analysis, 2022

Figure 194: Global Vs. China Growth Comparison, 2022-2033

Figure 195: China Market Share Analysis (%), By Diagnosis & Treatment Type, 2022 & 2033

Figure 196: China Market Share Analysis (%), By Indication, 2022 & 2033

Figure 197: China Market Share Analysis (%), By Distribution Channel, 2022 & 2033

Figure 198: China Market Share Analysis (%), By Service Providers, 2022 & 2033

Figure 199: Japan Market Value Proportion Analysis, 2022

Figure 200: Global Vs. Japan Growth Comparison, 2022-2033

Figure 201: Japan Market Share Analysis (%), By Diagnosis & Treatment Type, 2022 & 2033

Figure 202: Japan Market Share Analysis (%), By Indication, 2022 & 2033

Figure 203: Japan Market Share Analysis (%), By Distribution Channel, 2022 & 2033

Figure 204: Japan Market Share Analysis (%), By Service Providers, 2022 & 2033

Figure 205: South Korea Market Value Proportion Analysis, 2022

Figure 206: Global Vs. South Korea Growth Comparison, 2022-2033

Figure 207: South Korea Market Share Analysis (%), By Diagnosis & Treatment Type, 2022 & 2033

Figure 208: South Korea Market Share Analysis (%), By Indication, 2022 & 2033

Figure 209: South Korea Market Share Analysis (%), By Distribution Channel, 2022 & 2033

Figure 210: South Korea Market Share Analysis (%), By Service Providers, 2022 & 2033

Figure 211: Oceania Market Value Share, By Diagnosis & Treatment Type 2023 (E)

Figure 212: Oceania Market Value Share, By Indication 2023 (E)

Figure 213: Oceania Market Value Share, by Distribution Channel 2023 (E)

Figure 214: Oceania Market Value Share, by Service Provider 2023 (E)

Figure 215: Oceania Market Value Share, by Country 2023 (E)

Figure 216: Oceania Market Size (US$ Million) Analysis, 2012 to 2022

Figure 217: Oceania Market Size (US$ Million) & Y-o-Y Growth (%) Analysis, 2023 to 2033

Figure 218: Oceania Market Attractiveness Analysis , by Country

Figure 219: Oceania Market Attractiveness Analysis, By Diagnosis & Treatment Type

Figure 220: Oceania Market Attractiveness, By Indication

Figure 221: Oceania Market Attractiveness Analysis , by Distribution Channel

Figure 222: Oceania Market Attractiveness Analysis, By Service Provider

Figure 223: Australia Market Value Proportion Analysis, 2022

Figure 224: Global Vs. Australia Growth Comparison, 2022-2033

Figure 225: Australia Market Share Analysis (%), By Diagnosis & Treatment Type, 2022 & 2033

Figure 226: Australia Market Share Analysis (%), By Indication, 2022 & 2033

Figure 227: Australia Market Share Analysis (%), By Distribution Channel, 2022 & 2033

Figure 228: Australia Market Share Analysis (%), By Service Providers, 2022 & 2033

Figure 229: New Zealand Market Value Proportion Analysis, 2022

Figure 230: Global Vs. New Zealand Growth Comparison, 2022-2033

Figure 231: New Zealand Market Share Analysis (%), By Diagnosis & Treatment Type, 2022 & 2033

Figure 232: New Zealand Market Share Analysis (%), By Indication, 2022 & 2033

Figure 233: New Zealand Market Share Analysis (%), By Distribution Channel, 2022 & 2033

Figure 234: New Zealand Market Share Analysis (%), By Service Providers, 2022 & 2033

Figure 235: Middle East & Africa Market Value Share, By Diagnosis & Treatment Type 2023 (E)

Figure 236: Middle East & Africa Market Value Share, By Indication 2023 (E)

Figure 237: Middle East & Africa Market Value Share, by Distribution Channel 2023 (E)

Figure 238: Middle East & Africa Market Value Share, by Service Provider 2023 (E)

Figure 239: Middle East & Africa Market Value Share, by Country 2023 (E)

Figure 240: Middle East & Africa Market Size (US$ Million) Analysis, 2012 to 2022

Figure 241: Middle East & Africa Market Size (US$ Million) & Y-o-Y Growth (%) Analysis, 2023 to 2033

Figure 242: Middle East & Africa Market Attractiveness Analysis, by Country

Figure 243: Middle East & Africa Market Attractiveness Analysis, By Diagnosis & Treatment Type

Figure 244: Middle East & Africa Market Attractiveness, By Indication

Figure 245: Middle East & Africa Market Attractiveness Analysis, by Distribution Channel

Figure 246: Middle East & Africa Market Attractiveness Analysis, By Service Provider

Figure 247: GCC Countries Market Value Proportion Analysis, 2022

Figure 248: Global Vs. GCC Countries Growth Comparison, 2022-2033

Figure 249: GCC Countries Market Share Analysis (%), By Diagnosis & Treatment Type, 2022 & 2033

Figure 250: GCC Countries Market Share Analysis (%), By Indication, 2022 & 2033

Figure 251: GCC Countries Market Share Analysis (%), By Distribution Channel, 2022 & 2033

Figure 252: GCC Countries Market Share Analysis (%), By Service Providers, 2022 & 2033

Figure 253: Türkiye Market Value Proportion Analysis, 2022

Figure 254: Global Vs. Türkiye Growth Comparison, 2022-2033

Figure 255: Türkiye Market Share Analysis (%), By Diagnosis & Treatment Type, 2022 & 2033

Figure 256: Türkiye Market Share Analysis (%), By Indication, 2022 & 2033

Figure 257: Türkiye Market Share Analysis (%), By Distribution Channel, 2022 & 2033

Figure 258: Türkiye Market Share Analysis (%), By Service Providers, 2022 & 2033

Figure 259: South Africa Market Value Proportion Analysis, 2022

Figure 260: Global Vs. South Africa Growth Comparison, 2022-2033

Figure 261: South Africa Market Share Analysis (%), By Diagnosis & Treatment Type, 2022 & 2033

Figure 262: South Africa Market Share Analysis (%), By Indication, 2022 & 2033

Figure 263: South Africa Market Share Analysis (%), By Distribution Channel, 2022 & 2033

Figure 264: South Africa Market Share Analysis (%), By Service Providers, 2022 & 2033

Figure 265: North Africa Market Value Proportion Analysis, 2022

Figure 266: Global Vs. North Africa Growth Comparison, 2022-2033

Figure 267: North Africa Market Share Analysis (%), By Diagnosis & Treatment Type, 2022 & 2033

Figure 268: North Africa Market Share Analysis (%), By Indication, 2022 & 2033

Figure 269: North Africa Market Share Analysis (%), By Distribution Channel, 2022 & 2033

Figure 270: North Africa Market Share Analysis (%), By Service Providers, 2022 & 2033

Frequently Asked Questions

How much is the global market currently worth in 2022?

The global market is valued around USD 12.2 Billion in 2022.

What is the global market estimated reach in 2023?

The global market estimates for 2023 is around USD 13.1 Billion.

What is the sales forecast for the global market till 2033?

The global market is set to reach USD 28.4 Billion by the end of 2033, with sales revenue expected to be 8.1% CAGR through 2033.

Which region dominated the global market in 2022?

North America dominated the global market in 2022 with the USA being the leading contributor in the North American region.

What are key opportunities in the global market?

Rising demand for improved brain and mental fitness and improving healthcare infrastructure to offer lucrative growth opportunities for the market players to grow.

Which Indication segment will garner significant value share by 2022?

Cerebral palsy segment dominated the global market in 2022 with 14.4% revenue share and is expected to lead in 2023 as well.

What are the top countries driving demand for the market?

The USA, India, China, Germany and United Kingdom are the top countries that are driving the demand for the spasticity treatment globally.

What was the last ten year’s CAGR for the global market?

From 2012 to 2022, the market for spasticity treatment expanded at the rate of 5.4%.

Which are the leading companies in the spasticity treatment market?

Allergan plc. (AbbVie), F. Hoffmann-La Roche Ltd, Pfizer Inc., Medtronic Plc, GlaxoSmithKline plc, are few key players within the global market.

What is the China market outlook?

China is projected to grow with CAGR of 7.7% over the forecast duration.

Explore Similar Insights

Future Market Insights

Spasticity Treatment Market