The pallet pooling market is expanding steadily due to increasing global trade volumes, rising emphasis on supply chain efficiency, and widespread adoption of sustainable logistics solutions. Market growth is being supported by demand from industries requiring high turnaround and standardized load handling. The current scenario is characterized by a shift toward rental-based pallet systems that optimize asset utilization and reduce operational costs.
Growing automation in warehouses and distribution centers is further enhancing pallet compatibility and quality requirements. Future expansion is expected to be driven by the integration of digital tracking systems, improved pallet durability, and the circular economy model promoting reusability.
Cost-efficiency, reduced carbon footprint, and consistency in load management are positioning pallet pooling as a preferred logistics solution Growth rationale is centered on expanding e-commerce, increasing cross-border trade, and the continuous need for standardized transport platforms across manufacturing and retail sectors, ensuring sustained revenue generation and operational optimization in the coming years.
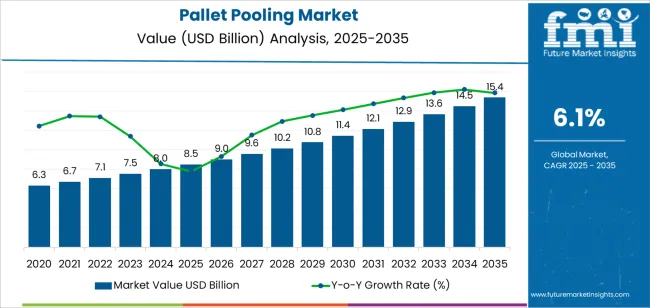
| Metric | Value |
|---|---|
| Pallet Pooling Market Estimated Value in (2025 E) | USD 8.5 billion |
| Pallet Pooling Market Forecast Value in (2035 F) | USD 15.4 billion |
| Forecast CAGR (2025 to 2035) | 6.1% |
The market is segmented by Structural Design, Materials, and End Use Industry and region. By Structural Design, the market is divided into Block, Stringer, and Customized. In terms of Materials, the market is classified into Plastic, Wood, Composite, Steel, and Other Metals. Based on End Use Industry, the market is segmented into Food and Beverages, FMCG Industry, Pharmaceuticals, Electronics, Chemicals, and Others. Regionally, the market is classified into North America, Latin America, Western Europe, Eastern Europe, Balkan & Baltic Countries, Russia & Belarus, Central Asia, East Asia, South Asia & Pacific, and the Middle East & Africa.
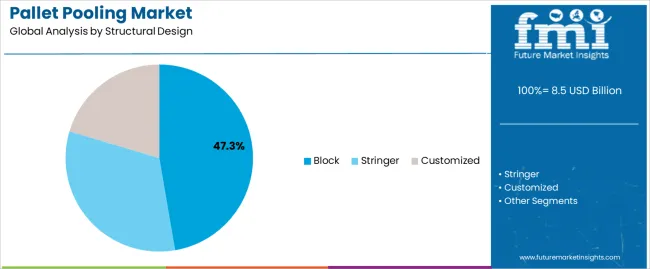
The block pallet segment, representing 47.30% of the structural design category, has emerged as the dominant design type due to its superior strength, four-way entry accessibility, and high load-bearing capacity. The design’s structural stability and adaptability to automated handling systems have strengthened its market leadership.
Block pallets are being preferred by large-scale manufacturers and logistics providers seeking efficient stacking and storage capabilities. Their uniformity and compatibility with mechanical handling equipment have enhanced operational efficiency across complex supply chains.
Increased standardization across global markets and the use of durable materials have further extended service life and cost-effectiveness As industries continue adopting automation and high-speed distribution systems, the demand for block pallet configurations is expected to remain strong, ensuring steady growth and sustained adoption within pallet pooling networks.
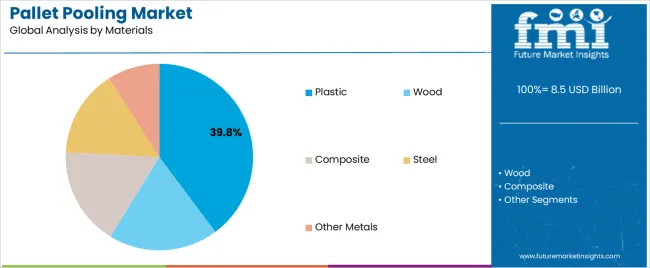
The plastic segment, accounting for 39.80% of the materials category, has gained significant traction owing to its durability, hygiene, and resistance to moisture and contamination. Plastic pallets are increasingly used in industries where cleanliness and consistency are critical, such as food, pharmaceuticals, and chemicals.
Their recyclability and lightweight nature have contributed to logistics efficiency and reduced transportation costs. Improved material engineering has enhanced load capacity and impact resistance, making plastic pallets suitable for high-frequency pooling operations.
The ability to track assets using embedded RFID or barcodes is also driving adoption As sustainability goals become more prominent, the closed-loop recyclability of plastic pallets is expected to further strengthen their market share, maintaining the segment’s growth momentum in the coming years.
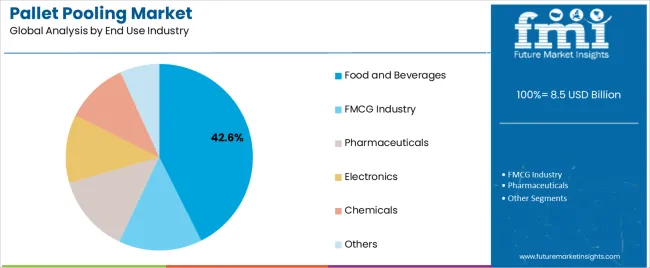
The food and beverages segment, holding 42.60% of the end use industry category, has remained the leading sector utilizing pallet pooling services due to stringent hygiene standards and continuous product movement requirements. High turnover rates in perishable goods and packaged food have made pooled pallets a cost-efficient and reliable solution.
Standardized pallets ensure product safety, efficient loading, and compatibility with automated logistics systems. The rise of temperature-controlled supply chains and expanding retail networks has reinforced demand.
Furthermore, the emphasis on traceability, compliance, and operational sustainability aligns with the principles of pallet pooling, supporting greater adoption within food and beverage logistics As the global demand for processed and packaged foods continues to grow, this segment is expected to drive consistent utilization and revenue growth across the pallet pooling market.
Emerging markets represent significant growth opportunities for the pallet pooling market. The demand for efficient logistics solutions such as pallet pooling is expected to increase, as economies in these regions continue to develop and industrialize.
The scope for pallet pooling rose at a 3.6% CAGR between 2020 and 2025. The global market is anticipated to witness a downwards CAGR of 6.1% over the forecast period 2025 to 2035.
Increasing awareness of sustainability and environmental concerns, led to a shift towards reusable packaging solutions like pallet pooling, during the historical period. Growth of e-commerce and omnichannel retail, had driven the demand for efficient logistics and supply chain solutions.
Factors such as adoption of advanced technologies such as RFID, IoT, and data analytics to improve pallet tracking, management, and optimization had also accelerated the market growth during the historical period.
Further integration of advanced technologies like blockchain and artificial intelligence to enhance pallet pooling operations and provide greater visibility and transparency across the supply chain. Growing demand for customized pallet pooling solutions tailored to specific industry requirements and supply chain dynamics.
Expansion of pallet pooling services in emerging markets with increasing industrialization and urbanization, creating new growth opportunities for market players. Strategic partnerships and alliances between pallet pooling providers and other stakeholders in the logistics ecosystem to offer comprehensive end to end solutions and expand market reach.
Pallet pooling offers cost advantages to businesses compared to traditional pallet ownership models. Companies can avoid the upfront costs associated with purchasing pallets and instead pay for pallet usage on a per-trip basis, by participating in a pallet pool, which can result in significant cost savings over time.
While pallet pooling can offer long term cost savings, the initial investment required to join a pallet pooling program might deter some businesses. Companies may be reluctant to incur upfront expenses associated with membership fees, deposit payments, and integration costs.
The below table showcases revenues in terms of the top 5 leading countries, spearheaded by India and Japan. The countries are expected to lead the market through 2035.
| Countries | Forecast CAGRs from 2025 to 2035 |
|---|---|
| The United States | 4.7% |
| The United Kingdom | 4.7% |
| Germany | 3.6% |
| China | 6.7% |
| India | 9.4% |
The pallet pooling market in the United States expected to expand at a CAGR of 4.7% through 2035. The continued growth of e-commerce in the United States has led to increased demand for efficient logistics solutions, including pallet pooling.
E-commerce companies rely heavily on pallets to transport goods within warehouses and distribution centers, driving the need for pallet pooling services to optimize inventory management and fulfilment processes.
Pallet pooling can offer significant cost savings compared to traditional pallet ownership models. Pallet pooling provides a cost effective solution for businesses looking to streamline their logistics operations, by eliminating the need for upfront capital investment in pallets and reducing maintenance and repair costs.
The pallet pooling market in the United Kingdom is anticipated to expand at a CAGR of 4.7% through 2035. Pallet pooling helps improve supply chain efficiency by ensuring the timely availability of pallets at various stages of the logistics network.
Pallet pooling services enable businesses in the country to optimize inventory levels, reduce transportation costs, and streamline their operations, with real time tracking and management capabilities.
The United Kingdom has regulations and standards governing pallets and packaging materials, particularly in industries such as food and pharmaceuticals. Pallet pooling providers that offer pallets compliant with regulatory requirements have a competitive advantage in the market, as businesses prioritize product safety and compliance throughout the supply chain.
Pallet pooling trends in Germany are taking a turn for the better. A 3.6% CAGR is forecast for the country from 2025 to 2035. The awareness and adoption of pallet pooling solutions are increasing across various industries in Germany, including retail, automotive, pharmaceuticals, and FMCG.
The demand for pallet pooling services is expected to grow, as businesses recognize the benefits of pallet pooling in terms of cost savings, sustainability, and operational efficiency.
Pallet pooling providers in Germany are forming strategic partnerships and alliances with other stakeholders in the logistics ecosystem, including pallet manufacturers, transportation companies, and warehousing providers. The collaborations enable pallet pooling providers to offer comprehensive solutions and expand their market presence in Germany.
The pallet pooling market in China is poised to expand at a CAGR of 6.7% through 2035. The manufacturing sector in China is one of the largest in the world, driving significant demand for logistics solutions, including pallet pooling.
The need for efficient and cost effective pallet pooling services to support supply chain operations is expected to grow, as manufacturing activities continue to expand in China.
The retail industry in China is experiencing rapid growth, driven by rising disposable incomes and changing consumer preferences. Pallet pooling services play a crucial role in supporting the distribution and replenishment of goods in retail supply chains, driving demand for pallet pooling solutions in the country.
The pallet pooling market in India is anticipated to expand at a CAGR of 9.4% through 2035. The agriculture sector in India contributes significantly to the economy of the country.
Pallet pooling services are increasingly used in agricultural supply chains for the storage and transportation of agricultural inputs such as fertilizers, pesticides, and seeds, as well as for the distribution of agricultural produce to markets and consumers.
India is a major player in global trade, with exports and imports accounting for a significant portion of the GDP of the country. Pallet pooling services help streamline export and import operations by providing standardized pallets that comply with international shipping requirements, facilitating smooth movement of goods across borders and enhancing trade efficiency.
The below table highlights how block segment is projected to lead the market in terms of structural design, and is expected to account for a share of 57.3% in 2025. Based on material, the wood segment is expected to account for a share of 57.5% in 2025.
| Category | Market Shares in 2025 |
|---|---|
| Block | 57.3% |
| Wood | 57.5% |
Based on structural design, the block segment is expected to continue dominating the pallet pooling market. Block style pallets are known for their robust construction and high load bearing capacity.
The solid blocks at the corners provide additional strength and stability, making them suitable for heavy duty applications in industries such as manufacturing, automotive, and construction. The durability of block pallets ensures longevity and reduces the need for frequent replacement, making them a cost effective choice for businesses.
Block pallets are well suited for use with automated material handling equipment, such as conveyors, forklifts, and robotic systems. Their consistent dimensions and sturdy construction allow for smooth and efficient handling and transportation within warehouses and distribution centers. The demand for pallets that are compatible with automated systems is expected to grow, as automation becomes increasingly prevalent in logistics operations, driving the adoption of block style pallets.
In terms of material, the wood segment is expected to continue dominating the pallet pooling market, attributed to several key factors. Wood pallets are often more cost effective compared to pallets made from other materials such as plastic or metal.
Their relatively low manufacturing cost makes wood pallets an attractive option for businesses, especially those with large scale logistics operations. The cost effectiveness of wood pallets drives their adoption and fuels growth in the wood segment of the pallet pooling market.
Wood pallets are known for their durability and strength, making them suitable for handling heavy loads and rough handling in warehouses, distribution centers, and during transportation. The robust construction of wood pallets ensures the safe and secure movement of goods, contributing to their popularity in the pallet pooling market.
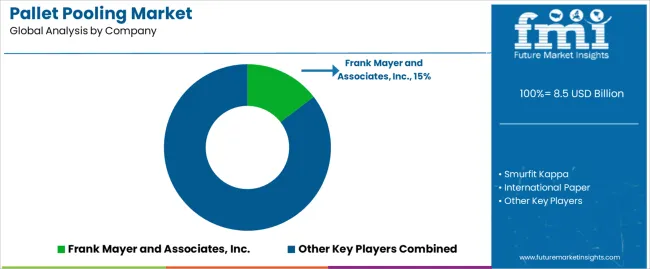
The competitive landscape of the pallet pooling market is characterized by the presence of several established players competing for market share and differentiation. Pallet pooling providers offer a range of services including pallet rental, management, tracking, and repair, catering to diverse industries and supply chain needs.
Company Portfolio
| Attribute | Details |
|---|---|
| Estimated Market Size in 2025 | USD 8.5 billion |
| Projected Market Valuation in 2035 | USD 15.4 billion |
| Value-based CAGR 2025 to 2035 | 6.1% |
| Forecast Period | 2025 to 2035 |
| Historical Data Available for | 2020 to 2025 |
| Market Analysis | Value in USD Million |
| Key Regions Covered | North America; Latin America; Western Europe; Eastern Europe; South Asia and Pacific; East Asia; The Middle East & Africa |
| Key Market Segments Covered | Structural Design, Materials, End Use Industry, Region |
| Key Countries Profiled | The United States, Canada, Brazil, Mexico, Germany, France, France, Spain, Italy, Russia, Poland, Czech Republic, Romania, India, Bangladesh, Australia, New Zealand, China, Japan, South Korea, GCC countries, South Africa, Israel |
| Key Companies Profiled | Brambles; LOSCAM; Euro Pool Group; Faber Halbertsma Group; LPR; Schoeller Arca Time Materials Handling Solutions Limited; Contraload NV; Zentek Pool System GmbH; PPS Midlands Limited; Demes Logistics GmbH & Co. KG |
The global pallet pooling market is estimated to be valued at USD 8.5 billion in 2025.
The market size for the pallet pooling market is projected to reach USD 15.4 billion by 2035.
The pallet pooling market is expected to grow at a 6.1% CAGR between 2025 and 2035.
The key product types in pallet pooling market are block, stringer and customized.
In terms of materials, plastic segment to command 39.8% share in the pallet pooling market in 2025.


Our Research Products

The "Full Research Suite" delivers actionable market intel, deep dives on markets or technologies, so clients act faster, cut risk, and unlock growth.

The Leaderboard benchmarks and ranks top vendors, classifying them as Established Leaders, Leading Challengers, or Disruptors & Challengers.

Locates where complements amplify value and substitutes erode it, forecasting net impact by horizon

We deliver granular, decision-grade intel: market sizing, 5-year forecasts, pricing, adoption, usage, revenue, and operational KPIs—plus competitor tracking, regulation, and value chains—across 60 countries broadly.

Spot the shifts before they hit your P&L. We track inflection points, adoption curves, pricing moves, and ecosystem plays to show where demand is heading, why it is changing, and what to do next across high-growth markets and disruptive tech

Real-time reads of user behavior. We track shifting priorities, perceptions of today’s and next-gen services, and provider experience, then pace how fast tech moves from trial to adoption, blending buyer, consumer, and channel inputs with social signals (#WhySwitch, #UX).

Partner with our analyst team to build a custom report designed around your business priorities. From analysing market trends to assessing competitors or crafting bespoke datasets, we tailor insights to your needs.
Supplier Intelligence
Discovery & Profiling
Capacity & Footprint
Performance & Risk
Compliance & Governance
Commercial Readiness
Who Supplies Whom
Scorecards & Shortlists
Playbooks & Docs
Category Intelligence
Definition & Scope
Demand & Use Cases
Cost Drivers
Market Structure
Supply Chain Map
Trade & Policy
Operating Norms
Deliverables
Buyer Intelligence
Account Basics
Spend & Scope
Procurement Model
Vendor Requirements
Terms & Policies
Entry Strategy
Pain Points & Triggers
Outputs
Pricing Analysis
Benchmarks
Trends
Should-Cost
Indexation
Landed Cost
Commercial Terms
Deliverables
Brand Analysis
Positioning & Value Prop
Share & Presence
Customer Evidence
Go-to-Market
Digital & Reputation
Compliance & Trust
KPIs & Gaps
Outputs
Full Research Suite comprises of:
Market outlook & trends analysis
Interviews & case studies
Strategic recommendations
Vendor profiles & capabilities analysis
5-year forecasts
8 regions and 60+ country-level data splits
Market segment data splits
12 months of continuous data updates
DELIVERED AS:
PDF EXCEL ONLINE
Palletizer Market Size and Share Forecast Outlook 2025 to 2035
Pallet Displays Market Size and Share Forecast Outlook 2025 to 2035
Pallet Wraps Market Size and Share Forecast Outlook 2025 to 2035
Palletizing Robot Industry Analysis in North America Size and Share Forecast Outlook 2025 to 2035
Palletizing Robots Market Size and Share Forecast Outlook 2025 to 2035
Pallet Stretch Wrapping Machine Market Size and Share Forecast Outlook 2025 to 2035
Pallet Box Market Size and Share Forecast Outlook 2025 to 2035
Pallet Labelling System Market Size and Share Forecast Outlook 2025 to 2035
Pallet Labeler Market Size and Share Forecast Outlook 2025 to 2035
Pallet Wrap Industry Analysis in Western Europe Size and Share Forecast Outlook 2025 to 2035
Pallet Jacks Market Size and Share Forecast Outlook 2025 to 2035
Pallet Drum Filler Capper Market Size and Share Forecast Outlook 2025 to 2035
Pallets Market Analysis - Size, Share, and Forecast 2025 to 2035
Pallet Packaging Market Size and Share Forecast Outlook 2025 to 2035
Pallet Shippers Market Size and Share Forecast Outlook 2025 to 2035
Pallet Racking Market Analysis - Size, Share, & Forecast Outlook 2025 to 2035
Pallet Banding Machine Market Analysis - Growth & Forecast 2025 to 2035
Palletizing Machines Market Growth & Demand 2025 to 2035
Pallet Corner Boards Market from 2025 to 2035
Pallet Truck Market Growth - Trends & Forecast 2025 to 2035

Thank you!
You will receive an email from our Business Development Manager. Please be sure to check your SPAM/JUNK folder too.
Chat With
MaRIA