

- Market Size (2026)
- USD 980.7 Mn
- Forecast (2036)
- USD 1911.2 Mn
- CAGR (2026 to 2036)
- 6.9%
How big is the paper recycling surfactants market in 2026?
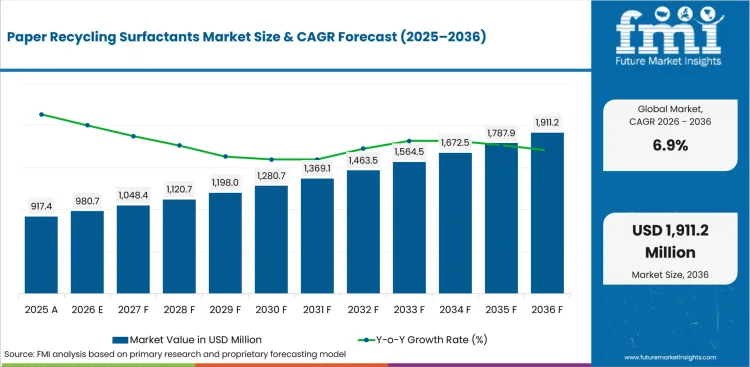
USD 980.7 million in 2026 and USD 1,911.2 million by 2036 at a 6.9% CAGR.
The paper recycling surfactants market is projected to grow from USD 917.4 million in 2025 to USD 1,911.2 million by 2036 at 6.9% CAGR due to recycled-fiber quality control and higher use of recovered paper in packaging mills. Nonionic surfactants are forecast to hold 46.0% share in 2026 owing to flotation deinking stability. Deinking is expected to secure 41.0% share in 2026, reinforced by mill demand for ink removal and yield protection.
Recovered-fiber processing is shifting from commodity chemical buying toward service-backed mill chemistry. The American Forest & Paper Association reported in August 2025 that USA mills consumed 32.7 million tons of recycled paper in 2024, showing a large operating base for deinking and dispersion programs. European Paper Recycling Council data released in July 2025 showed a 75.1% paper recycling rate in 2024, which keeps contaminant control central to repeated fiber cycles. Kemira announced in March 2025 a multi-million Euro expansion for paper and board chemicals in Thailand, supporting regional supply reliability for paper mills using recycled furnish. This keeps the market adjacent to specialty pulp and paper chemicals used in mill process control.
| Metric | Value |
|---|---|
| 2026 Market Size | USD 980.7 million |
| 2036 Market Size | USD 1,911.2 million |
| Forecast CAGR (2026-2036) | 6.9% |
| Leading Surfactant Type | Nonionic Surfactants |
| Nonionic Surfactants Share (2026) | 46.0% |
| Leading Application | Deinking |
| Deinking Share (2026) | 41.0% |
| Fastest-growing Country | China |
| China CAGR by 2036 | 8.1% |
Summary of the Paper Recycling Surfactants Market
| Market Signal | Commercial Impact |
|---|---|
| Demand and Growth Drivers | Demand for paper recycling surfactants is increasing as paper mills optimize fiber recovery, sheet quality, and process efficiency while handling increasingly variable recovered paper feedstocks.
|
| Product and Segment View | Nonionic surfactants, deinking applications, and packaging board production remain the leading market segments.
|
| Geography and Growth Outlook | Asia continues to lead market growth as expanding recycled paper production and variable recovered fiber quality increase demand for specialty process chemicals.
|
| Competitive Landscape | Competition increasingly focuses on deinking efficiency, contaminant control, formulation expertise, and technical support delivered directly to paper mills.
|
| Analyst Perspective | Paper recycling surfactants are evolving from process additives into performance-critical mill chemicals where fiber yield, contaminant management, and operational stability increasingly determine purchasing decisions.
- Nikhil Kaitwade, Principal Consultant at Future Market Insights |
Which factors support expansion in the paper recycling surfactants market?
Recovered-fiber quality control and mill service programs support market value across deinking plus stickies control and foam management workflows.
- Market value is supported by mill need to recover brightness without losing excess usable fiber during flotation.
- Packaging mills are projected to raise order volumes as paper recycling programs keep Packaging Board at 52.0% share in 2026.
- Revenue improves when chemical suppliers combine surfactant supply with on-site dosing support and furnish testing.
- Buyer retention is strengthened by programs that reduce dirt specks and foam instability alongside adhesive deposits during production.
Why is the paper recycling surfactants market growing?
Mills are using surfactants to manage ink detachment and adhesive deposits alongside foam behavior in recycled fiber lines.
Growth is supported by the cost of improving recycling infrastructure and the operating risks created by mixed recovered streams. The U.S. Environmental Protection Agency reported in August 2025 that USD 36.5 billion to USD 43.4 billion is needed to improve recycling infrastructure by 2030. That gap matters for paper recycling surfactants because inconsistent collection and sorting create variable bale quality. The same pressure supports packaging waste recycling workflows that require cleaner paper streams. Mills therefore need deinking blends and stickies-control aids plus service support that can protect runnability when incoming fiber changes.
How is the paper recycling surfactants market segmented?
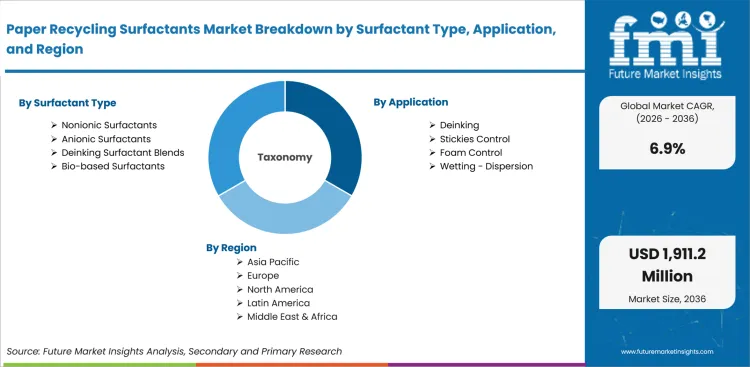
The paper recycling surfactants industry is segmented by surfactant type, application, paper grade, end use, and sales model.
- Nonionic Surfactants are projected to secure 46.0% share in 2026, led by flotation deinking needs and water-system tolerance.
- Deinking is expected to hold 41.0% application share in 2026 as deinkable inks and printed recovered grades require cleaner separation.
- Packaging Board is forecast to represent 52.0% paper grade share in 2026 due to high recovered-fiber use in paper packaging mills.
- Recycled Paper Mills are projected to account for 57.0% end-use share in 2026 as they dose surfactants directly in pulping and flotation loops.
- Chemical + Mill Service is expected to hold 61.0% sales model share in 2026 because converted paper products suppliers value trial support and dosing discipline.
Which surfactant type category holds a notable share in the paper recycling surfactants market?
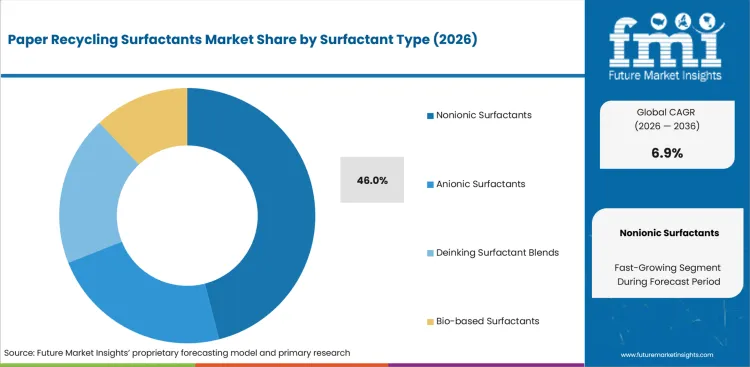
- Nonionic surfactants are projected to account for 46.0% share in 2026 due to stable wetting performance in flotation systems.
- Anionic surfactants remain relevant in dispersion and cleaning steps that need charge-based contaminant movement without excess foam.
How does the application segment perform in the paper recycling surfactants market?
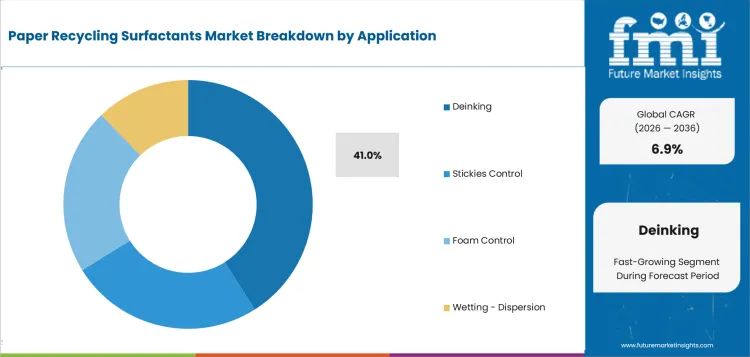
- Deinking is expected to represent 41.0% share in 2026 since printed wastepaper requires controlled ink release before flotation removal.
- Stickies control gains relevance from adhesive residues and low foaming surfactants support foam-sensitive stages in recycled fiber systems.
What drives demand across paper grade options in the paper recycling surfactants market?
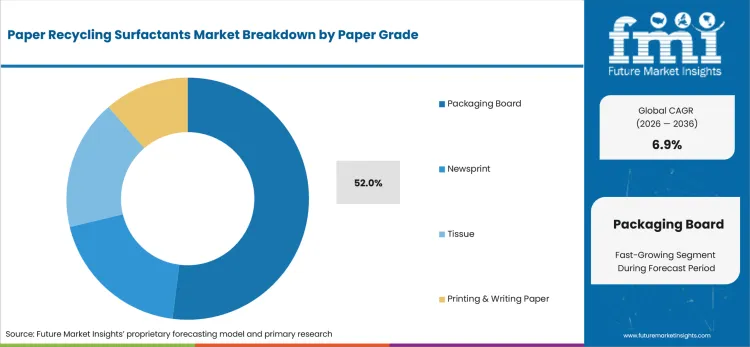
- Packaging Board is anticipated to hold 52.0% share in 2026 due to paper packaging mills using large recovered-fiber blends.
- Tissue and printing grades need cleaner deinking chemistry because visible dirt and brightness loss directly affect buyer acceptance.
Which end-use segment shows a prominent position in the paper recycling surfactants market?
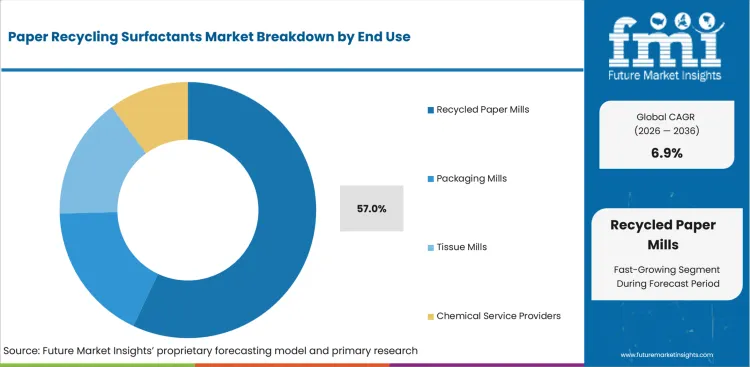
- Recycled Paper Mills are projected to represent 57.0% share in 2026 as surfactant dosing sits inside core production workflows.
- chemical testing services providers gain relevance when mills need field testing before changing surfactant packages in live operations.
How are buyers selecting across sales model options in the paper recycling surfactants market?
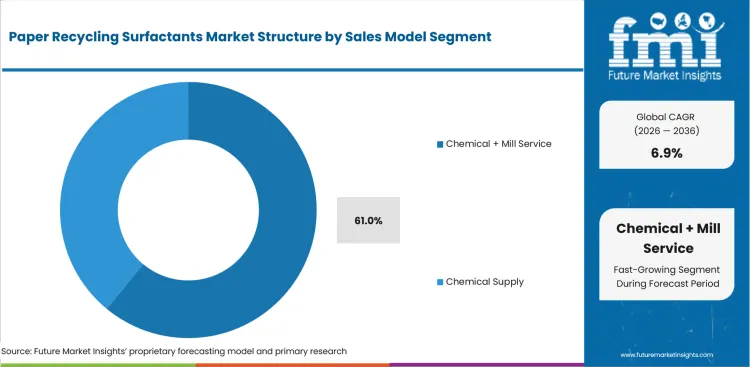
- Chemical + Mill Service is forecast to secure 61.0% share in 2026 owing to supplier support during dosing trials and troubleshooting.
- Chemical supply remains important for mills with stable furnish and in-house process teams that can manage routine dosing.
What are the drivers, restraints, and opportunities in the paper recycling surfactants market?
Recovered-fiber use supports growth while contamination and trial risk limit faster supplier switching.
- Driver: Deinking chemistry demand rises as mills process printed recovered paper containing toner and offset inks plus coating residues.
- Restraint: Feedstock contamination can raise chemical cost and reduce pulp yield during recovery and washing operations.
- Opportunity: Service-backed surfactant programs can help mills tune chemistry around local water systems and changing furnish quality.
Flotation Ink Detachment Sets the Core Demand Mechanism
Flotation deinking remains the clearest use case for paper recycling surfactants because the chemistry must detach ink without excessive fiber loss. Kao states that its de-inking agents remove printing ink during recycled paper production from waste paper. This supports demand for formulations tested against brightness and froth stability plus yield protection in mill trials.
Stickies Control Turns Contamination into a Service Need
Stickies control is both a restraint and a commercial driver because adhesive residues can create downtime and off-quality paper. Buckman states that its stickies-control products can reduce downtime and off-quality products in recycled fiber mills. That evidence explains why buyers value suppliers that diagnose deposits and adjust chemistry before production losses occur.
Bio-based Review Depends on Mill Trial Proof
Bio-based surfactants are gaining selective review only when mills can confirm yield and foam stability. Solenis noted in April 2024 that wood-based fibers can be recycled more than 25 times in ideal cases. Repeated fiber use makes chemical compatibility important because weaker fibers and contaminants raise the risk of reject losses.
Which countries are growing fastest in the paper recycling surfactants market?
China 8.1% CAGR, India 7.6% CAGR, South Korea 6.7% CAGR, United States 6.6% CAGR, Germany 6.4% CAGR, France 6.2% CAGR, United Kingdom 6.1% CAGR, and Japan 5.8% CAGR through 2036.
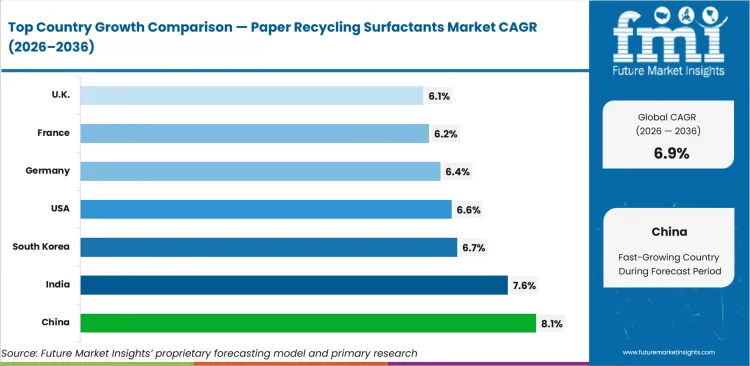
| Country | CAGR |
|---|---|
| China | 8.1% |
| India | 7.6% |
| South Korea | 6.7% |
| United States | 6.6% |
| Germany | 6.4% |
| France | 6.2% |
| United Kingdom | 6.1% |
| Japan | 5.8% |
Source: Future Market Insights, 2026.
How do country-level CAGRs compare in the paper recycling surfactants market?
China and India record the higher growth outlooks while Japan shows a steadier profile shaped by established recovered-paper systems.
- China is forecast to record 8.1% CAGR through 2036 owing to large paperboard output and domestic fiber quality needs.
- India is projected to grow at 7.6% CAGR during the forecast period, due to recycled-board mills and imported wastepaper variability.
- South Korea is expected to advance at 6.7% CAGR through 2036 due to EPR discipline and technical mill buying.
- The United States is forecast to expand at 6.6% CAGR by 2036 owing to large mill consumption of recovered paper.
- Germany is projected to post 6.4% CAGR by 2036, shaped by technical paper mills and packaging recycling expectations.
- France is expected to rise at 6.2% CAGR by 2036 as recyclable packaging recovery supports local processing.
- The United Kingdom is estimated to reach 6.1% CAGR by 2036 due to paper packaging recycling and producer reporting.
- Japan is forecast to grow at 5.8% CAGR by 2036 because paper paperboard wood recycling activity is already disciplined.
How is the paper recycling surfactants forecast developing in China?
An 8.1% CAGR through 2036 reflects large paperboard output and domestic recovered-fiber quality pressure.
Country Market Snapshot Table
| Parameter | Value |
|---|---|
| Market Size in 2025 (Value) | USD 222.0 million |
| Market Size in 2026 (Value) | USD 240.0 million |
| Market Forecast in 2036 (Value) | USD 523.0 million |
| CAGR (2026 to 2036) | 8.1% |
| Years Considered | 2021 to 2036 |
| Base Year | 2025 |
| Forecast Period | 2026 to 2036 |
| Units Considered | Value (USD million) |
| Leading Sub-Region | Yangtze River Delta and Pearl River Delta |
China Paper Recycling Surfactants Market Outlook
China presents a large volume opportunity among the selected countries because paper and paperboard output creates broad chemical demand. Mills must manage domestic recovered paper quality after waste import restrictions changed global fiber flows.
Large integrated paper groups favor direct supplier contracts and technical service programs. Surfactants are used to protect pulp cleanliness and machine stability when furnish quality varies by region.
Key Growth Drivers
- Large paperboard output creates high-volume deinking and dispersion demand. NBS-linked industry reporting showed 158.469 million tons of machine-made paper and paperboard output in 2024, creating a large addressable mill chemistry base.
- Manufacturing scale supports supplier access to large mill groups. NBS-linked reporting stated that papermaking enterprises reached 7,999 by October 2024 for a wider technical chemistry customer base.
- Packaging board and industrial papers create high-volume chemistry demand across pulping and cleaning plus flotation workflows.
- Large integrated mills favor direct contracts because production continuity and stable supply matter more than spot chemical pricing.
Key Restraints
- Variable domestic collection quality can reduce surfactant performance across provinces and mill intake routes.
- Output growth can stress recovered-fiber quality controls. NBS-linked reporting placed 2024 paper and paperboard output growth at 8.6%, which increases pressure on sorting and furnish consistency.
- Price pressure in paper and board can limit premium chemical uptake when mills focus on short-term operating margins.
What makes China unique
China is unique because production scale and domestic fiber pressure create a large need for stable recycled-paper chemistry programs.
Key Companies
- Nouryon Chemicals China
- Kemira China
- Kao Chemicals China
- Brenntag China
Sales & Marketing Channels
- Direct enterprise contracts
- Regional technical centers
- Local distributor supply
- Mill trial programs
- Integrated paper group procurement
Country Segment Breakdown Table
| Segment | Sub-Segments |
|---|---|
| By Surfactant Type | Nonionic Surfactants · Anionic Surfactants · Deinking Surfactant Blends · Bio-based Surfactants |
| By Application | Deinking · Stickies Control · Foam Control · Wetting / Dispersion |
| By Paper Grade | Newsprint · Packaging Board · Tissue · Printing & Writing Paper |
| By End Use | Recycled Paper Mills · Packaging Mills · Tissue Mills · Chemical Service Providers |
| By Sales Model | Chemical Supply · Chemical + Mill Service |
| Key Sub-Regions Covered, Manufacturing and recycling corridors | North America · Western Europe · East Asia · South Asia and Pacific |
Frequently Asked Questions
How fast is China paper recycling surfactants market growing?
Demand in China is forecast to grow at 8.1% from 2026 to 2036 due to recovered-fiber and mill chemistry needs.
Who leads China paper recycling surfactants market?
Nouryon Chemicals China and Kemira China compete alongside Kao Chemicals China and Brenntag China based on verified chemical presence and regional access.
What is driving adoption in China paper recycling surfactants market?
Adoption is supported by recycled-fiber processing needs and packaging stream quality alongside mill demand for reliable deinking performance.
How is India performing in the paper recycling surfactants market?
A 7.6% CAGR through 2036 reflects recycled-board demand and variable recovered-paper feedstock quality.
Country Market Snapshot Table
| Parameter | Value |
|---|---|
| Market Size in 2025 (Value) | USD 59.5 million |
| Market Size in 2026 (Value) | USD 64.0 million |
| Market Forecast in 2036 (Value) | USD 133.1 million |
| CAGR (2026 to 2036) | 7.6% |
| Years Considered | 2021 to 2036 |
| Base Year | 2025 |
| Forecast Period | 2026 to 2036 |
| Units Considered | Value (USD million) |
| Leading Sub-Region | Gujarat, Maharashtra, and Tamil Nadu mill clusters |
India Paper Recycling Surfactants Market Outlook
India is a fast-expanding recovered-fiber market where packaging mills handle imported and domestic wastepaper streams. Buyers focus on cost control and reliable performance alongside supplier response speed.
Local suppliers can win price-sensitive mills by offering faster delivery and smaller order sizes. Global suppliers can win larger mills when testing support and broader chemistry portfolios justify higher program costs.
Key Growth Drivers
- Imported wastepaper use creates demand for surfactants that can handle varied furnish quality. Government of India TradeStat data was available through 2025 to 2026 and was last updated on May 19, 2026 for current tracking of pulp and waste paper trade.
- Packaging demand strengthens the buyer base for recycled-board chemistry. India Brand Equity Foundation reported in August 2025 that the paper packaging market reached Rs. 167,110 crore and supported mill demand for deinking programs.
- Local suppliers can serve price-sensitive mills with faster delivery and smaller order lots plus practical trial support.
- Packaging board mills need surfactants that manage mixed grades and imported bales plus uneven domestic collection quality.
Key Restraints
- Informal collection can lower recovered-paper cleanliness and raise chemical treatment cost in recycled board mills.
- Recovered-paper dependence can intensify bale quality risk for mills. Central Pulp & Paper Research Institute reported in January 2026 that about 70% to 75% of Indian paper production relies on recovered paper, making furnish consistency a direct chemistry constraint.
- Smaller mills may under-dose surfactants to protect short-term margins, which can reduce brightness and increase reject losses.
What makes India unique
India is unique because high recycled-board demand intersects with fragmented collection and cost-sensitive mill purchasing.
Key Companies
- Venus Ethoxyethers Pvt. Ltd.
- Balaji Chem Solutions
- Nouryon India
- Kemira India
Sales & Marketing Channels
- Regional chemical distributors
- Direct mill sales
- Small-batch supplier programs
- Imported chemical dealers
- Packaging mill service contracts
Country Segment Breakdown Table
| Segment | Sub-Segments |
|---|---|
| By Surfactant Type | Nonionic Surfactants · Anionic Surfactants · Deinking Surfactant Blends · Bio-based Surfactants |
| By Application | Deinking · Stickies Control · Foam Control · Wetting / Dispersion |
| By Paper Grade | Newsprint · Packaging Board · Tissue · Printing & Writing Paper |
| By End Use | Recycled Paper Mills · Packaging Mills · Tissue Mills · Chemical Service Providers |
| By Sales Model | Chemical Supply · Chemical + Mill Service |
| Key Sub-Regions Covered, Manufacturing and recycling corridors | North America · Western Europe · East Asia · South Asia and Pacific |
Frequently Asked Questions
How fast is India paper recycling surfactants market growing?
Demand in India is forecast to grow at 7.6% from 2026 to 2036 due to recovered-fiber and mill chemistry needs.
Who leads India paper recycling surfactants market?
Venus Ethoxyethers Pvt. Ltd. and Balaji Chem Solutions compete alongside Nouryon India and Kemira India based on verified chemical presence and regional access.
What is driving adoption in India paper recycling surfactants market?
Adoption is supported by recycled-fiber processing needs and packaging stream quality alongside mill demand for reliable deinking performance.
What supports paper recycling surfactants growth in South Korea?
A 6.7% CAGR through 2036 reflects EPR discipline and quality-focused mill demand.
Country Market Snapshot Table
| Parameter | Value |
|---|---|
| Market Size in 2025 (Value) | USD 32.8 million |
| Market Size in 2026 (Value) | USD 35.0 million |
| Market Forecast in 2036 (Value) | USD 66.9 million |
| CAGR (2026 to 2036) | 6.7% |
| Years Considered | 2021 to 2036 |
| Base Year | 2025 |
| Forecast Period | 2026 to 2036 |
| Units Considered | Value (USD million) |
| Leading Sub-Region | Seoul Capital Area and southern industrial corridors |
South Korea Paper Recycling Surfactants Market Outlook
South Korea is a compliance-driven market where packaging recovery obligations influence recovered-fiber processing. Mills and reprocessors buy chemistry around reliable output and documentation plus technical credibility.
Supplier access depends on regional distribution and proof of performance in defined paper-pack and packaging streams. The market is smaller than China but procurement remains technically demanding.
Key Growth Drivers
- EPR obligations support steady pressure to process packaging materials correctly. Korea Environment Corporation identifies 4 mandatory recycling packaging materials that include paper packs under the national EPR framework.
- Policy history supports structured recycling discipline. A 2025 Korea EPR presentation stated that the system was introduced in 2003, reinforcing long-running compliance expectations for packaging materials.
- Paper pack recycling needs wetting and dispersion support for layered fiber streams that require stable recovered-pulp preparation.
- Quality-focused mills favor chemistry suppliers that provide technical service and documentation alongside local distributor support.
Key Restraints
- Public supplier evidence is thinner than in Japan or the United States, limiting confidence in some country-specific company lists.
- Obligation fees can add cost pressure when companies miss recycling duties. Korea Environment Corporation states that a recycling fee is imposed on parties that fail to fulfill EPR obligations.
- Smaller domestic mill pools can limit trial frequency for new surfactant blends and service-backed programs.
What makes South Korea unique
South Korea is unique because recycling obligations and fee discipline support technical chemistry use in defined packaging streams.
Key Companies
- Kemira Korea
- BASF Korea
- Evonik Korea
- Brenntag Korea
Sales & Marketing Channels
- Distributor-led chemical supply
- Direct mill trials
- EPR compliance networks
- Regional paper group procurement
- Technical service visits
Country Segment Breakdown Table
| Segment | Sub-Segments |
|---|---|
| By Surfactant Type | Nonionic Surfactants · Anionic Surfactants · Deinking Surfactant Blends · Bio-based Surfactants |
| By Application | Deinking · Stickies Control · Foam Control · Wetting / Dispersion |
| By Paper Grade | Newsprint · Packaging Board · Tissue · Printing & Writing Paper |
| By End Use | Recycled Paper Mills · Packaging Mills · Tissue Mills · Chemical Service Providers |
| By Sales Model | Chemical Supply · Chemical + Mill Service |
| Key Sub-Regions Covered, Manufacturing and recycling corridors | North America · Western Europe · East Asia · South Asia and Pacific |
Frequently Asked Questions
How fast is South Korea paper recycling surfactants market growing?
Demand in South Korea is forecast to grow at 6.7% from 2026 to 2036 due to recovered-fiber and mill chemistry needs.
Who leads South Korea paper recycling surfactants market?
Kemira Korea and BASF Korea compete alongside Evonik Korea and Brenntag Korea based on verified chemical presence and regional access.
What is driving adoption in South Korea paper recycling surfactants market?
Adoption is supported by recycled-fiber processing needs and packaging stream quality alongside mill demand for reliable deinking performance.
How fast is the paper recycling surfactants market growing in the United States?
A 6.6% CAGR through 2036 reflects large recovered-paper use and service-backed mill chemistry demand.
Country Market Snapshot Table
| Parameter | Value |
|---|---|
| Market Size in 2025 (Value) | USD 192.3 million |
| Market Size in 2026 (Value) | USD 205.0 million |
| Market Forecast in 2036 (Value) | USD 388.4 million |
| CAGR (2026 to 2036) | 6.6% |
| Years Considered | 2021 to 2036 |
| Base Year | 2025 |
| Forecast Period | 2026 to 2036 |
| Units Considered | Value (USD million) |
| Leading Sub-Region | Midwest, Southeast, and Gulf Coast mill corridors |
United States Paper Recycling Surfactants Market Outlook
United States demand is shaped by high recycled-paper use and a mill base that already buys process chemicals around yield protection. Buyers test surfactants against brightness and foam stability alongside dirt count and deposit control before wider adoption.
Direct mill sales remain important because site water chemistry and recovered-paper quality vary across operating regions. Suppliers with field technicians and application labs can defend accounts after a stable surfactant program is proven.
Key Growth Drivers
- USA mills create a large demand base for deinking and dispersion chemistry. AF&PA reported in August 2025 that mills consumed 32.7 million tons of recycled paper in 2024, keeping surfactant programs tied to continuous mill operations.
- E-commerce supports corrugated packaging demand and recycled-board furnish. The U.S. Census Bureau reported in May 2026 that first-quarter retail e-commerce sales reached USD 326.7 billion, supporting packaging flows that later enter recovery streams.
- Large mills favor supplier programs that reduce production breaks and improve finished-sheet quality under changing recovered-fiber conditions.
- Corporate mill purchasing supports longer contracts because consistent chemistry reduces operational risk across multi-site paper groups.
Key Restraints
- Single-stream collection can raise contaminant load and reduce surfactant efficiency during pulping and flotation operations.
- Recycling infrastructure remains uneven across collection and processing routes. EPA reported in August 2025 that USD 36.5 billion to USD 43.4 billion is needed to improve USA recycling infrastructure by 2030, reinforcing feedstock quality risk.
- Export market shifts can alter recovered-paper quality and pricing for domestic mills that depend on predictable bale streams.
What makes United States unique
The United States is unique because large recovered-paper tonnage combines with service-intensive mill procurement and regional furnish variability.
Key Companies
- Buckman
- Solenis LLC
- Kemira Chemicals Inc.
- BASF Corporation
Sales & Marketing Channels
- Direct mill technical sales
- Regional chemical distributors
- Paper mill trial programs
- Corporate mill supply agreements
- Field service contracts
Country Segment Breakdown Table
| Segment | Sub-Segments |
|---|---|
| By Surfactant Type | Nonionic Surfactants · Anionic Surfactants · Deinking Surfactant Blends · Bio-based Surfactants |
| By Application | Deinking · Stickies Control · Foam Control · Wetting / Dispersion |
| By Paper Grade | Newsprint · Packaging Board · Tissue · Printing & Writing Paper |
| By End Use | Recycled Paper Mills · Packaging Mills · Tissue Mills · Chemical Service Providers |
| By Sales Model | Chemical Supply · Chemical + Mill Service |
| Key Sub-Regions Covered, Manufacturing and recycling corridors | North America · Western Europe · East Asia · South Asia and Pacific |
Frequently Asked Questions
How fast is United States paper recycling surfactants market growing?
Demand in United States is forecast to grow at 6.6% from 2026 to 2036 due to recovered-fiber and mill chemistry needs.
Who leads United States paper recycling surfactants market?
Buckman and Solenis LLC compete alongside Kemira Chemicals Inc. and BASF Corporation based on verified chemical presence and regional access.
What is driving adoption in United States paper recycling surfactants market?
Adoption is supported by recycled-fiber processing needs and packaging stream quality alongside mill demand for reliable deinking performance.
How is Germany performing in the paper recycling surfactants market?
A 6.4% CAGR through 2036 reflects technical mill expectations and mature packaging recovery systems.
Country Market Snapshot Table
| Parameter | Value |
|---|---|
| Market Size in 2025 (Value) | USD 84.6 million |
| Market Size in 2026 (Value) | USD 90.0 million |
| Market Forecast in 2036 (Value) | USD 167.4 million |
| CAGR (2026 to 2036) | 6.4% |
| Years Considered | 2021 to 2036 |
| Base Year | 2025 |
| Forecast Period | 2026 to 2036 |
| Units Considered | Value (USD million) |
| Leading Sub-Region | North Rhine-Westphalia, Bavaria, and Saxony mill corridors |
Germany Paper Recycling Surfactants Market Outlook
Germany is a quality-driven recycled-paper chemistry market where buyers focus on runnability and measurable process outcomes. Surfactant suppliers must connect chemistry performance to lower downtime and cleaner pulp plus stable paper strength.
Local specialty chemical depth supports technical procurement because mills can access application labs and distributor networks. Buyers still require proof of payback before changing programs in established recycled-fiber operations.
Key Growth Drivers
- Packaging recovery keeps recovered fiber central to German mill operations. The European Environment Agency reported in March 2025 that Germany’s overall packaging waste recycling rate stood at 69% in 2022, with paper and cardboard influencing the result.
- Industrial output signals support demand from converting and packaging supply chains. Destatis reported in January 2026 that German production rose 0.8% month on month in November 2025, supporting chemical demand tied to manufacturing activity.
- German chemical suppliers give mills access to local testing and technical support plus documentation for deinking programs.
- High recycled-fiber use in packaging papers keeps surfactant selection focused on sheet quality and deposit prevention.
Key Restraints
- Mature recycling systems leave less room for easy volume gains from new recovered-fiber penetration.
- Operating-cost scrutiny remains tight for mills evaluating specialty chemicals. Destatis reported in June 2026 that producer prices were 2.2% higher in May 2026 than one year earlier, reinforcing payback pressure.
- Buyers may avoid supplier switches unless trial data proves stable performance under site-specific water chemistry.
What makes Germany unique
Germany is unique because technically demanding mills combine high recovered-fiber use with well-established local specialty chemical support.
Key Companies
- BASF SE
- Evonik Industries AG
- Nouryon Chemicals GmbH
- Kemira Germany GmbH
Sales & Marketing Channels
- Direct mill contracts
- Technical application labs
- Specialty chemical distributors
- Packaging-board producer relationships
- Field dosing audits
Country Segment Breakdown Table
| Segment | Sub-Segments |
|---|---|
| By Surfactant Type | Nonionic Surfactants · Anionic Surfactants · Deinking Surfactant Blends · Bio-based Surfactants |
| By Application | Deinking · Stickies Control · Foam Control · Wetting / Dispersion |
| By Paper Grade | Newsprint · Packaging Board · Tissue · Printing & Writing Paper |
| By End Use | Recycled Paper Mills · Packaging Mills · Tissue Mills · Chemical Service Providers |
| By Sales Model | Chemical Supply · Chemical + Mill Service |
| Key Sub-Regions Covered, Manufacturing and recycling corridors | North America · Western Europe · East Asia · South Asia and Pacific |
Frequently Asked Questions
How fast is Germany paper recycling surfactants market growing?
Demand in Germany is forecast to grow at 6.4% from 2026 to 2036 due to recovered-fiber and mill chemistry needs.
Who leads Germany paper recycling surfactants market?
BASF SE and Evonik Industries AG compete alongside Nouryon Chemicals GmbH and Kemira Germany GmbH based on verified chemical presence and regional access.
What is driving adoption in Germany paper recycling surfactants market?
Adoption is supported by recycled-fiber processing needs and packaging stream quality alongside mill demand for reliable deinking performance.
What is shaping paper recycling surfactants demand in France?
A 6.2% CAGR through 2036 reflects EPR-backed recovery and household packaging stream complexity.
Country Market Snapshot Table
| Parameter | Value |
|---|---|
| Market Size in 2025 (Value) | USD 36.7 million |
| Market Size in 2026 (Value) | USD 39.0 million |
| Market Forecast in 2036 (Value) | USD 71.2 million |
| CAGR (2026 to 2036) | 6.2% |
| Years Considered | 2021 to 2036 |
| Base Year | 2025 |
| Forecast Period | 2026 to 2036 |
| Units Considered | Value (USD million) |
| Leading Sub-Region | Grand Est, Hauts-de-France, and Auvergne-Rhone-Alpes clusters |
France Paper Recycling Surfactants Market Outlook
France demand is shaped by household packaging recovery and graphic paper recycling under producer responsibility systems. Mills processing consumer-facing streams need surfactants that improve ink removal and deposit control.
Supplier access often depends on distributor networks and technical support for reprocessors. Buyers value clear recyclability documentation and mill evidence before expanding specialty chemical programs.
Key Growth Drivers
- Household packaging recovery supports consistent recovered-fiber feedstock for mills. Citeo reported a 69% recycling rate for household packaging in 2024, which supports demand for deinking and dispersion chemistry.
- EPR fee structures encourage cleaner and more recyclable fiber-based packaging across producer and recycler decisions.
- Reprocessor partnerships support chemical trials because household streams require practical contaminant-control proof before scale-up.
Key Restraints
- Mixed household streams can raise dirt count and chemical treatment needs during recycled pulp preparation.
- France remains under pressure to improve waste management outcomes. The European Environment Agency stated in October 2024 that France was at risk of missing 2025 municipal waste recycling targets, reinforcing collection-quality constraints.
- Buyers may prefer proven supplier programs over new formulations that lack local trial evidence.
What makes France unique
France is unique because household packaging recovery and graphic paper recycling intersect with producer responsibility in one buying environment.
Key Companies
- Solenis France
- BASF France
- Kemira France
- Brenntag France
Sales & Marketing Channels
- Mill-direct chemical sales
- EPR-linked technical advisory
- Distributor-led supply
- Reprocessor partnerships
- Packaging compliance channels
Country Segment Breakdown Table
| Segment | Sub-Segments |
|---|---|
| By Surfactant Type | Nonionic Surfactants · Anionic Surfactants · Deinking Surfactant Blends · Bio-based Surfactants |
| By Application | Deinking · Stickies Control · Foam Control · Wetting / Dispersion |
| By Paper Grade | Newsprint · Packaging Board · Tissue · Printing & Writing Paper |
| By End Use | Recycled Paper Mills · Packaging Mills · Tissue Mills · Chemical Service Providers |
| By Sales Model | Chemical Supply · Chemical + Mill Service |
| Key Sub-Regions Covered, Manufacturing and recycling corridors | North America · Western Europe · East Asia · South Asia and Pacific |
Frequently Asked Questions
How fast is France paper recycling surfactants market growing?
Demand in France is forecast to grow at 6.2% from 2026 to 2036 due to recovered-fiber and mill chemistry needs.
Who leads France paper recycling surfactants market?
Solenis France and BASF France compete alongside Kemira France and Brenntag France based on verified chemical presence and regional access.
What is driving adoption in France paper recycling surfactants market?
Adoption is supported by recycled-fiber processing needs and packaging stream quality alongside mill demand for reliable deinking performance.
What supports paper recycling surfactants growth in the United Kingdom?
A 6.1% CAGR through 2036 is supported by paper-cardboard recycling and packaging compliance pressure.
Country Market Snapshot Table
| Parameter | Value |
|---|---|
| Market Size in 2025 (Value) | USD 39.6 million |
| Market Size in 2026 (Value) | USD 42.0 million |
| Market Forecast in 2036 (Value) | USD 75.9 million |
| CAGR (2026 to 2036) | 6.1% |
| Years Considered | 2021 to 2036 |
| Base Year | 2025 |
| Forecast Period | 2026 to 2036 |
| Units Considered | Value (USD million) |
| Leading Sub-Region | Midlands, North West, and Yorkshire recycling corridors |
United Kingdom Paper Recycling Surfactants Market Outlook
United Kingdom demand is shaped by packaging recycling performance and stricter producer reporting obligations. Mills and reprocessors need chemistry that can manage paper-cardboard streams while preserving pulp cleanliness.
Retail and producer responsibility channels affect buying because packaging data now carries more commercial scrutiny. Suppliers must show how deinking and stickies-control programs improve recovery outcomes without raising wastewater burden.
Key Growth Drivers
- Paper-cardboard recycling provides a considerable feedstock base for recovered-fiber processing. DEFRA reported in July 2025 that paper and cardboard reached a 74.3% packaging recycling rate in 2024, supporting local mill and reprocessor activity.
- Producer responsibility funding is expected to improve recycling service discipline. A UK Parliament briefing in January 2026 cited a government estimate that the cost shift to producers will total around GBP 1.2 billion annually.
- Reprocessors need chemicals that manage mixed packaging streams and printed grades before recovered pulp enters papermaking systems.
- Supplier documentation helps buyers compare surfactant programs under compliance-led procurement and producer reporting expectations.
Key Restraints
- Wet collection conditions can lower fiber quality and raise chemical treatment cost in pulping and cleaning stages.
- Overall packaging recovery leaves room for quality gaps across material streams. DEFRA reported in July 2025 that 64.1% of UK packaging waste was recycled in 2024, showing why mills still face mixed-feedstock risk.
- Smaller mills may delay trials if chemical savings are hard to prove during short production windows.
What makes United Kingdom unique
The United Kingdom is unique because producer responsibility reporting connects packaging compliance with recovered-fiber quality expectations.
Key Companies
- Solenis UK Industries
- Kemira Chemicals UK
- Brenntag UK & Ireland
- BASF plc
Sales & Marketing Channels
- Direct reprocessor sales
- Paper mill service visits
- Compliance-led supplier pitches
- Distributor-supported chemical supply
- Packaging recycler partnerships
Country Segment Breakdown Table
| Segment | Sub-Segments |
|---|---|
| By Surfactant Type | Nonionic Surfactants · Anionic Surfactants · Deinking Surfactant Blends · Bio-based Surfactants |
| By Application | Deinking · Stickies Control · Foam Control · Wetting / Dispersion |
| By Paper Grade | Newsprint · Packaging Board · Tissue · Printing & Writing Paper |
| By End Use | Recycled Paper Mills · Packaging Mills · Tissue Mills · Chemical Service Providers |
| By Sales Model | Chemical Supply · Chemical + Mill Service |
| Key Sub-Regions Covered, Manufacturing and recycling corridors | North America · Western Europe · East Asia · South Asia and Pacific |
Frequently Asked Questions
How fast is United Kingdom paper recycling surfactants market growing?
Demand in United Kingdom is forecast to grow at 6.1% from 2026 to 2036 due to recovered-fiber and mill chemistry needs.
Who leads United Kingdom paper recycling surfactants market?
Solenis UK Industries and Kemira Chemicals UK compete alongside Brenntag UK & Ireland and BASF plc based on verified chemical presence and regional access.
What is driving adoption in United Kingdom paper recycling surfactants market?
Adoption is supported by recycled-fiber processing needs and packaging stream quality alongside mill demand for reliable deinking performance.
What is the paper recycling surfactants market forecast for Japan?
A 5.8% CAGR through 2036 reflects disciplined recovery systems and quality-focused mill procurement.
Country Market Snapshot Table
| Parameter | Value |
|---|---|
| Market Size in 2025 (Value) | USD 68.1 million |
| Market Size in 2026 (Value) | USD 72.0 million |
| Market Forecast in 2036 (Value) | USD 126.5 million |
| CAGR (2026 to 2036) | 5.8% |
| Years Considered | 2021 to 2036 |
| Base Year | 2025 |
| Forecast Period | 2026 to 2036 |
| Units Considered | Value (USD million) |
| Leading Sub-Region | Kanto, Kansai, and Chubu paper corridors |
Japan Paper Recycling Surfactants Market Outlook
Japan demand is shaped by recovered-paper utilization discipline and local chemical suppliers with direct paper process relevance. Mills focus on ink specks and flotation behavior plus finished-sheet quality more than simple volume expansion.
Long-term supplier trust matters because Japanese mills typically require careful validation before changing process chemistry. Kao and Harima give the country a direct supplier base for deinking and paper chemical programs.
Key Growth Drivers
- Recovered-paper utilization targets support stable deinking and wetting chemistry demand. The Japan Paper Association states that the industry targets a 65% recovered paper utilization rate by fiscal 2025 ending March 31, 2026.
- Large paper groups reinforce disciplined recovered-fiber use. Oji Holdings reported that its recovered paper utilization ratio reached 67.4% in fiscal 2024, supporting continued demand for paper process chemistry.
- Domestic chemical know-how supports application-specific deinking and process improvement for high-quality recycled paper grades.
- Strict quality expectations favor surfactants with proven performance in clean fiber systems and controlled mill water conditions.
Key Restraints
- Mature utilization rates limit easy expansion from new recovered-fiber volume in established paper systems.
- Containerboard already uses high recovered-paper content in leading groups. Oji Holdings reported a 98.3% recovered paper utilization ratio for containerboard in fiscal 2024, limiting additional volume upside in that grade.
- Buyers may avoid formulation switches without long qualification cycles and site-specific performance evidence from supervised production trials.
What makes Japan unique
Japan is unique because disciplined recovered-paper collection works alongside local suppliers active in deinking and paper process chemistry.
Key Companies
- Kao Corporation
- Harima Chemicals Group
- Oji Holdings Corporation
- Nippon Paper Industries
Sales & Marketing Channels
- Direct mill sales
- Long-term technical supply
- Trial-based formulation approval
- Regional chemical distributors
- Paper association networks
Country Segment Breakdown Table
| Segment | Sub-Segments |
|---|---|
| By Surfactant Type | Nonionic Surfactants · Anionic Surfactants · Deinking Surfactant Blends · Bio-based Surfactants |
| By Application | Deinking · Stickies Control · Foam Control · Wetting / Dispersion |
| By Paper Grade | Newsprint · Packaging Board · Tissue · Printing & Writing Paper |
| By End Use | Recycled Paper Mills · Packaging Mills · Tissue Mills · Chemical Service Providers |
| By Sales Model | Chemical Supply · Chemical + Mill Service |
| Key Sub-Regions Covered, Manufacturing and recycling corridors | North America · Western Europe · East Asia · South Asia and Pacific |
Frequently Asked Questions
How fast is Japan paper recycling surfactants market growing?
Demand in Japan is forecast to grow at 5.8% from 2026 to 2036 due to recovered-fiber and mill chemistry needs.
Who leads Japan paper recycling surfactants market?
Kao Corporation and Harima Chemicals Group compete alongside Oji Holdings Corporation and Nippon Paper Industries based on verified chemical presence and regional access.
What is driving adoption in Japan paper recycling surfactants market?
Adoption is supported by recycled-fiber processing needs and packaging stream quality alongside mill demand for reliable deinking performance.
Who are the leading companies in the paper recycling surfactants market?
Kemira and Solenis are profiled alongside Buckman and Kao Corporation as primary suppliers in the market.
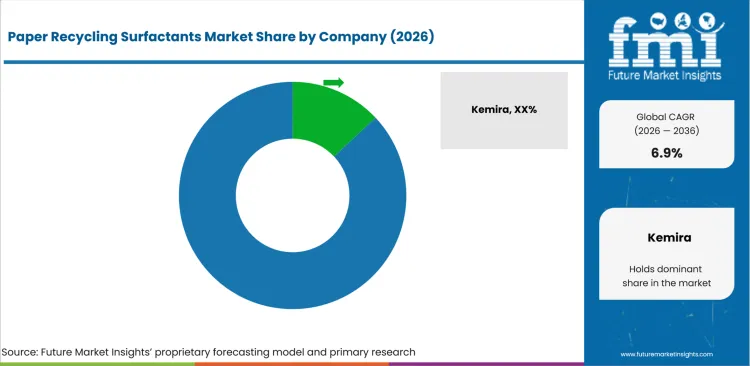
- Competition is shaped by deinking performance and stickies-control credibility plus field service reach across recycled-fiber mills.
- Large suppliers defend accounts by combining paper chemistry portfolios with technical support and mill trial documentation.
- Regional specialists compete on faster delivery and smaller order flexibility plus local understanding of recovered-paper furnish variation.
- New supplier entry remains difficult because mills test chemistry under live conditions before replacing stable programs.
Competition in the paper recycling surfactants market is built around mill problem solving instead of chemical volume alone. Buckman offers repulping and deinking chemistries for recycled fiber and positions its programs around brightness and yield. Solenis and Kemira compete alongside Kao by connecting paper chemistry expertise with field application support. This gives larger suppliers an advantage when mills need proven flotation behavior and deposit-control troubleshooting.
Capacity and distribution reach plus regional service access is important because mills operate continuously and avoid supply risk. Kemira announced in March 2025 a multi-million Euro expansion for paper and board chemical capacity in Thailand, with new capacity expected in August 2026. Regional suppliers such as Venus Ethoxyethers and Balaji Chem Solutions can serve Indian mills that need faster delivery and practical dosing support.
Companies are likely to be positioned as they can show direct relevance to deinking and foam control plus stickies management. Kao lists de-inking agents for flotation systems while Harima describes deinking-related process agents for recycled paper. Suppliers that prove mill outcomes and keep regional technical teams close to accounts should gain steadier account retention.
How do top paper recycling surfactants market companies compare?
Companies compare by deinking formulation depth and stickies-control coverage plus mill service reach and regional supply access.
| Company | Portfolio/Focus | Account Access | Footprint/Service Reach |
|---|---|---|---|
| Buckman | Repulping, deinking, and stickies control | Direct mill technical teams | Global pulp and paper reach |
| Kao Corporation | De-inking agents for flotation systems | Japan and Asia customer access | Asia-Pacific and global distribution |
| Harima Chemicals | Deinking process agents and pitch control | Japan-based paper chemistry access | Japan and selected overseas markets |
| Solenis | Contaminant control and pulp-paper chemistry | Direct mill and enterprise accounts | Global paper mill service network |
| Kemira | Pulp, paper, and board chemical programs | Large mill and regional contracts | Global with APAC capacity expansion |
| Evonik | Surfactant and adjacent deinking chemistry | Specialty chemical accounts | Global specialty chemical footprint |
| Nouryon | Specialty chemicals and pulp chemicals | Regional industrial customers | Global specialty chemical footprint |
| Venus Ethoxyethers | Deinking chemicals and defoamers | India mill and distributor access | India-focused service reach |
| BASF | Surfactants and specialty chemical inputs | Industrial chemical accounts | Global manufacturing and distribution |
Source: Future Market Insights, 2026.
Who are the key players in the paper recycling surfactants market?
The supplier base includes global paper chemistry companies and deinking specialists alongside regional surfactant formulators.
Key global companies leading the paper recycling surfactants market include:
- Kemira
- Solenis
- Buckman
- Kao Corporation
- Harima Chemicals Group
- Evonik Industries
- Nouryon
- Venus Ethoxyethers
- BASF
- Aurora Specialty Chemistries
Key Developments in Paper Recycling Surfactants Market
- In March 2025, Kemira announced a multi-million Euro expansion of paper and board chemical capacity at its Wellgrow site in Thailand.
- In April 2024, Solenis published fiber-cycle guidance describing ink and stickies plus glue and barrier coatings as contaminants in recycled fiber.
- In March 2025, Evonik released TEGO Res 1100 for deinking in packaging recycling and showed adjacent chemistry movement around ink removal.
Key Players in the Paper Recycling Surfactants Market
Global Formulators
- Kemira
- Solenis
- Buckman
- Kao Corporation
- Harima Chemicals Group
- Evonik Industries
- Nouryon
- BASF
Regional and Application Specialists
- Venus Ethoxyethers Pvt. Ltd.
- Balaji Chem Solutions
- Aurora Specialty Chemistries
- Brenntag Specialties
Adjacent Chemistry Suppliers
- Brenntag Specialties
- IMCD Group
- Univar Solutions
- Balaji Chem Solutions
Paper Recycling Surfactants Market - Report Scope
| Parameter | Details |
|---|---|
| Forecast period | 2026 to 2036 |
| Historical period | 2021 to 2025 |
| Quantitative unit | Value in USD million |
| By surfactant type | Nonionic Surfactants, Anionic Surfactants, Deinking Surfactant Blends, Bio-based Surfactants |
| By application | Deinking, Stickies Control, Foam Control, Wetting / Dispersion |
| By paper grade | Newsprint, Packaging Board, Tissue, Printing & Writing Paper |
| By end use | Recycled Paper Mills, Packaging Mills, Tissue Mills, Chemical Service Providers |
| By sales model | Chemical Supply, Chemical + Mill Service |
| Regions covered | North America, Western Europe, East Asia, and South Asia and Pacific |
| Countries covered | United States, United Kingdom, Germany, France, Japan, China, South Korea, and India |
| Key companies profiled | Kemira, Solenis, Buckman, Kao Corporation, Harima Chemicals Group, Evonik Industries, Nouryon, Venus Ethoxyethers, and BASF |
| Approach | Bottom-up demand modeling using recovered-fiber processing demand, surfactant application mix, supplier portfolio review, and country-level validation |
Source: Future Market Insights, 2026.
What is the scope and definition of the paper recycling surfactants market?
| Scope Item | Definition |
|---|---|
| Market Definition | Surface-active chemicals used in recycled paper mills to detach ink, disperse contaminants, manage foam, and improve wetting during pulp cleaning. |
| Functions Covered | Ink detachment, flotation support, stickies control, foam control, wetting, and dispersion. |
| Applications Covered | Deinking, stickies control, foam control, and wetting or dispersion in recovered-fiber processing. |
| End-Use Industries | Recycled paper mills, packaging mills, tissue mills, and chemical service providers. |
| Grades Covered | Newsprint, packaging board, tissue, and printing and writing paper. |
| Inclusions | Nonionic surfactants, anionic surfactants, deinking blends, and bio-based surfactants used in paper recycling. |
| Exclusions | Virgin pulp bleaching chemicals, coating binders, retention aids outside recycling, sizing agents, and general industrial cleaners. |
How was the paper recycling surfactants market research conducted?
| Methodology Item | Approach |
|---|---|
| Primary Research | FMI analysts reviewed mill buying patterns, supplier portfolios, paper-grade needs, and service practices across recycled fiber workflows. |
| Desk Research | Desk research used official recycling data, association releases, supplier product pages, company announcements, and technical references. |
| Market Sizing & Forecasting | The model combined recovered-fiber processing volumes, surfactant use rates, application mix, country intensity, and service-based spending. |
| Data Validation | Forecasts were checked against recycling rates, recovered-paper consumption, supplier capabilities, and country-level mill structures. |
Paper Recycling Surfactants Market Breakdown by Surfactant Type, Application, Paper Grade, End Use, Sales Model, and Region
Paper Recycling Surfactants Market Segmented by Surfactant Type
- Nonionic Surfactants
- Anionic Surfactants
- Deinking Surfactant Blends
- Bio-based Surfactants
Paper Recycling Surfactants Market Segmented by Application
- Deinking
- Stickies Control
- Foam Control
- Wetting / Dispersion
Paper Recycling Surfactants Market Segmented by Paper Grade
- Newsprint
- Packaging Board
- Tissue
- Printing & Writing Paper
Paper Recycling Surfactants Market Segmented by End Use
- Recycled Paper Mills
- Packaging Mills
- Tissue Mills
- Chemical Service Providers
Paper Recycling Surfactants Market Segmented by Sales Model
- Chemical Supply
- Chemical + Mill Service
Paper Recycling Surfactants Market by Region
- North America
- United States
- Western Europe
- Germany
- France
- United Kingdom
- East Asia
- China
- Japan
- South Korea
- South Asia and Pacific
- India
Research Sources and Bibliography
- American Forest & Paper Association. (2025, August 12). Paper industry announces 2024 USA paper recycling rates. American Forest & Paper Association.
- European Paper Recycling Council. (2025, July 11). European Paper Recycling Council reports strong recycling rates for 2024. Confederation of European Paper Industries.
- U.S. Environmental Protection Agency. (2025, August 6). USA recycling infrastructure assessment and state data collection reports. U.S. Environmental Protection Agency.
- U.S. Census Bureau. (2026, May 18). Quarterly retail e-commerce sales, first quarter 2026. U.S. Department of Commerce.
- Department for Environment, Food & Rural Affairs. (2025, July 23). UK statistics on waste. Government of the United Kingdom.
- House of Commons Library. (2026, January 13). Packaging extended producer responsibility. UK Parliament.
- European Environment Agency. (2025, March). Germany municipal and packaging waste management country profile. European Environment Agency.
- Federal Ministry for the Environment, Nature Conservation, Nuclear Safety and Consumer Protection. (2025, December 19). Total packaging. Government of Germany.
- Federal Statistical Office of Germany. (2026, January 9). Production in November 2025. Destatis.
- Federal Statistical Office of Germany. (2026, June 19). Producer prices in May 2026. Destatis.
- Citeo. (2025). Why join Citeo? Citeo.
- European Environment Agency. (2024, October 10). France municipal and packaging waste management country profile. European Environment Agency.
- Japan Paper Association. (2025). Target of 65% of recovered paper utilization rate. Japan Paper Association.
- Oji Holdings Corporation. (2025). Resource circulation: Recovered paper. Oji Holdings Corporation.
- National Bureau of Statistics of China. (2025). Machine-made paper and paperboard production data cited in 2024 industry reporting. Government of China.
- Korea Environment Corporation. (2025, October). K-Circular Economy: Turning waste into resources. Korea Environment Corporation.
- Government of India, Ministry of Commerce and Industry. (2026, May 19). TradeStat India export import data bank. Department of Commerce.
- Central Pulp & Paper Research Institute. (2026, January 11). Annual report 2024-25. Central Pulp & Paper Research Institute.
- India Brand Equity Foundation. (2025, August). India paper and packaging industry overview. India Brand Equity Foundation.
- Buckman. (2025). Stickies control chemicals for pulp, paper, and recycled fiber. Buckman.
- Kao Chemicals. (2025). Pulp and paper business fields. Kao Chemicals.
- Kao Chemicals. (2025). De-inking agent for recycling waste paper. Kao Chemicals.
- Harima Chemicals Group. (2025). Paper chemicals business. Harima Chemicals Group.
- Solenis. (2024, April 9). The fiber cycle: Challenges and solutions. Solenis.
- Solenis. (2025). Contaminant control agents for papermaking. Solenis.
- Kemira. (2025, March 20). Kemira invests in the expansion of paper and board chemical capacity in Thailand. Kemira.
- Evonik Industries. (2025, March 18). TEGO Res 1100 improves plastic waste deinking. Evonik Industries.
- Brenntag. (2025, January 22). Brenntag Specialties expands distribution agreement with Kao Chemicals Europe. Brenntag.
- Venus Ethoxyethers. (2025). Paper chemicals and de-inking agents. Venus Ethoxyethers.
The bibliography is provided for reader reference and uses primary company information plus government data and official industry publications.
This Report Answers
- What is the current and future size of the paper recycling surfactants market from 2026 to 2036?
- Which surfactant type is projected to lead demand in recovered-paper processing and flotation deinking?
- Which application areas create the most relevant demand for deinking and contaminant-control chemistry across recovered-paper mills?
- How do stickies and ink residues influence mill buying decisions across mixed recovered fiber streams?
- Which countries are forecast to grow faster due to recovered-fiber use and packaging-board demand during the assessment period?
- Which companies have verified relevance in deinking and stickies control across paper chemistry supply programs?
- How does the report define paper recycling surfactants within the broader recycling chemicals category used by mills?
- How does FMI size and validate demand for paper recycling surfactants across countries and applications?
Frequently Asked Questions
How large is the Paper Recycling Surfactants Market expected to be in the near term?
The market is expanding as recycled fiber processing increases and mills rely on surfactants to protect pulp quality and yield.
What is the long term outlook for the Paper Recycling Surfactants Market?
The outlook remains positive as packaging demand and recycling targets keep recovered fiber chemistry central to mill operations.
How fast is the Paper Recycling Surfactants Market expected to grow?
Growth is driven by higher use of recovered paper and the need for stable deinking and contaminant control performance.
What is the main driver of paper recycling surfactant demand?
Demand is supported by flotation deinking and stickies control required to manage inks and adhesives in recycled fiber streams.
Which surfactant type dominates the market?
Nonionic surfactants dominate because they provide stable wetting and foam behavior in flotation deinking systems.
Which application generates the highest demand?
Deinking leads demand as mills focus on ink removal while protecting usable fiber yield and brightness.
Which paper grade contributes most to demand?
Packaging board leads because containerboard and paperboard mills process large volumes of recovered fiber.
Which end use segment is most important?
Recycled paper mills dominate since surfactants are dosed directly into pulping, cleaning, and flotation loops.
Which sales model is most widely used?
Chemical supply combined with mill service leads because mills value trial support and on site dosing optimization.
Which regions show strong adoption of paper recycling surfactants?
East Asia, South Asia, North America, and Europe show strong adoption due to high recycled fiber use and packaging output.
Which countries are key markets for paper recycling surfactants?
China, India, the United States, South Korea, Germany, France, the United Kingdom, and Japan are key markets.
What supports China’s leading growth momentum?
Large paperboard production and pressure on domestic recovered fiber quality drive surfactant demand.
Why is India an important growth market?
High recycled board demand and variable wastepaper quality increase the need for effective deinking chemistry.
What drives demand in the United States?
Large recovered paper consumption and service backed mill chemistry programs support steady surfactant use.
What restrains faster growth in the paper recycling surfactants market?
Feedstock contamination and trial risk can slow supplier switching and increase chemical treatment cost.
What does the Paper Recycling Surfactants Market include?
The market includes surfactants used for deinking and stickies control plus foam control and wetting during recovered paper processing.
Preview the report firsthand - request a free sample
Get SampleGet the brochure for pricing and purchase details.
Get PDFTable of Content
- Key Takeaways
- Market Size and CAGR
- Top Growth Driver
- Fastest Growing Segment
- Leading Region
- Key Companies
- Emerging Opportunities
- Executive Summary
- Global Market Outlook
- Demand-side Trends
- Supply-side Trends
- Technology Roadmap Analysis
- Analysis and Recommendations
- Analyst Perspective (What is happening? Why now? What should investors know?)
- Key Questions Answered
- How large is the market?
- What is the CAGR?
- What are key trends?
- Which region dominates?
- Who are the leaders?
- Market Overview
- Market Coverage / Taxonomy
- Market Definition / Scope / Limitations
- Research Methodology
- Chapter Orientation
- Analytical Lens and Working Hypotheses
- Market Structure, Signals, and Trend Drivers
- Benchmarking and Cross-market Comparability
- Market Sizing, Forecasting, and Opportunity Mapping
- Research Design and Evidence Framework
- Desk Research Programme (Secondary Evidence)
- Expert Input and Fieldwork (Primary Evidence)
- Tooling, Models, and Reference Databases
- Data Engineering and Model Build
- Quality Assurance and Audit Trail
- Market Background
- Market Dynamics (Drivers, Restraints, Opportunity, Trends)
- Scenario Forecast (Optimistic, Likely, Conservative)
- Impact Analysis
- AI Impact
- Sustainability Impact
- Regulatory Impact
- Technology Impact
- Consumer / Buyer Analysis
- Purchase Drivers
- Adoption Barriers
- Buyer Journey
- Opportunity Map Analysis
- Product Life Cycle Analysis
- Supply Chain Analysis
- Investment Feasibility Matrix
- Value Chain Analysis
- PESTLE and Porter's Analysis
- Regulatory Landscape
- Regional Parent Market Outlook
- Production and Consumption Statistics
- Import and Export Statistics
- Global Market Analysis and Forecast, 2021 to 2036
- Historical Market Size Value (USD Million) & Volume (Unit) Analysis, 2021 to 2025
- Current and Future Market Size Value (USD Million) & Volume (Unit) Projections, 2026 to 2036
- Y-o-Y Growth Trend Analysis
- Absolute $ Opportunity Analysis
- Global Market Pricing Analysis, 2021 to 2036
- Global Market Analysis and Forecast, By Surfactant Type, 2021 to 2036
- Introduction / Key Findings
- Historical Market Size Value (USD Million) & Volume (Unit) Analysis By Surfactant Type, 2021 to 2025
- Current and Future Market Size Value (USD Million) & Volume (Unit) Analysis and Forecast By Surfactant Type, 2026 to 2036
- Nonionic Surfactants
- Anionic Surfactants
- Deinking Surfactant Blends
- Bio-based Surfactants
- Nonionic Surfactants
- Y-o-Y Growth Trend Analysis By Surfactant Type, 2021 to 2025
- Absolute $ Opportunity Analysis By Surfactant Type, 2026 to 2036
- Global Market Analysis and Forecast, By Application, 2021 to 2036
- Introduction / Key Findings
- Historical Market Size Value (USD Million) & Volume (Unit) Analysis By Application, 2021 to 2025
- Current and Future Market Size Value (USD Million) & Volume (Unit) Analysis and Forecast By Application, 2026 to 2036
- Deinking
- Stickies Control
- Foam Control
- Wetting - Dispersion
- Deinking
- Y-o-Y Growth Trend Analysis By Application, 2021 to 2025
- Absolute $ Opportunity Analysis By Application, 2026 to 2036
- Global Market Analysis and Forecast, By Paper Grade, 2021 to 2036
- Introduction / Key Findings
- Historical Market Size Value (USD Million) & Volume (Unit) Analysis By Paper Grade, 2021 to 2025
- Current and Future Market Size Value (USD Million) & Volume (Unit) Analysis and Forecast By Paper Grade, 2026 to 2036
- Packaging Board
- Newsprint
- Tissue
- Printing & Writing Paper
- Packaging Board
- Y-o-Y Growth Trend Analysis By Paper Grade, 2021 to 2025
- Absolute $ Opportunity Analysis By Paper Grade, 2026 to 2036
- Global Market Analysis and Forecast, By End Use, 2021 to 2036
- Introduction / Key Findings
- Historical Market Size Value (USD Million) & Volume (Unit) Analysis By End Use, 2021 to 2025
- Current and Future Market Size Value (USD Million) & Volume (Unit) Analysis and Forecast By End Use, 2026 to 2036
- Recycled Paper Mills
- Packaging Mills
- Tissue Mills
- Chemical Service Providers
- Recycled Paper Mills
- Y-o-Y Growth Trend Analysis By End Use, 2021 to 2025
- Absolute $ Opportunity Analysis By End Use, 2026 to 2036
- Global Market Analysis and Forecast, By Sales Model, 2021 to 2036
- Introduction / Key Findings
- Historical Market Size Value (USD Million) & Volume (Unit) Analysis By Sales Model, 2021 to 2025
- Current and Future Market Size Value (USD Million) & Volume (Unit) Analysis and Forecast By Sales Model, 2026 to 2036
- Chemical + Mill Service
- Chemical Supply
- Chemical + Mill Service
- Y-o-Y Growth Trend Analysis By Sales Model, 2021 to 2025
- Absolute $ Opportunity Analysis By Sales Model, 2026 to 2036
- Global Market Analysis and Forecast, By Region, 2021 to 2036
- Introduction
- Historical Market Size Value (USD Million) & Volume (Unit) Analysis By Region, 2021 to 2025
- Current Market Size Value (USD Million) & Volume (Unit) Analysis and Forecast By Region, 2026 to 2036
- North America
- Latin America
- Western Europe
- Eastern Europe
- East Asia
- South Asia and Pacific
- Middle East & Africa
- Market Attractiveness Analysis By Region
- North America Market Analysis and Forecast, By Country, 2021 to 2036
- Historical Market Size Value (USD Million) & Volume (Unit) Trend Analysis By Market Taxonomy, 2021 to 2025
- Market Size Value (USD Million) & Volume (Unit) Forecast By Market Taxonomy, 2026 to 2036
- By Country
- USA
- Canada
- Mexico
- By Surfactant Type
- By Application
- By Paper Grade
- By End Use
- By Sales Model
- By Country
- Market Attractiveness Analysis
- By Country
- By Surfactant Type
- By Application
- By Paper Grade
- By End Use
- By Sales Model
- Key Takeaways
- Latin America Market Analysis and Forecast, By Country
- Historical Market Size Value (USD Million) & Volume (Unit) Trend Analysis By Market Taxonomy, 2021 to 2025
- Market Size Value (USD Million) & Volume (Unit) Forecast By Market Taxonomy, 2026 to 2036
- By Country
- Brazil
- Chile
- Rest of Latin America
- By Surfactant Type
- By Application
- By Paper Grade
- By End Use
- By Sales Model
- By Country
- Market Attractiveness Analysis
- By Country
- By Surfactant Type
- By Application
- By Paper Grade
- By End Use
- By Sales Model
- Key Takeaways
- Western Europe Market Analysis and Forecast, By Country
- Historical Market Size Value (USD Million) & Volume (Unit) Trend Analysis By Market Taxonomy, 2021 to 2025
- Market Size Value (USD Million) & Volume (Unit) Forecast By Market Taxonomy, 2026 to 2036
- By Country
- Germany
- UK
- Italy
- Spain
- France
- Nordic
- BENELUX
- Rest of Western Europe
- By Surfactant Type
- By Application
- By Paper Grade
- By End Use
- By Sales Model
- By Country
- Market Attractiveness Analysis
- By Country
- By Surfactant Type
- By Application
- By Paper Grade
- By End Use
- By Sales Model
- Key Takeaways
- Eastern Europe Market Analysis and Forecast, By Country
- Historical Market Size Value (USD Million) & Volume (Unit) Trend Analysis By Market Taxonomy, 2021 to 2025
- Market Size Value (USD Million) & Volume (Unit) Forecast By Market Taxonomy, 2026 to 2036
- By Country
- Russia
- Poland
- Hungary
- Balkan & Baltic
- Rest of Eastern Europe
- By Surfactant Type
- By Application
- By Paper Grade
- By End Use
- By Sales Model
- By Country
- Market Attractiveness Analysis
- By Country
- By Surfactant Type
- By Application
- By Paper Grade
- By End Use
- By Sales Model
- Key Takeaways
- East Asia Market Analysis and Forecast, By Country
- Historical Market Size Value (USD Million) & Volume (Unit) Trend Analysis By Market Taxonomy, 2021 to 2025
- Market Size Value (USD Million) & Volume (Unit) Forecast By Market Taxonomy, 2026 to 2036
- By Country
- China
- Japan
- South Korea
- By Surfactant Type
- By Application
- By Paper Grade
- By End Use
- By Sales Model
- By Country
- Market Attractiveness Analysis
- By Country
- By Surfactant Type
- By Application
- By Paper Grade
- By End Use
- By Sales Model
- Key Takeaways
- South Asia and Pacific Market Analysis and Forecast, By Country
- Historical Market Size Value (USD Million) & Volume (Unit) Trend Analysis By Market Taxonomy, 2021 to 2025
- Market Size Value (USD Million) & Volume (Unit) Forecast By Market Taxonomy, 2026 to 2036
- By Country
- India
- ASEAN
- Australia & New Zealand
- Rest of South Asia and Pacific
- By Surfactant Type
- By Application
- By Paper Grade
- By End Use
- By Sales Model
- By Country
- Market Attractiveness Analysis
- By Country
- By Surfactant Type
- By Application
- By Paper Grade
- By End Use
- By Sales Model
- Key Takeaways
- Middle East & Africa Market Analysis and Forecast, By Country
- Historical Market Size Value (USD Million) & Volume (Unit) Trend Analysis By Market Taxonomy, 2021 to 2025
- Market Size Value (USD Million) & Volume (Unit) Forecast By Market Taxonomy, 2026 to 2036
- By Country
- Kingdom of Saudi Arabia
- Other GCC Countries
- Türkiye
- South Africa
- Other African Union
- Rest of Middle East & Africa
- By Surfactant Type
- By Application
- By Paper Grade
- By End Use
- By Sales Model
- By Country
- Market Attractiveness Analysis
- By Country
- By Surfactant Type
- By Application
- By Paper Grade
- By End Use
- By Sales Model
- Key Takeaways
- Key Countries Market Analysis
- USA
- Pricing Analysis
- Market Share Analysis, 2025
- By Surfactant Type
- By Application
- By Paper Grade
- By End Use
- By Sales Model
- Canada
- Pricing Analysis
- Market Share Analysis, 2025
- By Surfactant Type
- By Application
- By Paper Grade
- By End Use
- By Sales Model
- Mexico
- Pricing Analysis
- Market Share Analysis, 2025
- By Surfactant Type
- By Application
- By Paper Grade
- By End Use
- By Sales Model
- Brazil
- Pricing Analysis
- Market Share Analysis, 2025
- By Surfactant Type
- By Application
- By Paper Grade
- By End Use
- By Sales Model
- Chile
- Pricing Analysis
- Market Share Analysis, 2025
- By Surfactant Type
- By Application
- By Paper Grade
- By End Use
- By Sales Model
- Germany
- Pricing Analysis
- Market Share Analysis, 2025
- By Surfactant Type
- By Application
- By Paper Grade
- By End Use
- By Sales Model
- UK
- Pricing Analysis
- Market Share Analysis, 2025
- By Surfactant Type
- By Application
- By Paper Grade
- By End Use
- By Sales Model
- Italy
- Pricing Analysis
- Market Share Analysis, 2025
- By Surfactant Type
- By Application
- By Paper Grade
- By End Use
- By Sales Model
- Spain
- Pricing Analysis
- Market Share Analysis, 2025
- By Surfactant Type
- By Application
- By Paper Grade
- By End Use
- By Sales Model
- France
- Pricing Analysis
- Market Share Analysis, 2025
- By Surfactant Type
- By Application
- By Paper Grade
- By End Use
- By Sales Model
- India
- Pricing Analysis
- Market Share Analysis, 2025
- By Surfactant Type
- By Application
- By Paper Grade
- By End Use
- By Sales Model
- ASEAN
- Pricing Analysis
- Market Share Analysis, 2025
- By Surfactant Type
- By Application
- By Paper Grade
- By End Use
- By Sales Model
- Australia & New Zealand
- Pricing Analysis
- Market Share Analysis, 2025
- By Surfactant Type
- By Application
- By Paper Grade
- By End Use
- By Sales Model
- China
- Pricing Analysis
- Market Share Analysis, 2025
- By Surfactant Type
- By Application
- By Paper Grade
- By End Use
- By Sales Model
- Japan
- Pricing Analysis
- Market Share Analysis, 2025
- By Surfactant Type
- By Application
- By Paper Grade
- By End Use
- By Sales Model
- South Korea
- Pricing Analysis
- Market Share Analysis, 2025
- By Surfactant Type
- By Application
- By Paper Grade
- By End Use
- By Sales Model
- Russia
- Pricing Analysis
- Market Share Analysis, 2025
- By Surfactant Type
- By Application
- By Paper Grade
- By End Use
- By Sales Model
- Poland
- Pricing Analysis
- Market Share Analysis, 2025
- By Surfactant Type
- By Application
- By Paper Grade
- By End Use
- By Sales Model
- Hungary
- Pricing Analysis
- Market Share Analysis, 2025
- By Surfactant Type
- By Application
- By Paper Grade
- By End Use
- By Sales Model
- Kingdom of Saudi Arabia
- Pricing Analysis
- Market Share Analysis, 2025
- By Surfactant Type
- By Application
- By Paper Grade
- By End Use
- By Sales Model
- Türkiye
- Pricing Analysis
- Market Share Analysis, 2025
- By Surfactant Type
- By Application
- By Paper Grade
- By End Use
- By Sales Model
- South Africa
- Pricing Analysis
- Market Share Analysis, 2025
- By Surfactant Type
- By Application
- By Paper Grade
- By End Use
- By Sales Model
- USA
- Market Structure Analysis
- Competition Dashboard
- Competition Benchmarking
- Market Share Analysis of Top Players
- By Regional
- By Surfactant Type
- By Application
- By Paper Grade
- By End Use
- By Sales Model
- Emerging Startups
- Innovation Benchmarking
- Competition Analysis
- Competition Deep Dive
- Kemira
- Overview
- Product Portfolio
- Profitability by Market Segments (Product/Region/Sales Channel)
- Sales Footprint
- Strategy Overview
- Marketing Strategy
- Product Strategy
- Channel Strategy
- Solenis
- Buckman
- Kao Corporation
- Harima Chemicals Group
- Evonik Industries
- Nouryon
- Venus Ethoxyethers
- BASF
- Kemira
- Case Studies
- Success Stories
- Recent Developments
- Competition Deep Dive
- Assumptions & Acronyms Used


