Methodology

Particle Reinforced Aluminum Matrix Composite Brake Disc for Electric Automobiles Market Forecast and Outlook (2025-2035)

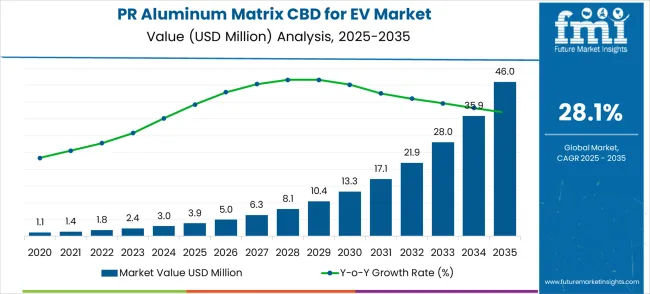
The particle reinforced aluminum matrix composite brake disc market for electric automobiles is projected to grow from USD 3.9 million in 2025 to USD 46.0 million in 2035, advancing at a CAGR of 28.1%. The initial stage from 2020 to 2025, covering values from USD 1.1 million to 3.9 million, represents the technology validation phase. During this period, adoption is gradual as the focus is placed on demonstrating performance reliability and thermal efficiency. This stage is critical because OEMs selectively test these discs in high-performance EV models to validate their advantages over conventional materials, forming the base for future acceleration.
Quick Stats for Particle Reinforced Aluminum Matrix Composite Brake Disc for Electric Automobiles Market

  • Particle Reinforced Aluminum Matrix Composite Brake Disc for Electric Automobiles Market Value (2025): USD 3.9 million
  • Particle Reinforced Aluminum Matrix Composite Brake Disc for Electric Automobiles Market Forecast Value (2035): USD 46.0 million
  • Particle Reinforced Aluminum Matrix Composite Brake Disc for Electric Automobiles Market Forecast CAGR: 28.1%

Pr Aluminum Matrix Cbd For Ev Market Market Value Analysis

Leading Application in Particle Reinforced Aluminum Matrix Composite Brake Disc for Electric Automobiles Market: Electric Passenger Vehicles (75.0%)

Key Growth Regions in Particle Reinforced Aluminum Matrix Composite Brake Disc for Electric Automobiles Market: China, India, and Germany

Top Key Players in Particle Reinforced Aluminum Matrix Composite Brake Disc for Electric Automobiles Market: AC Floby, Lanxide, Huaibei Jibo New Materials, Hunan Xiangtou Lightweight Material Technology, Hunan Wenchang New Material Technology, Kailong High Technology Co., Ltd., Shanghai Ruier Industrial

Particle Reinforced Aluminum Matrix Composite Brake Disc for Electric Automobiles Market Key Takeaways

Metric Value
Market Value (2025) USD 3.9 million
Forecast Value (2035) USD 46 million
Forecast CAGR (2025–2035) 28.1%

The second major growth stage emerges between 2026 and 2030, where the market expands from USD 5 million to 13.3 million. This inflection reflects a clear breakpoint driven by advancements in material processing and cost-efficiency gains. Wider industry acceptance is expected as automotive manufacturers scale their integration programs. The period also benefits from stronger EV production numbers and the rising demand for lightweight braking systems. Breakpoint mapping here highlights a transition from pilot-scale adoption to broader commercialization, underpinned by technical improvements and evolving consumer demand for enhanced driving performance.

The third and most pronounced breakpoint appears from 2030 to 2035, when revenues surge from USD 13.3 million to 46 million. This represents mass adoption, where OEMs integrate composite brake discs across mid-range and volume EVs, not just premium categories. Factors such as supply chain maturity, improved cost structures, and heightened focus on braking efficiency push the market into exponential growth. The curve steepens significantly, signaling full-scale commercialization. Breakpoint analysis therefore indicates a structured pathway: early validation, scaling adoption, and eventual mass-market integration, with each phase driving momentum for the next.

Why is the Particle Reinforced Aluminum Matrix Composite Brake Disc for Electric Automobiles Market Growing?

Market expansion is being supported by the rapid increase in electric vehicle production and the corresponding need for specialized braking components that enable optimal performance characteristics including weight reduction, thermal management, and regenerative braking compatibility. Modern electric vehicle manufacturers rely on advanced composite brake disc technologies to enhance vehicle efficiency including improved energy recovery, reduced unsprung weight, and enhanced thermal dissipation capabilities. Even minor weight reductions in braking components require sophisticated composite materials to maintain optimal braking performance and safety standards.

The growing complexity of electric vehicle systems and increasing performance requirements are driving demand for particle reinforced composite brake discs from certified manufacturers with appropriate material expertise and quality systems. Automotive regulatory agencies are increasingly requiring comprehensive testing of composite braking components to maintain safety compliance and ensure vehicle performance standards. Industry specifications and electric vehicle manufacturing requirements are establishing standardized composite brake disc procedures that require specialized materials and trained manufacturing technicians.

Segmental Analysis

The market is segmented by product type, application, and region. By product type, the market is divided into silicon carbide mixed particle reinforced aluminum matrix composite brake disc and other particle reinforced aluminum matrix composite brake disc. Based on application, the market is categorized into electric passenger vehicles and electric commercial vehicles. Regionally, the market is divided into North America, Europe, East Asia, South Asia & Pacific, Latin America, and Middle East & Africa.
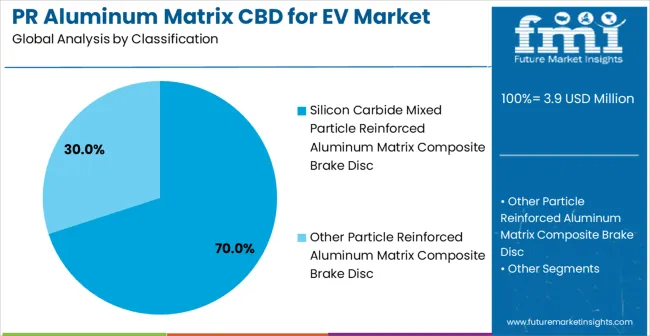
By Product Type, Silicon Carbide Mixed Particle Reinforced Aluminum Matrix Composite Brake Disc Segment Accounts for 70% Market Share

Pr Aluminum Matrix Cbd For Ev Market Analysis By Classification

In 2025, silicon carbide mixed particle reinforced aluminum matrix composite brake discs are anticipated to capture nearly 70% of the market. Their widespread adoption is attributed to unmatched advantages in wear resistance, thermal stability, and braking reliability under intense EV operating conditions. Silicon carbide reinforcement addresses limitations of conventional cast iron brake discs, ensuring heat management and extended lifespan. Electric vehicles impose significant demands on braking systems due to heavy battery weight, regenerative braking cycles, and torque-intensive driving. Silicon carbide composites meet these requirements by delivering stable braking performance during rapid temperature variations. The segment’s dominance is reinforced by established supply chain processes and validation across global automotive platforms. Manufacturers prioritize these discs for premium EVs and high-performance SUVs, where braking safety and lightweight construction remain crucial. Continued R&D investments and automaker collaborations ensure that silicon carbide AMC brake discs will shape performance standards for next-generation electric mobility.
  • Silicon carbide composites dominate as they provide superior heat resistance, longer durability, and higher braking stability.
  • Automakers integrate SiC-AMC discs in premium EVs, ensuring lightweight designs that optimize range efficiency and braking reliability.

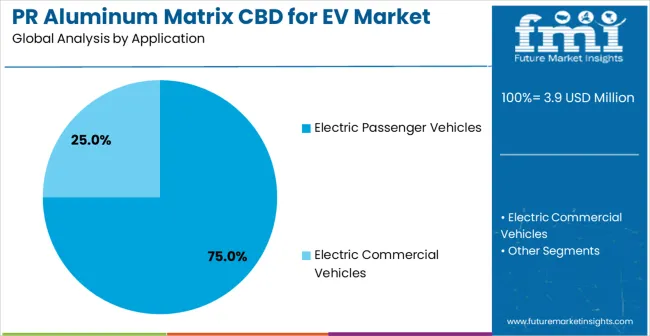
By Application, Electric Passenger Vehicles Segment Accounts for 75% Market Share

Pr Aluminum Matrix Cbd For Ev Market Analysis By Application

Electric passenger vehicles are expected to represent about 75% of the total market share in 2025, highlighting their central role in adopting composite brake disc technology. Passenger EVs, including sedans, hatchbacks, and SUVs, generate the highest demand for advanced braking solutions due to large-scale production volumes. Automakers focus on aluminum matrix composite brake discs to meet consumer expectations of enhanced safety, energy efficiency, and improved driving range. The lightweight property of AMC brake discs reduces overall vehicle mass, extending range without sacrificing performance. Their superior thermal management capabilities also counteract heat buildup from frequent urban braking and regenerative cycles. Government policies accelerating EV adoption further strengthen this segment’s growth trajectory. Cost efficiencies and scaling enable AMC brake discs to extend beyond premium categories into mid-tier EV models. As passenger EVs dominate electrification trends, they continue to drive long-term demand, reinforcing AMC brake discs as an essential material innovation for the sector.

  • Passenger EVs accelerate AMC disc adoption by requiring lightweight materials to balance range, performance, and thermal efficiency.
  • Cost improvements expand AMC disc usage beyond luxury EVs into mainstream models, supporting wider adoption across consumer markets.

What are the Drivers, Restraints, and Key Trends of the Particle Reinforced Aluminum Matrix Composite Brake Disc for Electric Automobiles Market?

The particle reinforced aluminum matrix composite brake disc for electric automobiles market is advancing steadily due to increasing electric vehicle production and growing recognition of composite material advantages in automotive braking applications. However, the market faces challenges including high manufacturing costs for advanced composite materials, need for continuous development of processing technologies, and varying quality requirements across different electric vehicle platforms. Material standardization efforts and certification programs continue to influence manufacturing methods and market development patterns.

Expansion of Advanced Manufacturing Technologies

The growing deployment of sophisticated composite manufacturing processes is enabling improved brake disc quality with enhanced performance characteristics and reduced production costs. Advanced powder metallurgy and sintering technologies provide optimized material properties while maintaining consistent quality and dimensional accuracy. These technologies are particularly valuable for electric vehicle manufacturers and component suppliers that require high-performance brake discs with specific thermal and mechanical properties for electric vehicle applications.

Integration of Lightweight Design Optimization

Modern composite brake disc manufacturers are incorporating advanced design optimization techniques and material selection strategies that improve performance while reducing component weight. Integration of computer-aided engineering and finite element analysis enables precise optimization of composite material distribution and brake disc geometry. Advanced design technologies support development of application-specific brake disc solutions that meet stringent electric vehicle performance requirements and safety standards.
Analysis of Particle Reinforced Aluminum Matrix Composite Brake Disc for Electric Automobiles Market by Key Country

Pr Aluminum Matrix Cbd For Ev Market Cagr Analysis By Country

Country CAGR (2025-2035)
China 37.9%
India 35.1%
Germany 32.3%
Brazil 29.5%
United States 26.7%
United Kingdom 23.9%
Japan 21.1%

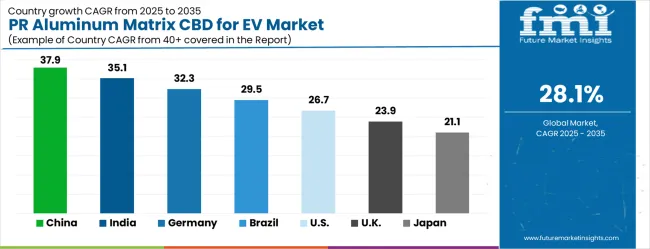
The particle reinforced aluminum matrix composite brake disc for electric automobiles market is growing rapidly, with China leading at a 37.9% CAGR through 2035, driven by massive electric vehicle production expansion, government electrification policies, and increasing composite material manufacturing capabilities. India follows at 35.1%, supported by rising electric vehicle adoption and growing automotive component manufacturing infrastructure. Germany grows steadily at 32.3%, integrating advanced composite technologies into established automotive manufacturing networks. Brazil records 29.5%, emphasizing electric vehicle market development and composite material production expansion. The United States shows solid growth at 26.7%, focusing on electric vehicle technology advancement and lightweight component integration. The United Kingdom demonstrates steady progress at 23.9%, maintaining established automotive research capabilities and electric vehicle development activities. Japan records 21.1% growth, concentrating on precision manufacturing and quality enhancement initiatives.

The report covers an in-depth analysis of 40+ countries top-performing countries are highlighted below. 

China Leads Global Market Growth with Electric Vehicle Manufacturing Excellence

Revenue from particle reinforced aluminum matrix composite brake disc for electric automobiles in China is projected to exhibit the highest growth rate with a CAGR of 37.9% through 2035, driven by rapid expansion of electric vehicle production capabilities and increasing investment in advanced automotive component manufacturing. The country’s dominant electric vehicle manufacturing sector and expanding composite material production facilities are creating significant demand for high-performance brake disc solutions. Major automotive manufacturers and component suppliers are establishing comprehensive manufacturing networks to support the growing electric vehicle market across domestic and international applications.

  • Electric vehicle industry development initiatives promote advanced composite manufacturing technologies and lightweight component capabilities among automotive manufacturers throughout key production centers
  • Government automotive policy programs support establishment of high-performance component manufacturing facilities and quality assurance systems for domestic and export market applications

India Demonstrates Strong Market Potential with Electric Vehicle Adoption Growth

Revenue from particle reinforced aluminum matrix composite brake disc for electric automobiles in India is expanding at a CAGR of 35.1%, supported by increasing electric vehicle market penetration and growing automotive component manufacturing capabilities in composite materials. The country’s expanding electric vehicle sector and rising automotive export activities are driving demand for cost-effective composite brake disc manufacturing technologies. Automotive manufacturers and component suppliers are gradually establishing advanced manufacturing capabilities to serve the growing electric vehicle component market.
  • Electric vehicle manufacturing expansion facilitates adoption of composite material technologies that support diverse vehicle development requirements across domestic and export market applications
  • Automotive technology education programs enhance technical capabilities among manufacturing professionals, enabling specialized composite production expertise that meets international automotive industry standards

Germany Focuses on Advanced Automotive Technology and Manufacturing Excellence

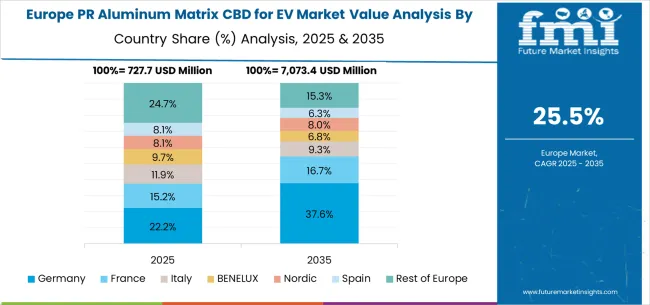
Pr Aluminum Matrix Cbd For Ev Market Europe Country Market Share Analysis, 2025 & 2035

Demand for particle reinforced aluminum matrix composite brake disc for electric automobiles in Germany is projected to grow at a CAGR of 32.3%, supported by the country’s emphasis on automotive technology innovation and premium component manufacturing excellence. German automotive manufacturers and component suppliers are implementing advanced composite brake disc technologies that meet stringent quality requirements and performance specifications. The market is characterized by focus on technical precision, advanced manufacturing processes, and compliance with comprehensive automotive safety standards.

  • Automotive technology innovation programs emphasize advanced composite manufacturing technologies and quality assurance systems that meet rigorous German automotive engineering and safety standards
  • Professional training initiatives develop comprehensive technical expertise among automotive professionals, supporting advanced component production workflows and international quality certification requirements

Brazil Maintains Steady Growth with Electric Vehicle Market Development

Revenue from particle reinforced aluminum matrix composite brake disc for electric automobiles in Brazil is growing at a CAGR of 29.5%, driven by increasing electric vehicle market development activities and growing recognition of composite component importance in automotive manufacturing. The country’s expanding automotive industry is gradually integrating advanced composite brake disc technologies to enhance vehicle performance and manufacturing capabilities. Automotive manufacturers and component suppliers are investing in composite manufacturing systems to address evolving electric vehicle market demands.

  • Electric vehicle development initiatives promote advanced composite manufacturing technologies that enhance automotive component capabilities and performance quality across automotive manufacturing sectors
  • Professional training programs build technical capabilities among automotive professionals, enabling specialized composite production skills that support diverse vehicle development requirements and regulatory compliance

United States Emphasizes Electric Vehicle Technology and Component Innovation

Demand for particle reinforced aluminum matrix composite brake disc for electric automobiles in the USA is expanding at a CAGR of 26.7%, driven by established automotive industry leadership and growing emphasis on electric vehicle component development. Large automotive manufacturers and component suppliers are implementing comprehensive composite brake disc manufacturing capabilities to serve diverse electric vehicle development requirements. The market benefits from advanced research infrastructure and established regulatory frameworks that support innovative composite component technologies.

  • Automotive industry integration facilitates standardized composite manufacturing workflows across vehicle development platforms, providing consistent quality and comprehensive coverage throughout national automotive markets
  • Research and development programs develop specialized technical expertise among automotive professionals, enabling advanced composite production capabilities that support diverse vehicle development and regulatory requirements

United Kingdom Emphasizes Automotive Research and Component Development

Demand for particle reinforced aluminum matrix composite brake disc for electric automobiles in the UK is projected to grow at a CAGR of 23.9%, supported by established automotive research capabilities and growing emphasis on electric vehicle component innovation activities. British automotive manufacturers and research institutions are implementing composite brake disc technologies that meet industry quality standards and performance requirements. The market benefits from established automotive infrastructure and comprehensive research programs for electric vehicle component development.
  • Automotive research programs support advanced composite component capabilities that enhance vehicle development quality and technical expertise throughout automotive and manufacturing sectors
  • Professional training initiatives build comprehensive technical skills among automotive professionals, enabling specialized composite production capabilities that meet industry standards and regulatory requirements

Japan Concentrates on Precision Manufacturing and Quality Enhancement

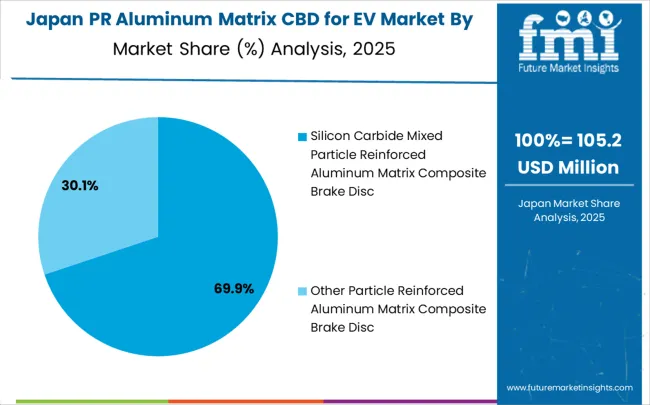
Pr Aluminum Matrix Cbd For Ev Market Japan Market Share Analysis By Classification

Revenue from particle reinforced aluminum matrix composite brake disc for electric automobiles in Japan is growing at a CAGR of 21.1%, driven by the country’s focus on precision automotive manufacturing and quality enhancement applications in electric vehicle components. Japanese automotive manufacturers and component suppliers are implementing advanced composite brake disc systems that demonstrate superior processing quality and technical reliability. The market is characterized by emphasis on technological excellence, quality assurance, and integration with established automotive production workflows.
  • Automotive technology innovation programs promote advanced composite manufacturing systems and quality enhancement technologies that maintain Japanese precision and reliability standards throughout vehicle production workflows
  • Professional certification initiatives develop comprehensive technical expertise among automotive professionals, supporting advanced composite production capabilities and quality assurance requirements for electric vehicle applications

Competitive Landscape of Particle Reinforced Aluminum Matrix Composite Brake Disc for Electric Automobiles Market

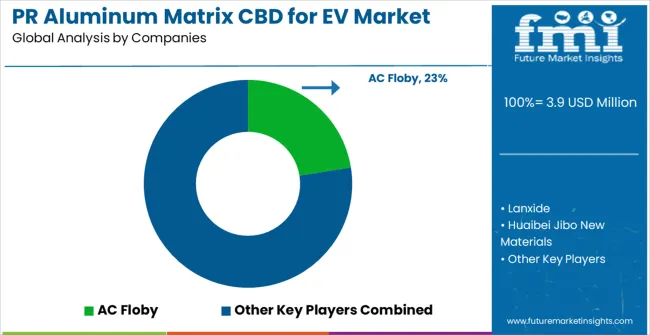
Pr Aluminum Matrix Cbd For Ev Market Analysis By Company

The particle reinforced aluminum matrix composite brake disc for electric automobiles market is defined by competition among specialized composite manufacturers, automotive component suppliers, and advanced materials companies. Companies are investing in advanced manufacturing process development, material optimization technologies, quality enhancement systems, and automotive integration capabilities to deliver high-performance, reliable, and cost-effective composite brake disc solutions. Strategic partnerships, technological innovation, and manufacturing scaling are central to strengthening product portfolios and market presence.

AC Floby specializes in advanced composite brake disc manufacturing with focus on electric vehicle applications and performance optimization. Lanxide provides comprehensive aluminum matrix composite solutions with emphasis on automotive component applications and manufacturing expertise. Huaibei Jibo New Materials delivers specialized composite materials with advanced manufacturing capabilities for automotive applications. Hunan Xiangtou Lightweight Material Technology focuses on lightweight automotive component development with composite material expertise.

Hunan Wenchang New Material Technology offers advanced composite manufacturing solutions with emphasis on automotive component applications. Kailong High Technology Co., Ltd. provides specialized composite material production with focus on high-performance automotive applications. Shanghai Ruier Industrial delivers comprehensive composite manufacturing expertise with automotive component specialization and quality enhancement capabilities across electric vehicle and automotive component market segments.

Particle Reinforced Aluminum Matrix Composite Brake Disc for Electric Automobiles – Stakeholder Contribution Framework

The AMC brake disc market is positioned at the intersection of lightweighting, thermal management, safety innovation, and EV adoption. With the EV sector expanding rapidly, the shift toward advanced materials such as particle reinforced aluminum composites is vital to meet performance requirements. Coordinated efforts across governments, industry associations, OEMs, suppliers, and investors are essential to scale production, ensure affordability, and accelerate adoption in mass-market EVs.

How Governments Could Accelerate Market Development and Adoption?

  • Incentives & Subsidies: Provide tax credits and subsidies for EVs using lightweight AMC brake discs, helping manufacturers offset initial cost premiums.
  • R&D Funding: Support research into scalable SiC and Al₂O₃ reinforcement processing technologies to improve cost efficiency.
  • Regulatory Standards: Establish EV safety and performance standards that recognize composite brake discs for their superior wear resistance and heat management.
  • Trade Facilitation: Enable preferential tariffs and export policies for composite brake disc components, strengthening global supply chain integration.
  • Sustainability Mandates: Integrate lightweighting components into national EV carbon reduction frameworks, linking AMC discs to lifecycle emissions reduction.

How Industry Bodies Could Support Market Growth?

  • Standardization: Create harmonized testing protocols for AMC brake disc durability, thermal cycling, and recyclability.
  • Export Branding: Position regional AMC discs as “lightweight, high-performance EV components” in international trade shows.
  • Training Networks: Develop curricula for automotive engineers and service providers on composite brake disc installation, repair, and testing.
  • Policy Advocacy: Represent stakeholders in dialogues on EV safety regulations, raw material sourcing, and supply chain incentives.

How OEMs and EV Manufacturers Could Strengthen the Ecosystem?

  • System Integration: Bundle AMC brake discs with regenerative braking systems to enhance EV range and efficiency.
  • Strategic Partnerships: Collaborate with composite suppliers and Tier-1 brake system providers for co-development and validation.
  • Design Customization: Use AI-driven design to tailor brake disc formulations for specific EV models and performance categories (e.g., luxury EVs vs. mass-market EVs).
  • Lifecycle Support: Offer extended warranties and service packages to reassure consumers about composite disc reliability.

How Suppliers Could Adapt and Scale?

  • Sustainable Sourcing: Leverage recycled aluminum alloys and secondary raw materials to reduce cost and environmental footprint.
  • Portfolio Diversification: Expand into application-specific segments (passenger EV discs, commercial EV brake solutions, high-performance EV racing discs).
  • Quality Assurance: Implement advanced non-destructive testing and traceability platforms to build OEM trust.
  • Farmer-equivalent Engagement (Mechanics & Service Networks): Train EV service providers on installation and benefits of AMC discs, driving aftersales adoption.

How Investors and Financial Enablers Could Unlock Value?

  • Infrastructure Financing: Fund specialized composite manufacturing plants and automated casting lines in key EV hubs (China, Germany, USA).
  • Climate Finance: Back startups innovating in carbon-reducing, lightweight braking technologies linked to EV emission credits.
  • Private Equity & M&A: Consolidate fragmented composite brake disc manufacturers into global-scale suppliers.
  • Insurance & Risk Models: Create hedging instruments to manage volatility in aluminum and silicon carbide raw material costs.

Key Players in the Particle Reinforced Aluminum Matrix Composite Brake Disc for Electric Automobiles Market

  • AC Floby
  • Lanxide
  • Huaibei Jibo New Materials
  • Hunan Xiangtou Lightweight Material Technology
  • Hunan Wenchang New Material Technology
  • Kailong High Technology Co., Ltd.
  • Shanghai Ruier Industrial

Scope of the Report

Item Value
Quantitative Units USD 3.9 million
Classification Silicon Carbide Mixed Particle Reinforced Aluminum Matrix Composite Brake Disc, Other Particle Reinforced Aluminum Matrix Composite Brake Disc
Application Electric Passenger Vehicles, Electric Commercial Vehicles
Regions Covered North America, Europe, East Asia, South Asia & Pacific, Latin America, Middle East & Africa
Country Covered China, India, Germany, Brazil, United States, United Kingdom, Japan, and 40+ countries
Key Companies Profiled AC Floby, Lanxide, Huaibei Jibo New Materials, Hunan Xiangtou Lightweight Material Technology, Hunan Wenchang New Material Technology, Kailong High Technology Co., Ltd., Shanghai Ruier Industrial
Additional Attributes Dollar sales by composite classification and vehicle application segment, regional demand trends across major electric vehicle markets, competitive landscape with established composite manufacturers and emerging automotive component companies, preferences for different particle reinforcement systems versus traditional brake disc materials, integration with electric vehicle manufacturing platforms and lightweight design optimization, innovations in composite manufacturing processes and performance enhancement technologies, and adoption of advanced material characterization solutions with quality control systems and automotive certification features for improved electric vehicle component development workflows.

Particle Reinforced Aluminum Matrix Composite Brake Disc for Electric Automobiles Market by Segments

Classification:

  • Silicon Carbide Mixed Particle Reinforced Aluminum Matrix Composite Brake Disc
  • Other Particle Reinforced Aluminum Matrix Composite Brake Disc

Application:

  • Electric Passenger Vehicles
  • Electric Commercial Vehicles

Region:

  • North America
    • United States
    • Canada
    • Mexico
  • Europe
    • Germany
    • United Kingdom
    • France
    • Italy
    • Spain
    • Nordic
    • BENELUX
    • Rest of Europe
  • East Asia
    • China
    • Japan
    • South Korea
  • South Asia & Pacific
    • India
    • ASEAN
    • Australia & New Zealand
    • Rest of South Asia & Pacific
  • Latin America
    • Brazil
    • Chile
    • Rest of Latin America
  • Middle East & Africa
    • Kingdom of Saudi Arabia
    • Other GCC Countries
    • Turkiye
    • South Africa
    • Other African Union
    • Rest of Middle East & Africa

Frequently Asked Questions

How big is the particle reinforced aluminum matrix composite brake disc for electric automobiles market in 2025?

The global particle reinforced aluminum matrix composite brake disc for electric automobiles market is estimated to be valued at USD 3.9 million in 2025.

What will be the size of particle reinforced aluminum matrix composite brake disc for electric automobiles market in 2035?

The market size for the particle reinforced aluminum matrix composite brake disc for electric automobiles market is projected to reach USD 46.0 million by 2035.

How much will be the particle reinforced aluminum matrix composite brake disc for electric automobiles market growth between 2025 and 2035?

The particle reinforced aluminum matrix composite brake disc for electric automobiles market is expected to grow at a 28.1% CAGR between 2025 and 2035.

What are the key product types in the particle reinforced aluminum matrix composite brake disc for electric automobiles market?

The key product types in particle reinforced aluminum matrix composite brake disc for electric automobiles market are silicon carbide mixed particle reinforced aluminum matrix composite brake disc and other particle reinforced aluminum matrix composite brake disc.

Which application segment to contribute significant share in the particle reinforced aluminum matrix composite brake disc for electric automobiles market in 2025?

In terms of application, electric passenger vehicles segment to command 75.0% share in the particle reinforced aluminum matrix composite brake disc for electric automobiles market in 2025.

Table of Content

  1. Executive Summary
    • Global Market Outlook
    • Demand to side Trends
    • Supply to side Trends
    • Technology Roadmap Analysis
    • Analysis and Recommendations
  2. Market Overview
    • Market Coverage / Taxonomy
    • Market Definition / Scope / Limitations
  3. Market Background
    • Market Dynamics
      • Drivers
      • Restraints
      • Opportunity
      • Trends
    • Scenario Forecast
      • Demand in Optimistic Scenario
      • Demand in Likely Scenario
      • Demand in Conservative Scenario
    • Opportunity Map Analysis
    • Product Life Cycle Analysis
    • Supply Chain Analysis
    • Investment Feasibility Matrix
    • Value Chain Analysis
    • PESTLE and Porter’s Analysis
    • Regulatory Landscape
    • Regional Parent Market Outlook
    • Production and Consumption Statistics
    • Import and Export Statistics
  4. Global Market Analysis 2020 to 2024 and Forecast, 2025 to 2035
    • Historical Market Size Value (USD Million) Analysis, 2020 to 2024
    • Current and Future Market Size Value (USD Million) Projections, 2025 to 2035
      • Y to o to Y Growth Trend Analysis
      • Absolute $ Opportunity Analysis
  5. Global Market Pricing Analysis 2020 to 2024 and Forecast 2025 to 2035
  6. Global Market Analysis 2020 to 2024 and Forecast 2025 to 2035, By Classification
    • Introduction / Key Findings
    • Historical Market Size Value (USD Million) Analysis By Classification , 2020 to 2024
    • Current and Future Market Size Value (USD Million) Analysis and Forecast By Classification , 2025 to 2035
      • Silicon Carbide Mixed Particle Reinforced Aluminum Matrix Composite Brake Disc
      • Other Particle Reinforced Aluminum Matrix Composite Brake Disc
    • Y to o to Y Growth Trend Analysis By Classification , 2020 to 2024
    • Absolute $ Opportunity Analysis By Classification , 2025 to 2035
  7. Global Market Analysis 2020 to 2024 and Forecast 2025 to 2035, By Application
    • Introduction / Key Findings
    • Historical Market Size Value (USD Million) Analysis By Application, 2020 to 2024
    • Current and Future Market Size Value (USD Million) Analysis and Forecast By Application, 2025 to 2035
      • Electric Passenger Vehicles
      • Electric Commercial Vehicles
    • Y to o to Y Growth Trend Analysis By Application, 2020 to 2024
    • Absolute $ Opportunity Analysis By Application, 2025 to 2035
  8. Global Market Analysis 2020 to 2024 and Forecast 2025 to 2035, By Region
    • Introduction
    • Historical Market Size Value (USD Million) Analysis By Region, 2020 to 2024
    • Current Market Size Value (USD Million) Analysis and Forecast By Region, 2025 to 2035
      • North America
      • Latin America
      • Western Europe
      • Eastern Europe
      • East Asia
      • South Asia and Pacific
      • Middle East & Africa
    • Market Attractiveness Analysis By Region
  9. North America Market Analysis 2020 to 2024 and Forecast 2025 to 2035, By Country
    • Historical Market Size Value (USD Million) Trend Analysis By Market Taxonomy, 2020 to 2024
    • Market Size Value (USD Million) Forecast By Market Taxonomy, 2025 to 2035
      • By Country
        • USA
        • Canada
        • Mexico
      • By Classification
      • By Application
    • Market Attractiveness Analysis
      • By Country
      • By Classification
      • By Application
    • Key Takeaways
  10. Latin America Market Analysis 2020 to 2024 and Forecast 2025 to 2035, By Country
    • Historical Market Size Value (USD Million) Trend Analysis By Market Taxonomy, 2020 to 2024
    • Market Size Value (USD Million) Forecast By Market Taxonomy, 2025 to 2035
      • By Country
        • Brazil
        • Chile
        • Rest of Latin America
      • By Classification
      • By Application
    • Market Attractiveness Analysis
      • By Country
      • By Classification
      • By Application
    • Key Takeaways
  11. Western Europe Market Analysis 2020 to 2024 and Forecast 2025 to 2035, By Country
    • Historical Market Size Value (USD Million) Trend Analysis By Market Taxonomy, 2020 to 2024
    • Market Size Value (USD Million) Forecast By Market Taxonomy, 2025 to 2035
      • By Country
        • Germany
        • UK
        • Italy
        • Spain
        • France
        • Nordic
        • BENELUX
        • Rest of Western Europe
      • By Classification
      • By Application
    • Market Attractiveness Analysis
      • By Country
      • By Classification
      • By Application
    • Key Takeaways
  12. Eastern Europe Market Analysis 2020 to 2024 and Forecast 2025 to 2035, By Country
    • Historical Market Size Value (USD Million) Trend Analysis By Market Taxonomy, 2020 to 2024
    • Market Size Value (USD Million) Forecast By Market Taxonomy, 2025 to 2035
      • By Country
        • Russia
        • Poland
        • Hungary
        • Balkan & Baltic
        • Rest of Eastern Europe
      • By Classification
      • By Application
    • Market Attractiveness Analysis
      • By Country
      • By Classification
      • By Application
    • Key Takeaways
  13. East Asia Market Analysis 2020 to 2024 and Forecast 2025 to 2035, By Country
    • Historical Market Size Value (USD Million) Trend Analysis By Market Taxonomy, 2020 to 2024
    • Market Size Value (USD Million) Forecast By Market Taxonomy, 2025 to 2035
      • By Country
        • China
        • Japan
        • South Korea
      • By Classification
      • By Application
    • Market Attractiveness Analysis
      • By Country
      • By Classification
      • By Application
    • Key Takeaways
  14. South Asia and Pacific Market Analysis 2020 to 2024 and Forecast 2025 to 2035, By Country
    • Historical Market Size Value (USD Million) Trend Analysis By Market Taxonomy, 2020 to 2024
    • Market Size Value (USD Million) Forecast By Market Taxonomy, 2025 to 2035
      • By Country
        • India
        • ASEAN
        • Australia & New Zealand
        • Rest of South Asia and Pacific
      • By Classification
      • By Application
    • Market Attractiveness Analysis
      • By Country
      • By Classification
      • By Application
    • Key Takeaways
  15. Middle East & Africa Market Analysis 2020 to 2024 and Forecast 2025 to 2035, By Country
    • Historical Market Size Value (USD Million) Trend Analysis By Market Taxonomy, 2020 to 2024
    • Market Size Value (USD Million) Forecast By Market Taxonomy, 2025 to 2035
      • By Country
        • Kingdom of Saudi Arabia
        • Other GCC Countries
        • Turkiye
        • South Africa
        • Other African Union
        • Rest of Middle East & Africa
      • By Classification
      • By Application
    • Market Attractiveness Analysis
      • By Country
      • By Classification
      • By Application
    • Key Takeaways
  16. Key Countries Market Analysis
    • USA
      • Pricing Analysis
      • Market Share Analysis, 2024
        • By Classification
        • By Application
    • Canada
      • Pricing Analysis
      • Market Share Analysis, 2024
        • By Classification
        • By Application
    • Mexico
      • Pricing Analysis
      • Market Share Analysis, 2024
        • By Classification
        • By Application
    • Brazil
      • Pricing Analysis
      • Market Share Analysis, 2024
        • By Classification
        • By Application
    • Chile
      • Pricing Analysis
      • Market Share Analysis, 2024
        • By Classification
        • By Application
    • Germany
      • Pricing Analysis
      • Market Share Analysis, 2024
        • By Classification
        • By Application
    • UK
      • Pricing Analysis
      • Market Share Analysis, 2024
        • By Classification
        • By Application
    • Italy
      • Pricing Analysis
      • Market Share Analysis, 2024
        • By Classification
        • By Application
    • Spain
      • Pricing Analysis
      • Market Share Analysis, 2024
        • By Classification
        • By Application
    • France
      • Pricing Analysis
      • Market Share Analysis, 2024
        • By Classification
        • By Application
    • India
      • Pricing Analysis
      • Market Share Analysis, 2024
        • By Classification
        • By Application
    • ASEAN
      • Pricing Analysis
      • Market Share Analysis, 2024
        • By Classification
        • By Application
    • Australia & New Zealand
      • Pricing Analysis
      • Market Share Analysis, 2024
        • By Classification
        • By Application
    • China
      • Pricing Analysis
      • Market Share Analysis, 2024
        • By Classification
        • By Application
    • Japan
      • Pricing Analysis
      • Market Share Analysis, 2024
        • By Classification
        • By Application
    • South Korea
      • Pricing Analysis
      • Market Share Analysis, 2024
        • By Classification
        • By Application
    • Russia
      • Pricing Analysis
      • Market Share Analysis, 2024
        • By Classification
        • By Application
    • Poland
      • Pricing Analysis
      • Market Share Analysis, 2024
        • By Classification
        • By Application
    • Hungary
      • Pricing Analysis
      • Market Share Analysis, 2024
        • By Classification
        • By Application
    • Kingdom of Saudi Arabia
      • Pricing Analysis
      • Market Share Analysis, 2024
        • By Classification
        • By Application
    • Turkiye
      • Pricing Analysis
      • Market Share Analysis, 2024
        • By Classification
        • By Application
    • South Africa
      • Pricing Analysis
      • Market Share Analysis, 2024
        • By Classification
        • By Application
  17. Market Structure Analysis
    • Competition Dashboard
    • Competition Benchmarking
    • Market Share Analysis of Top Players
      • By Regional
      • By Classification
      • By Application
  18. Competition Analysis
    • Competition Deep Dive
      • AC Floby
        • Overview
        • Product Portfolio
        • Profitability by Market Segments (Product/Age /Sales Channel/Region)
        • Sales Footprint
        • Strategy Overview
          • Marketing Strategy
          • Product Strategy
          • Channel Strategy
      • Lanxide
      • Huaibei Jibo New Materials
      • Hunan Xiangtou Lightweight Material Technology
      • Hunan Wenchang New Material Technology
      • Kailong High Technology Co., Ltd.
      • Shanghai Ruier Industrial
  19. Assumptions & Acronyms Used
  20. Research Methodology

List of Tables

  • Table 1: Global Market Value (USD Million) Forecast by Region, 2020 to 2035
  • Table 2: Global Market Value (USD Million) Forecast by Classification , 2020 to 2035
  • Table 3: Global Market Value (USD Million) Forecast by Application, 2020 to 2035
  • Table 4: North America Market Value (USD Million) Forecast by Country, 2020 to 2035
  • Table 5: North America Market Value (USD Million) Forecast by Classification , 2020 to 2035
  • Table 6: North America Market Value (USD Million) Forecast by Application, 2020 to 2035
  • Table 7: Latin America Market Value (USD Million) Forecast by Country, 2020 to 2035
  • Table 8: Latin America Market Value (USD Million) Forecast by Classification , 2020 to 2035
  • Table 9: Latin America Market Value (USD Million) Forecast by Application, 2020 to 2035
  • Table 10: Western Europe Market Value (USD Million) Forecast by Country, 2020 to 2035
  • Table 11: Western Europe Market Value (USD Million) Forecast by Classification , 2020 to 2035
  • Table 12: Western Europe Market Value (USD Million) Forecast by Application, 2020 to 2035
  • Table 13: Eastern Europe Market Value (USD Million) Forecast by Country, 2020 to 2035
  • Table 14: Eastern Europe Market Value (USD Million) Forecast by Classification , 2020 to 2035
  • Table 15: Eastern Europe Market Value (USD Million) Forecast by Application, 2020 to 2035
  • Table 16: East Asia Market Value (USD Million) Forecast by Country, 2020 to 2035
  • Table 17: East Asia Market Value (USD Million) Forecast by Classification , 2020 to 2035
  • Table 18: East Asia Market Value (USD Million) Forecast by Application, 2020 to 2035
  • Table 19: South Asia and Pacific Market Value (USD Million) Forecast by Country, 2020 to 2035
  • Table 20: South Asia and Pacific Market Value (USD Million) Forecast by Classification , 2020 to 2035
  • Table 21: South Asia and Pacific Market Value (USD Million) Forecast by Application, 2020 to 2035
  • Table 22: Middle East & Africa Market Value (USD Million) Forecast by Country, 2020 to 2035
  • Table 23: Middle East & Africa Market Value (USD Million) Forecast by Classification , 2020 to 2035
  • Table 24: Middle East & Africa Market Value (USD Million) Forecast by Application, 2020 to 2035

List of Figures

  • Figure 1: Global Market Pricing Analysis
  • Figure 2: Global Market Value (USD Million) Forecast 2020-2035
  • Figure 3: Global Market Value Share and BPS Analysis by Classification , 2025 and 2035
  • Figure 4: Global Market Y to o to Y Growth Comparison by Classification , 2025-2035
  • Figure 5: Global Market Attractiveness Analysis by Classification
  • Figure 6: Global Market Value Share and BPS Analysis by Application, 2025 and 2035
  • Figure 7: Global Market Y to o to Y Growth Comparison by Application, 2025-2035
  • Figure 8: Global Market Attractiveness Analysis by Application
  • Figure 9: Global Market Value (USD Million) Share and BPS Analysis by Region, 2025 and 2035
  • Figure 10: Global Market Y to o to Y Growth Comparison by Region, 2025-2035
  • Figure 11: Global Market Attractiveness Analysis by Region
  • Figure 12: North America Market Incremental Dollar Opportunity, 2025-2035
  • Figure 13: Latin America Market Incremental Dollar Opportunity, 2025-2035
  • Figure 14: Western Europe Market Incremental Dollar Opportunity, 2025-2035
  • Figure 15: Eastern Europe Market Incremental Dollar Opportunity, 2025-2035
  • Figure 16: East Asia Market Incremental Dollar Opportunity, 2025-2035
  • Figure 17: South Asia and Pacific Market Incremental Dollar Opportunity, 2025-2035
  • Figure 18: Middle East & Africa Market Incremental Dollar Opportunity, 2025-2035
  • Figure 19: North America Market Value Share and BPS Analysis by Country, 2025 and 2035
  • Figure 20: North America Market Value Share and BPS Analysis by Classification , 2025 and 2035
  • Figure 21: North America Market Y to o to Y Growth Comparison by Classification , 2025-2035
  • Figure 22: North America Market Attractiveness Analysis by Classification
  • Figure 23: North America Market Value Share and BPS Analysis by Application, 2025 and 2035
  • Figure 24: North America Market Y to o to Y Growth Comparison by Application, 2025-2035
  • Figure 25: North America Market Attractiveness Analysis by Application
  • Figure 26: Latin America Market Value Share and BPS Analysis by Country, 2025 and 2035
  • Figure 27: Latin America Market Value Share and BPS Analysis by Classification , 2025 and 2035
  • Figure 28: Latin America Market Y to o to Y Growth Comparison by Classification , 2025-2035
  • Figure 29: Latin America Market Attractiveness Analysis by Classification
  • Figure 30: Latin America Market Value Share and BPS Analysis by Application, 2025 and 2035
  • Figure 31: Latin America Market Y to o to Y Growth Comparison by Application, 2025-2035
  • Figure 32: Latin America Market Attractiveness Analysis by Application
  • Figure 33: Western Europe Market Value Share and BPS Analysis by Country, 2025 and 2035
  • Figure 34: Western Europe Market Value Share and BPS Analysis by Classification , 2025 and 2035
  • Figure 35: Western Europe Market Y to o to Y Growth Comparison by Classification , 2025-2035
  • Figure 36: Western Europe Market Attractiveness Analysis by Classification
  • Figure 37: Western Europe Market Value Share and BPS Analysis by Application, 2025 and 2035
  • Figure 38: Western Europe Market Y to o to Y Growth Comparison by Application, 2025-2035
  • Figure 39: Western Europe Market Attractiveness Analysis by Application
  • Figure 40: Eastern Europe Market Value Share and BPS Analysis by Country, 2025 and 2035
  • Figure 41: Eastern Europe Market Value Share and BPS Analysis by Classification , 2025 and 2035
  • Figure 42: Eastern Europe Market Y to o to Y Growth Comparison by Classification , 2025-2035
  • Figure 43: Eastern Europe Market Attractiveness Analysis by Classification
  • Figure 44: Eastern Europe Market Value Share and BPS Analysis by Application, 2025 and 2035
  • Figure 45: Eastern Europe Market Y to o to Y Growth Comparison by Application, 2025-2035
  • Figure 46: Eastern Europe Market Attractiveness Analysis by Application
  • Figure 47: East Asia Market Value Share and BPS Analysis by Country, 2025 and 2035
  • Figure 48: East Asia Market Value Share and BPS Analysis by Classification , 2025 and 2035
  • Figure 49: East Asia Market Y to o to Y Growth Comparison by Classification , 2025-2035
  • Figure 50: East Asia Market Attractiveness Analysis by Classification
  • Figure 51: East Asia Market Value Share and BPS Analysis by Application, 2025 and 2035
  • Figure 52: East Asia Market Y to o to Y Growth Comparison by Application, 2025-2035
  • Figure 53: East Asia Market Attractiveness Analysis by Application
  • Figure 54: South Asia and Pacific Market Value Share and BPS Analysis by Country, 2025 and 2035
  • Figure 55: South Asia and Pacific Market Value Share and BPS Analysis by Classification , 2025 and 2035
  • Figure 56: South Asia and Pacific Market Y to o to Y Growth Comparison by Classification , 2025-2035
  • Figure 57: South Asia and Pacific Market Attractiveness Analysis by Classification
  • Figure 58: South Asia and Pacific Market Value Share and BPS Analysis by Application, 2025 and 2035
  • Figure 59: South Asia and Pacific Market Y to o to Y Growth Comparison by Application, 2025-2035
  • Figure 60: South Asia and Pacific Market Attractiveness Analysis by Application
  • Figure 61: Middle East & Africa Market Value Share and BPS Analysis by Country, 2025 and 2035
  • Figure 62: Middle East & Africa Market Value Share and BPS Analysis by Classification , 2025 and 2035
  • Figure 63: Middle East & Africa Market Y to o to Y Growth Comparison by Classification , 2025-2035
  • Figure 64: Middle East & Africa Market Attractiveness Analysis by Classification
  • Figure 65: Middle East & Africa Market Value Share and BPS Analysis by Application, 2025 and 2035
  • Figure 66: Middle East & Africa Market Y to o to Y Growth Comparison by Application, 2025-2035
  • Figure 67: Middle East & Africa Market Attractiveness Analysis by Application
  • Figure 68: Global Market - Tier Structure Analysis
  • Figure 69: Global Market - Company Share Analysis
Dashboard
Dashboard
Dashboard
Dashboard
Dashboard
Dashboard

Our Research Products

Full Research Suite

The "Full Research Suite" delivers actionable market intel, deep dives on markets or technologies, so clients act faster, cut risk, and unlock growth.

Competitor Leaderboard Report

The Leaderboard benchmarks and ranks top vendors, classifying them as Established Leaders, Leading Challengers, or Disruptors & Challengers.

Future Leaders Index

Locates where complements amplify value and substitutes erode it, forecasting net impact by horizon

Market Data & Forecasts

We deliver granular, decision-grade intel: market sizing, 5-year forecasts, pricing, adoption, usage, revenue, and operational KPIs—plus competitor tracking, regulation, and value chains—across 60 countries broadly.

Market Focus Report

Spot the shifts before they hit your P&L. We track inflection points, adoption curves, pricing moves, and ecosystem plays to show where demand is heading, why it is changing, and what to do next across high-growth markets and disruptive tech

Survey Report

Real-time reads of user behavior. We track shifting priorities, perceptions of today’s and next-gen services, and provider experience, then pace how fast tech moves from trial to adoption, blending buyer, consumer, and channel inputs with social signals (#WhySwitch, #UX).

Bespoke Reports

Partner with our analyst team to build a custom report designed around your business priorities. From analysing market trends to assessing competitors or crafting bespoke datasets, we tailor insights to your needs.

Supplier Intelligence

Discovery & Profiling

Capacity & Footprint

Performance & Risk

Compliance & Governance

Commercial Readiness

Who Supplies Whom

Scorecards & Shortlists

Playbooks & Docs

Category Intelligence

Definition & Scope

Demand & Use Cases

Cost Drivers

Market Structure

Supply Chain Map

Trade & Policy

Operating Norms

Deliverables

Buyer Intelligence

Account Basics

Spend & Scope

Procurement Model

Vendor Requirements

Terms & Policies

Entry Strategy

Pain Points & Triggers

Outputs

Pricing Analysis

Benchmarks

Trends

Should-Cost

Indexation

Landed Cost

Commercial Terms

Deliverables

Brand Analysis

Positioning & Value Prop

Share & Presence

Customer Evidence

Go-to-Market

Digital & Reputation

Compliance & Trust

KPIs & Gaps

Outputs

Full Research Suite comprises of:

Market outlook & trends analysis

Market outlook & trends analysis

Interviews & case studies

Interviews & case studies

Strategic recommendations

Strategic recommendations

Vendor profiles & capabilities analysis

Vendor profiles & capabilities analysis

5-year forecasts

5-year forecasts

8 regions and 60+ country-level data splits

8 regions and 60+ country-level data splits

Market segment data splits

Market segment data splits

12 months of continuous data updates

12 months of continuous data updates

DELIVERED AS:

PDF EXCEL ONLINE

Full Research Suite


$5000

$7500

$10000

Buy Report Now
Similar Industry Reports

Similar Industry Reports

Particle Board Market

Particle Board Market Size and Share Forecast Outlook 2025 to 2035

Particle Foam Molding Machines Market

Particle Foam Molding Machines Market Size and Share Forecast Outlook 2025 to 2035

Particle Counter Market

Particle Counter Market Growth – Trends & Forecast 2018-2028

Particle Size Analyzers Market

Particle Size Analyzers Market

Nanoparticle Technology Market

Nanoparticle Technology Market Size and Share Forecast Outlook 2025 to 2035

Microparticle Injectables Market

Microparticle Injectables Market

Lipid Nanoparticles Market

Lipid Nanoparticles Market Insights - Growth & Forecast 2025 to 2035

Silver Nanoparticles Market

Silver Nanoparticles Market Size and Share Forecast Outlook 2025 to 2035

Acrylic Fine Particle Market

Acrylic Fine Particle Market Size and Share Forecast Outlook 2025 to 2035

Platinum Nanoparticles Market

Platinum Nanoparticles Market

Colloidal Metal Particles Market

Colloidal Metal Particles Market - Growth & Demand 2025 to 2035

Cerium Oxide Nanoparticle Market

Cerium Oxide Nanoparticle Market Growth – Trends & Forecast 2024-2034

Metal Nitride Nanoparticles Market

Metal Nitride Nanoparticles Market

Colloidal Selenium Nanoparticles Market

Colloidal Selenium Nanoparticles Market Size and Share Forecast Outlook 2025 to 2035

Tungsten Disulphide Nanoparticles Market

Tungsten Disulphide Nanoparticles Market

Metal and Metal Oxide Nanoparticle Market

Metal & Metal Oxide Nanoparticles Market Growth – Trends & Forecast 2024-2034

Reinforced Nonwoven Plastics Market

Reinforced Nonwoven Plastics Market Size and Share Forecast Outlook 2025 to 2035

Fiber Reinforced Polymer Panel and Sheet Market

Fiber Reinforced Polymer Panel and Sheet Market Size and Share Forecast Outlook 2025 to 2035

Fiber Reinforced Plastic (FRP) Panels & Sheets Market

Fiber Reinforced Plastic (FRP) Panels & Sheets Market Size and Share Forecast Outlook 2025 to 2035

Fiber Reinforced Polymer (FRP) Rebars Market

Fiber Reinforced Polymer (FRP) Rebars Market Size and Share Forecast Outlook 2025 to 2035

Future Market Insights

Particle Reinforced Aluminum Matrix Composite Brake Disc for Electric Automobiles Market

Chat With MaRIA

Chat With

MaRIA

Hi There, I am MaRIA, Your Market Research Intelligence Assistant. How may I help you?