The Passive Optical Network Market is estimated to be valued at USD 31.2 billion in 2025 and is projected to reach USD 118.6 billion by 2035, registering a compound annual growth rate (CAGR) of 14.3% over the forecast period.
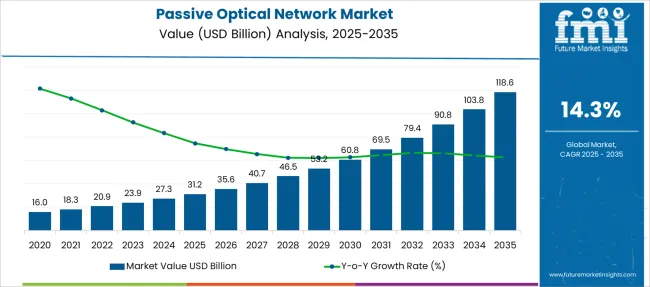
| Metric | Value |
|---|---|
| Passive Optical Network Market Estimated Value in (2025 E) | USD 31.2 billion |
| Passive Optical Network Market Forecast Value in (2035 F) | USD 118.6 billion |
| Forecast CAGR (2025 to 2035) | 14.3% |
The passive optical network (PON) market is undergoing sustained expansion due to rising bandwidth consumption, fiber-to-the-home (FTTH) penetration, and growing adoption of cloud-based infrastructure. Advancements in network scalability, power efficiency, and reduced operational costs have reinforced the viability of passive systems over legacy copper-based technologies.
Investments in fiber rollouts by telecom providers and government-supported broadband initiatives are further accelerating deployment across residential, commercial, and industrial sectors. The market is also being shaped by the convergence of fixed and mobile networks, requiring robust, high-speed backbone connectivity.
As smart city projects, data center connectivity, and 5G backhaul requirements continue to grow, PON technologies are expected to remain central to last-mile network architecture. Looking forward, the integration of AI-powered network management and the shift toward software-defined access networks will continue to offer efficiency gains and new service capabilities.
The market is segmented by Component and Structure and region. By Component, the market is divided into Optical Power Splitters, Optical Filters, and Wavelength Division Multiplexer/De-multiplexer. In terms of Structure, the market is classified into Gigabit (GPON) and Ethernet Passive Optical Networks (EPON). Regionally, the market is classified into North America, Latin America, Western Europe, Eastern Europe, Balkan & Baltic Countries, Russia & Belarus, Central Asia, East Asia, South Asia & Pacific, and the Middle East & Africa.
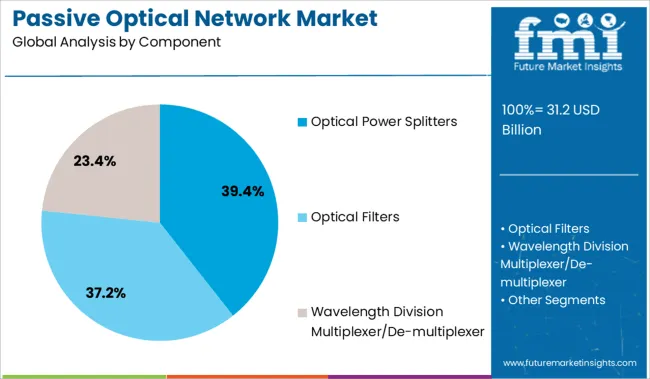
Optical power splitters are projected to account for 39.4% of the total market revenue in 2025, making them the leading component within the passive optical network ecosystem. Their dominance has been driven by their critical function in distributing optical signals from a single input source to multiple outputs without requiring power, enabling high-density, cost-effective network configurations.
The increased deployment of FTTH and fiber-to-the-building (FTTB) infrastructure has resulted in higher utilization of splitters in access networks. The ability to support a wide temperature range, low insertion loss, and minimal maintenance has made them well-suited for large-scale outdoor installations.
As network operators aim to extend fiber access deeper into suburban and rural zones, optical splitters continue to be selected for their passive reliability, compact form factor, and compatibility with both central office and remote terminal applications.
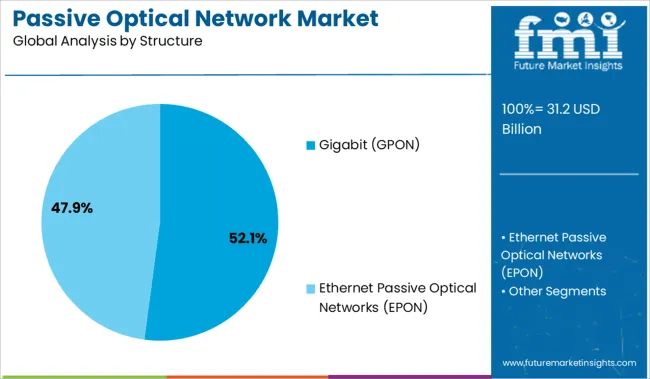
Gigabit passive optical networks (GPON) are expected to dominate the structure segment with 52.1% of the market revenue in 2025. This lead is attributed to GPON’s efficient downstream and upstream bandwidth capabilities, which are well-matched to modern multi-service demands including voice, video, and data.
Its standardized architecture and interoperability with existing infrastructure have facilitated rapid adoption among service providers seeking to upgrade legacy networks. Lower capital and operational expenditures, combined with high user density support, have made GPON the preferred choice in urban broadband deployment.
Additionally, its robust security features and support for advanced QoS protocols have strengthened its application in enterprise networks and critical communication environments. As digital transformation efforts expand across industries and high-speed internet access becomes a baseline utility, GPON-based infrastructure continues to be prioritized for its balance of performance, scalability, and cost-efficiency.
The expansion of the passive optical network market is being driven by the increasing penetration of telecom and internet services. The market will be driven by the increased demand for bandwidth as well as the rising use of telecom and internet services. As data-intensive applications like video on demand, videoconferencing, and Voice over Internet Protocol (VoIP) gain popularity, there is likely to be an increase in the need for Ethernet Passive Optical Network (EPON) technology.
According to the IAMAI-Kantar ICUBE 2024, the number of active Internet users in India is expected to climb from 27.3 million in 2024 to 31.2 million by 2025, a 45% increase over the next five years. As a result, as telecom and internet services become more widely used, so will the demand for passive optical networks.
The demand for passive optical networks is rising as more people use cloud-based services and high-speed internet. The deployment of the passive optical network is accelerated by technologies utilizing optical splitters. The network service providers and internet service providers want to be ready to manage massive data traffic through the network and satisfy the needs of every individual user since they perceive an opportunity as a result of the exponential growth in demand.
The demand for passive optical networks is rising as a result of improvements in gigabit passive optical network (GPON) SoC technology. Sales of passive optical networks are driven by the development and implementation of fiber-to-the-home (FTTH) networks all over the world. Passive optical network utilization is accelerating as a result of new technologies' demand for high bandwidth applications. The minimal energy consumption when in use emphasizes the need for passive optical networks.
Since it is a point-to-multipoint system, a PON can transport data more effectively. The infrastructure needed for this form of design is drastically reduced since the main transmission line may be divided up into several little independent lines. All PONs employs unpowered splitters and optical cables, however, there are several variations.
During the anticipated period, the global passive optical network (PON) equipment market is anticipated to grow at a rapid rate due to the low cost of ownership and good return on investment. Due to the low cost of equipment installation, passive optical networks (PON) significantly reduce the total cost of ownership (TCO).
Additionally, highly efficient machinery may deliver substantial returns on investments. With PON, a passive distribution network with a high degree of centralization is used to accomplish this low cost of ownership. Due to reductions in both capital and operational expenses, PON also saves a substantial amount on the total cost of ownership. The riser closets and workgroup switches accounted for the majority of capital investment in the conventional network.
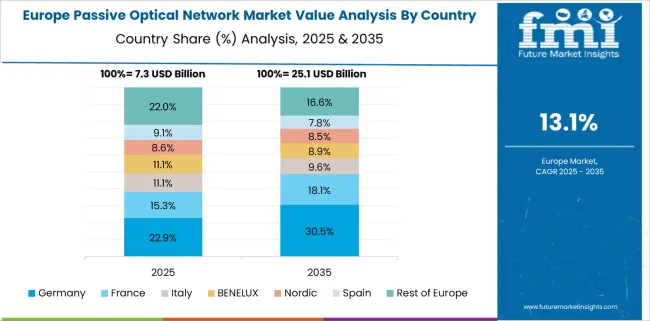
The Europe passive optical network (PON) market is rising due to the heightened budget allocated by the European Union (E.U.) to extend the coverage of passive optical networks in the region. The current requirements for access networks are not limited to transferring data streams from/to the internet. The popularity of Netflix, Amazon T.V., and other OTT platforms has increased the demand for bandwidth. Additionally, the advent of interactive gaming and video-on-demand has surged the deployment of broadband infrastructures. The passive optical network (PON), owing to its large bandwidth, is currently being perceived as the proper technology to enable this. PON technology is being adopted extensively and employed in various areas across the globe, thus enhancing the passive optical network market size in Europe.
In 2025, Europe held a revenue share of 23.2%, making it a potential market share for passive optical technology. Governmental support and involvement as a financial partner contribute to the expansion of the global market. Global market share increases due to the development of strong ecosystems of industry players, goods, and services, as well as interesting knowledge of PON advantages in this area.
In May 2024, Proximus, a leading Belgian operator, partnered with Nokia, a comms tech provider, to launch the first-ever PON live network, which connects the Havenhuis building in Antwerp and Proximus central office. The new deployment is in line with the inspiring 2025 vision of Proximus to boost its position as the leading fixed broadband network provider in Belgium.
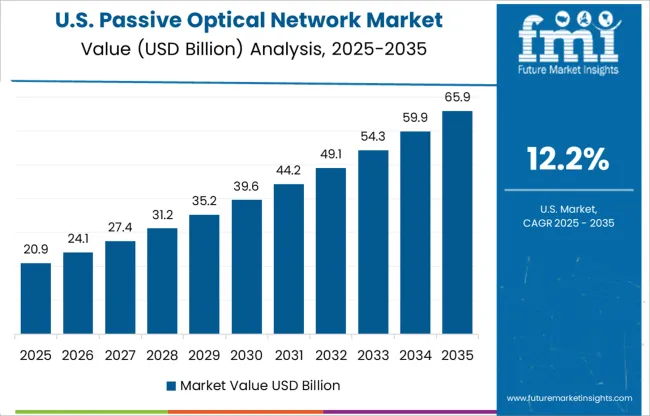
With a revenue share of 34.5%, the USA is rapidly catching up to become the market leader for passive optical networks. The region's expanding need for higher bandwidth applications fuels the market's expansion. The demand for passive optical networks is being further supported by growing awareness of environmentally friendly network solutions. The growth of fiber city initiatives in this area fuels the demand for passive optical networks. The need for effective bandwidth from an increasing number of social media influencers further suggests that the worldwide industry is likely to expand.
Further, the USA passive optical network market is expected to be driven by the leading advancements of optical network services by the key players present in the country. In addition to this, federal I.T. managers have begun gravitating towards a passive optical network (PON) as an effective substitute for copper-based Ethernet, thus boosting the demand for PON services. The market is further being propelled by strong optical network setups and growing demand for energy conservation. Additionally, factors such as USA telecom deployment plans, the increasing number of cable operators, and Google Fibre's expansion are also predicted to bolster the passive optical network market demand over the forecast period.
The various passive optical network disadvantages, such as difficulty detecting a failure, data transfer rate slow down due to increased distance between splitters and end-users, and bandwidth issues with individual users, may hinder the market growth in the coming years.
The Japan passive optical network (PON) market size is anticipated to witness healthy growth over the forecast period owing to rising government initiatives in the region. The demand for the passive optical network (PON) is further expected to strengthen over the stipulated time period owing to robustly rising online traffic and extensive futuristic services, such as 5G and beyond mobile communication applications and services, such as high-definition video, Internet of things, artificial intelligence, and big-data analysis.
Further, the flexibility and capability afforded by passive optical network (PON) technology to carry higher bandwidths is predicted to enhance the market growth of passive optical networks (PON) in the coming years. The development of a passive optical network (PON) for a high split ratio, 50G and 100G data rate, and extended reach is also anticipated to maneuver the market growth.
The South Korean passive optical network (PON) market is expected to flourish over the predicted time frame due to the commercialization of WDM-PON aimed at providing 100 Mbits to each home for future video-centric services. Additionally, the ongoing research and development to enhance the PON services are also predicted to invigorate the passive optical network (PON) market in the region. The demand for PON is further being propelled by the growing requirement to upgrade pre-existing networks to PON/ passive optical networks for greater broadband width and the rising number of connected devices both in and out of residential homes, thus supporting the South Korean passive optical network (PON) market growth.
With a market share of 40%, China holds the top spot in the Asia Pacific market for passive optical networks. The market for passive optical networks is expanding as wireless to wired optical communication transitions are starting in China. Research and development, investments, and rising internet usage all support demand for passive optical network fuels, which further forecasts market expansion.
The availability of optical fiber cable (OFC) connection from state and district capitals to block-level in India promotes the use of passive optical networks in this area. This region's technological innovations and improvements in systems administration support the expansion of the worldwide passive optical network market.
Using existing technology, startups can avoid costly modifications to satisfy client requests. To guarantee that future client needs are contained within the same technology family, service providers observe technological evolution in addition to its durability. Better advances on that front are inspired by the capability of sharing the same connection across several users without any active components.
Among startups, CableLabs and Embedded are two that are utilizing conventional methods to encourage cutting-edge variants. Several additional startups, such as Capgemini Engineering, Fujitsu Network Communications, Mavenir Systems Inc., Radisys Corporation, Signal System Management, etc., are making headway in the passive optical network market share.
The passive optical network market players are concentrating on technical developments to increase the networks' speed and effectiveness. Businesses are switching from the 2.5Gbit/s and 1.25Gbit/s data rates of the gigabit ethernet passive optical network (GPON) to the maximum 10Gbit/s symmetric speeds of XGS-PON and other technologies like Next-Generation Passive Optical Network 2 and 25 Gigabit Symmetrical Passive Optical Network. Due to the widespread use of smart grids, e-government services, and cloud computing, the market trends for passive optical networks are on the upswing.
Recent Developments in the Passive Optical Network Market:
| Report Attribute | Details |
|---|---|
| Growth Rate | CAGR of 14.3% from 2025 to 2035 |
| The base year for estimation | 2024 |
| Historical data | 2020 to 2024 |
| Forecast period | 2025 to 2035 |
| Quantitative units | Revenue in USD million and CAGR from 2025 to 2035 |
| Report Coverage | Revenue forecast, volume forecast, company ranking, competitive landscape, growth factors, trends, and Pricing Analysis. |
| Segments Covered | Component Structure Region |
| Regional scope | North America; Western Europe; Eastern Europe; Middle East; Africa; ASEAN; South Asia; Rest of Asia; Australia; and New Zealand |
| Country scope | USA, Canada, Mexico, Germany, United Kingdom, France, Italy, Spain, Russia, Belgium, Poland, Czech Republic, China, India, Japan, Australia, Brazil, Argentina, Colombia, Saudi Arabia, United Arab Emirates, Iran, South Africa |
| Key companies profiled | ZTE Corporation; Nokia; Calix; FUJITSU; Mitsubishi Electric Corporation; NXP Semiconductors; ADTRAN Inc.; Huawei Technologies Co. Ltd.; Extralink; TP-Link Technologies Co. Ltd.; Fotech Solutions Ltd.; Intelligent Fiber Optic Systems ; Corporation (IFOS); OptaSense; Silixa Ltd; RJC Enterprises |
| Customization scope | Free report customization (equivalent to up to 8 analysts' working days) with purchase. Addition or alteration to country, regional & segment scope. |
| Pricing and purchase options | Avail customized purchase options to meet your exact research needs. |
The global passive optical network market is estimated to be valued at USD 31.2 billion in 2025.
The market size for the passive optical network market is projected to reach USD 118.6 billion by 2035.
The passive optical network market is expected to grow at a 14.3% CAGR between 2025 and 2035.
The key product types in passive optical network market are optical power splitters, optical filters and wavelength division multiplexer/de-multiplexer.
In terms of structure, gigabit (gpon) segment to command 52.1% share in the passive optical network market in 2025.


Full Research Suite comprises of:
Market outlook & trends analysis
Interviews & case studies
Strategic recommendations
Vendor profiles & capabilities analysis
5-year forecasts
8 regions and 60+ country-level data splits
Market segment data splits
12 months of continuous data updates
DELIVERED AS:
PDF EXCEL ONLINE
Gigabit Passive Optical Network (GPON) Market Size and Share Forecast Outlook 2025 to 2035
Gigabit Passive Optical Network Equipment Market Size and Share Forecast Outlook 2025 to 2035
Passive Temperature-Controlled Packaging Solutions Market Size and Share Forecast Outlook 2025 to 2035
Passive and Interconnecting Electronic Components Market Size and Share Forecast Outlook 2025 to 2035
Passive Fire Protection Market Size and Share Forecast Outlook 2025 to 2035
Passive Fire Protection Materials Market Size and Share Forecast Outlook 2025 to 2035
Passive Infrared Sensor Market Size and Share Forecast Outlook 2025 to 2035
Passive Prosthetics Market
Passive Tunable Integrated Circuits Market
Passive Optical Components Market Size and Share Forecast Outlook 2025 to 2035
Integrated Passive Devices (IPDs) Market
Optical Spectrum Analyzer Market Size and Share Forecast Outlook 2025 to 2035
Optical Extinction Analyzer Market Size and Share Forecast Outlook 2025 to 2035
Optical Character Recognition Market Forecast and Outlook 2025 to 2035
Optical Satellite Market Size and Share Forecast Outlook 2025 to 2035
Optical Imaging Market Size and Share Forecast Outlook 2025 to 2035
Optical Whitening Agents Market Size and Share Forecast Outlook 2025 to 2035
Optical Fingerprint Collector Market Size and Share Forecast Outlook 2025 to 2035
Optical Lens Materials Market Size and Share Forecast Outlook 2025 to 2035
Optical Microscope Market Size and Share Forecast Outlook 2025 to 2035

Thank you!
You will receive an email from our Business Development Manager. Please be sure to check your SPAM/JUNK folder too.
Chat With
MaRIA