

- Market Size (2026)
- USD 16.3 Bn
- Forecast (2036)
- USD 34.01 Bn
- CAGR (2026 to 2036)
- 7.6%
PC ODM Market Size, Market Forecast and Outlook By FMI
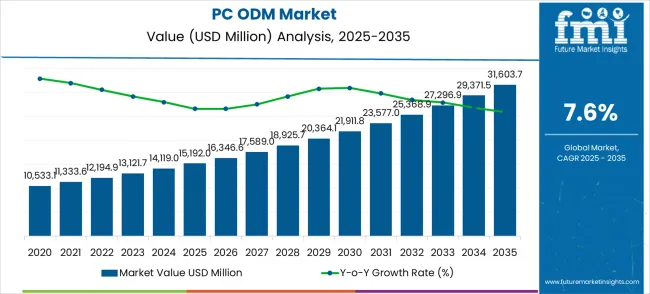
The pc odm market was valued at USD 15.2 billion in 2025. The market is set to reach USD 16.3 billion by 2026-end and grow at a CAGR of 7.6% between 2026-2036 to reach USD 34.0 billion by 2036. Notebook PCs will dominate with a 52.8% share, while Consumer PC will lead with a 45.7% share.
Summary of the PC ODM Market
- Demand and Growth Drivers
- Sustainability-led procurement and material substitution is likely to support demand for pc odm products as producers look for cost-effective and compliant material alternatives.
- Growth in e-commerce and logistics infrastructure is likely to remain a growth driver as packaging and material requirements expand across supply chains.
- Environmental compliance requirements and the shift toward recyclable and biodegradable material alternatives are expected to support adoption during the forecast period.
- Product and Segment View
- Notebook PCs is likely to remain a leading Product Type segment at 52.8%, supported by demand across manufacturing, logistics, and construction end-uses.
- Consumer PC is likely to lead the Application category at 45.7%, driven by high-volume procurement in logistics and industrial operations.
- Demand is shifting toward higher-value product formats as end-users prioritize operational efficiency and cost optimization.
- Geography and Competitive Outlook
- China is likely to remain a key market owing to its large manufacturing base, expanding logistics infrastructure, and increasing focus on material compliance.
- India is likely to sustain demand on account of rapid industrialization, growing export-oriented manufacturing, and infrastructure development.
- Companies that can combine manufacturing scale, distribution reach, and compliance capabilities are likely to gain traction during the forecast period.
- Analyst Opinion
- The PC ODM Market is evolving from a commodity-oriented supply category into a more defined, compliance-driven procurement category with structured buyer expectations.
- Adoption is increasing due to raw material sourcing optimization and supply chain consolidation.
- The market is also benefiting from capacity expansion across manufacturing hubs.
- Demand is further supported by the need for solutions that balance cost, performance, and regulatory compliance across end-use applications.
Key Takeaways, Market Size, and Forecast
- The PC ODM Market was valued at USD 15.19 billion in 2025.
- By 2036, the PC ODM Market is expected to be worth USD 34.01 billion.
- From 2026 to 2036, the market is projected to expand at a CAGR of 7.6%.
- The market is projected to create an incremental opportunity of USD 17.66 billion between 2026 and 2036.
- In 2026, Notebook PCs is expected to account for 52.8% of the Product Type segment, driven by steady procurement volumes and standardization across manufacturing applications.
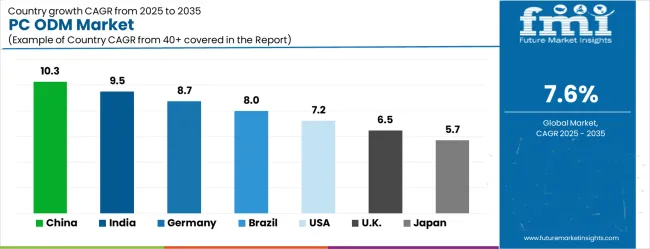
- China (10.3%) and India (9.5%) are two of the fastest growing markets in the world.
PC ODM Market Definition
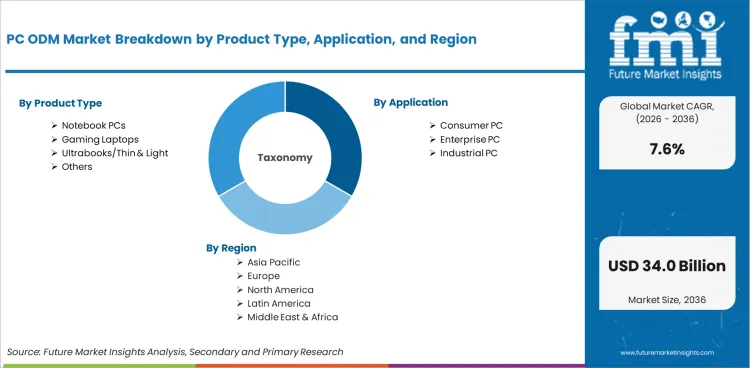
The PC ODM Market encompasses Notebook PCs, Gaming Laptops, Ultrabooks/Thin & Light, Others used across Consumer PC, Enterprise PC, Industrial PC applications. The market covers products distributed through direct and indirect channels across global regions during the 2026 to 2036 forecast period.
PC ODM Market Inclusions
Market scope encompasses all commercially traded pc odm products categorized by Product Type, Application. Revenue sizing covers the period from 2026 to 2036 across North America, Latin America, Europe, East Asia, South Asia and Pacific, and Middle East and Africa.
PC ODM Market Exclusions
The scope does not include raw materials sold in unprocessed bulk form, custom-engineered solutions for single-use applications, and products intended solely for research and development purposes. Products manufactured solely for captive consumption or internal use without commercial distribution are also excluded.
PC ODM Market Research Methodology
- Primary Research: FMI analysts conducted interviews with manufacturers, distributors, and end-use procurement teams across key markets to validate demand patterns and pricing dynamics.
- Desk Research: Combined data from industry associations, regulatory filings, trade publications, and manufacturer disclosures.
- Market Sizing and Forecasting: Bottom-up aggregation across product types, end-use applications, and regions, with adoption curve modeling for the 2026 to 2036 period.
- Data Validation: Cross-checked quarterly against production statistics, trade data, and manufacturer-reported volumes.
Why is the PC ODM Market Growing?
- Sustainability-led procurement and material substitution is creating structured demand for pc odm products as end-users seek compliant, cost-effective material alternatives.
- China leads growth at 10.3%, supported by its large manufacturing base.
The PC ODM Market is expanding at a CAGR of 7.6% from 2026 to 2036, reaching USD 34.01 billion by the end of the forecast period. Growth reflects raw material sourcing optimization and supply chain consolidation, combined with capacity expansion across manufacturing hubs. End-use demand is concentrated in segments that require consistent quality, regulatory compliance, and supply reliability. Notebook PCs accounts for 52.8% of the Product Type segment, reflecting its broad applicability across core applications.
Material substitution trends and sustainability mandates are reshaping procurement decisions across the value chain. The Application breakdown shows Consumer PC holding 45.7% share, supported by high-volume procurement in logistics and industrial operations. Companies with established manufacturing infrastructure, distribution networks, and compliance capabilities are positioned to capture incremental demand during the forecast period.
Market Segmentation Analysis
- Notebook PCs holds 52.8% of the Product Type segment, reflecting its established position across core applications.
- Consumer PC accounts for 45.7% of the Application category, supported by consistent procurement from primary end-users.
- The market segmentation spans Product Type, Application, reflecting the breadth of commercial applications.
The PC ODM Market is segmented by Product Type, Application. By Product Type, the market includes Notebook PCs, Gaming Laptops, Ultrabooks/Thin & Light, Others. By Application, the market covers Consumer PC, Enterprise PC, Industrial PC.
Insights into the Notebook PCs Product Type Segment
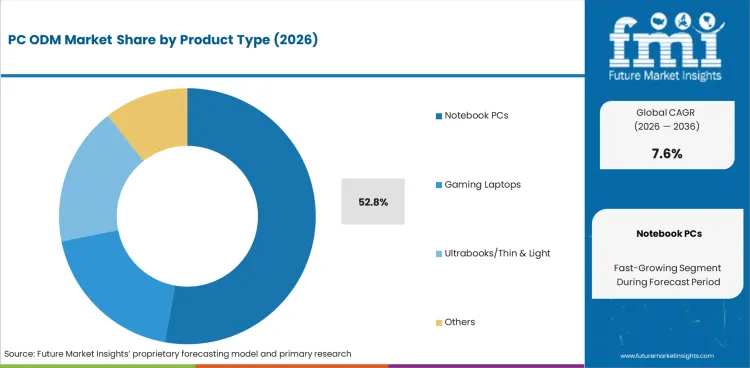
In 2026, Notebook PCs is expected to account for 52.8% of the Product Type segment. Demand is concentrated in manufacturing, logistics, and commercial operations where notebook pcs products deliver consistent performance and procurement efficiency. Other segments include Gaming Laptops and Ultrabooks/Thin & Light, which serve specialized application requirements.
Insights into the Consumer PC Application Segment
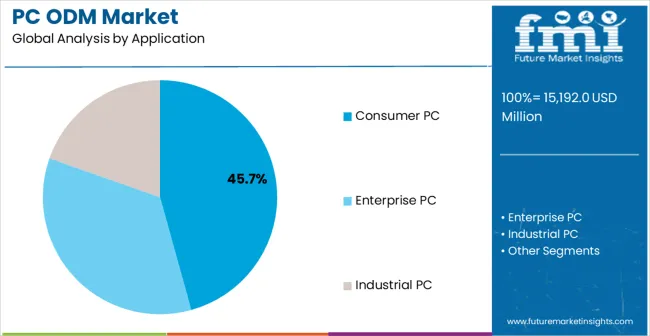
Consumer PC accounts for 45.7% of the Application segment, reflecting its role as the primary demand channel. Industrial and commercial buyers represent the bulk of procurement, with demand shaped by volume requirements, compliance standards, and cost optimization priorities.
PC ODM Market Drivers, Restraints, and Opportunities
- Sustainability-led procurement and material substitution is creating structured demand for pc odm products across end-use categories.
- price sensitivity in commodity applications limits premium positioning.
- automation and process efficiency improvements across production lines is opening new growth vectors for established and emerging market participants.
The PC ODM Market continues to expand on account of raw material sourcing optimization and supply chain consolidation, combined with capacity expansion across manufacturing hubs. Despite price sensitivity in commodity applications limits premium positioning, opportunities are emerging in automation and process efficiency improvements across production lines.
Sustainability-led procurement and material substitution
Demand reflects raw material sourcing optimization and supply chain consolidation. End-users are increasingly prioritizing material compliance, cost efficiency, and supply chain reliability when making procurement decisions. This structural shift is creating consistent demand across primary application categories.
Cost and Scalability Dynamics
Adoption remains influenced by price sensitivity in commodity applications limits premium positioning. Commodity applications face margin pressure, limiting the ability of suppliers to introduce premium-priced alternatives without demonstrated performance advantages.
automation and process efficiency
Growth opportunity is shaped by automation and process efficiency improvements across production lines. Companies that can demonstrate measurable value in operational efficiency, compliance, and total cost of ownership are positioned to capture incremental share during the forecast period.
Analysis of PC ODM Market By Key Countries
.webp "Top Country Growth Comparison Pc Odm Market Cagr (2026 2036)")
| Country | CAGR |
|---|---|
| China | 10.3% |
| India | 9.5% |
| Germany | 8.7% |
| Brazil | 8.0% |
| USA | 7.2% |
| UK | 6.5% |
- China leads at 10.3% CAGR, supported by its large manufacturing base.
- India at 9.5% shows strong demand driven by rapid industrialization.
- Germany (8.7%) and Brazil (8.0%) continue to expand on the back of manufacturing growth and infrastructure investment.
The global PC ODM Market is projected to grow at a CAGR of 7.6% from 2026 to 2036. The study covers more than 30 countries, with key markets detailed below.
Demand Outlook for PC ODM Market in China
China is projected to grow at 10.3% through 2036, supported by its large manufacturing base, expanding logistics infrastructure, and increasing focus on material compliance.
- Large manufacturing base supports high-volume procurement.
- Infrastructure expansion drives demand across construction and logistics sectors.
- Government policies on material compliance and sustainability accelerate adoption.
Future Outlook for PC ODM Market in India
India is projected to grow at 9.5% through 2036, supported by rapid industrialization, growing export-oriented manufacturing, and infrastructure development.
- Rapid industrialization creates expanding demand across core applications.
- Export-oriented manufacturing supports higher procurement volumes.
- Infrastructure development broadens end-use adoption.
Opportunity Analysis of PC ODM Market in Germany
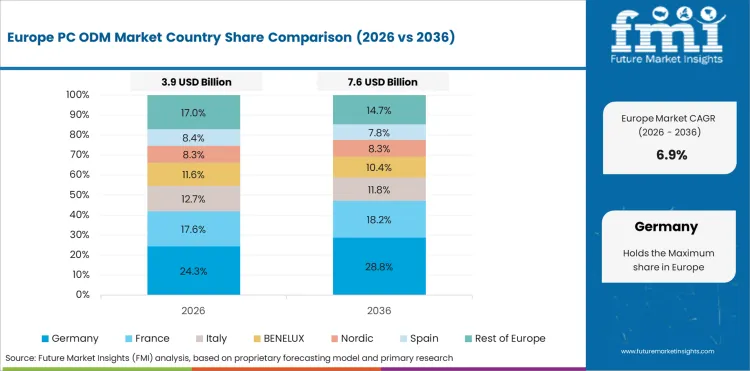
Germany is projected to grow at 8.7% through 2036, supported by stringent EU compliance requirements, advanced manufacturing capabilities, and sustainability-driven procurement policies.
- EU compliance requirements drive adoption of standardized, sustainable products.
- Advanced manufacturing infrastructure supports premium product demand.
- Strong export orientation amplifies domestic production requirements.
In-depth Analysis of PC ODM Market in Brazil
Brazil is projected to grow at 8.0% through 2036, supported by expanding domestic manufacturing, growing export requirements, and increasing adoption of standardized packaging solutions.
- Expanding domestic manufacturing market creates incremental demand.
- Growing export requirements increase adoption of standardized products.
- Infrastructure investment supports broader end-use penetration.
Sales Analysis of PC ODM Market in the United States
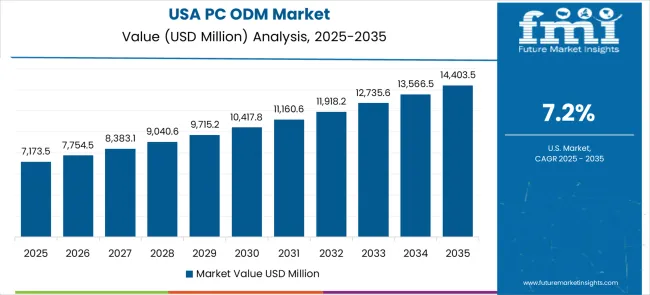
The United States is projected to grow at 7.2% through 2036, supported by mature procurement standards, sustainability mandates, and strong end-use demand across commercial and industrial segments.
- Mature procurement standards ensure consistent demand from established end-users.
- Sustainability mandates shape purchasing decisions across commercial segments.
- E-commerce and logistics growth sustains volume requirements.
Growth Assessment of PC ODM Market in the United Kingdom
UK is projected to grow at 6.5% through 2036, supported by sustainability regulations, established commercial infrastructure, and growing demand for compliant material alternatives.
- Sustainability regulations push adoption of compliant material alternatives.
- Established commercial infrastructure supports consistent procurement volumes.
- Logistics and warehousing expansion sustains growth.
Competitive Landscape and Strategic Positioning
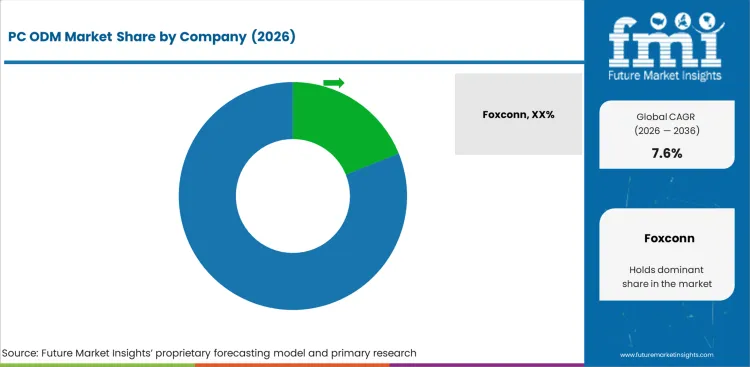
- Foxconn maintains a strong position through integrated manufacturing and distribution infrastructure across key regions.
- Quanta Computer and Pegatron offer diversified product portfolios spanning core application categories.
- Emerging players are focusing on specialized product formats and regional distribution advantages.
Foxconn holds a leading position due to large-scale manufacturing capabilities and established procurement relationships with industrial buyers. Quanta Computer and Pegatron offer complementary product ranges that address overlapping application requirements.
Barriers to entry include capital-intensive manufacturing requirements, established supply chain relationships, and compliance certification timelines. Strategic priorities for market participants include cost optimization, geographic expansion, and compliance-driven product development.
Key Companies in the PC ODM Market
Key global companies leading the pc odm market include:
- Foxconn, Quanta Computer, Pegatron, Compal Electronics maintain strong manufacturing infrastructure, established end-user relationships, and broad product portfolios.
- Wistron Corporation, Inventec Corporation, Huaqin have established regional leadership through focused product strategies and targeted distribution networks.
- Longcheer Technology, Wingtech, Clevo represent emerging participants with differentiated product capabilities and potential for future market positioning.
Competitive Benchmarking: PC ODM Market
| Company | Product Breadth | Manufacturing Scale | Distribution Reach | Geographic Footprint |
|---|---|---|---|---|
| Foxconn | High | High | Strong | Global |
| Quanta Computer | High | High | Strong | Global |
| Pegatron | High | High | Strong | Global |
| Compal Electronics | Medium | High | Moderate | Regional |
| Wistron Corporation | Medium | High | Moderate | Regional |
| Inventec Corporation | Medium | High | Moderate | Regional |
| Huaqin | Medium | Medium | Low | Regional |
| Longcheer Technology | Medium | Medium | Low | Regional |
| Wingtech | Medium | Medium | Low | Regional |
| Clevo | Medium | Medium | Low | Regional |
Source: Future Market Insights competitive analysis, 2026.
Key Players in the PC ODM Market
Major Global Players
- Foxconn
- Quanta Computer
- Pegatron
- Compal Electronics
- Wistron Corporation
- Inventec Corporation
- Huaqin
Emerging Players/Startups
- Longcheer Technology
- Wingtech
- Clevo
- ASUSTek Computer
- MSI (Micro-Star International)
Report Scope and Coverage
| Parameter | Details |
|---|---|
| Quantitative Units | USD 16.35 billion to USD 34.01 billion, at a CAGR of 7.6% |
| Market Definition | The PC ODM Market encompasses Notebook PCs, Gaming Laptops, Ultrabooks/Thin & Light, Others used across Consumer PC, Enterprise PC, Industrial PC applications. |
| Regions Covered | North America, Latin America, Europe, East Asia, South Asia and Pacific, Middle East and Africa |
| Countries Covered | China, India, Germany, Brazil, USA, UK, 30 plus countries |
| Key Companies Profiled | Foxconn, Quanta Computer, Pegatron, Compal Electronics, Wistron Corporation, Inventec Corporation, Huaqin, Longcheer Technology, Wingtech, Clevo, ASUSTek Computer, MSI (Micro-Star International) |
| Forecast Period | 2026 to 2036 |
| Approach | Hybrid bottom-up and top-down methodology starting with verified transaction data, projecting adoption velocity across segments and regions. |
Segmentation
PC ODM Market Segmented by Product Type:
- Notebook PCs
- Gaming Laptops
- Ultrabooks/Thin & Light
- Others
PC ODM Market Segmented by Application:
- Consumer PC
- Enterprise PC
- Industrial PC
PC ODM Market by Region:
- North America
- USA
- Canada
- Mexico
- Latin America
- Brazil
- Chile
- Rest of Latin America
- Western Europe
- Germany
- UK
- Italy
- Spain
- France
- Nordic
- BENELUX
- Rest of Western Europe
- Eastern Europe
- Russia
- Poland
- Hungary
- Balkan & Baltic
- Rest of Eastern Europe
- East Asia
- China
- Japan
- South Korea
- South Asia and Pacific
- India
- ASEAN
- Australia & New Zealand
- Rest of South Asia and Pacific
- Middle East & Africa
- Kingdom of Saudi Arabia
- Other GCC Countries
- Turkiye
- South Africa
- Other African Union
- Rest of Middle East & Africa
Research Sources and Bibliography
- International Organization for Standardization. (2025). ISO Standards for Packaging and Material Testing. ISO.
- World Bank. (2025). Global Manufacturing and Trade Infrastructure Report. World Bank Group.
- United Nations Industrial Development Organization. (2025). UNIDO Industrial Statistics Database. UNIDO.
- ASTM International. (2025). ASTM Standards for Materials and Testing. ASTM.
- Food and Agriculture Organization. (2025). FAO Packaging and Supply Chain Report. FAO.
This bibliography is provided for reader reference. The full Future Market Insights report contains the complete reference list with publication dates, URLs, and supporting data for all cited works.
This Report Answers
- Estimating the size of the PC ODM Market and revenue potential from 2026 to 2036.
- Segmentation by Product Type, Application.
- Insights across more than 30 regional markets.
- Analysis of key growth drivers, restraints, and opportunities.
- Assessment of the competitive landscape and strategic positioning.
- Identification of investment opportunities across segments and regions.
- Supply chain and procurement dynamics tracking.
- Delivery of data in PDF and Excel formats.
Frequently Asked Questions
What is the global market demand for PC ODM in 2026?
In 2026, the global PC ODM Market is expected to be worth USD 16.35 billion.
How big will the PC ODM Market be in 2036?
By 2036, the PC ODM Market is expected to be worth USD 34.01 billion.
How much is demand for PC ODM expected to grow between 2026 and 2036?
Between 2026 and 2036, demand for pc odm is expected to grow at a CAGR of 7.6%.
Which Product Type segment is likely to lead globally by 2026?
Notebook PCs is expected to account for 52.8% of the Product Type segment in 2026, reflecting its dominant position across primary applications.
What is causing PC ODM demand to rise in China?
China is projected to grow at 10.3% through 2036 for the PC ODM Market, supported by its large manufacturing base, expanding logistics infrastructure, and increasing focus on material compliance.
What is causing PC ODM demand to rise in India?
India is projected to grow at 9.5% through 2036 for the PC ODM Market, supported by rapid industrialization, growing export-oriented manufacturing, and infrastructure development.
What does this report mean by 'PC ODM Market definition'?
The PC ODM Market includes Notebook PCs, Gaming Laptops, Ultrabooks/Thin & Light, Others used across Consumer PC, Enterprise PC, Industrial PC applications, covering the 2026 to 2036 forecast period.
How does FMI make the PC ODM forecast and validate it?
Forecasting models use a hybrid bottom-up and top-down approach, starting with verified transaction data and validating against industry production statistics, trade data, and manufacturer disclosures.
Preview the report firsthand - request a free sample
Get SampleGet the brochure for pricing and purchase details.
Get PDFTable of Content
- Global Market Outlook
- Demand-side Trends
- Supply-side Trends
- Technology Roadmap Analysis
- Analysis and Recommendations
- Market Overview
- Market Coverage / Taxonomy
- Market Definition / Scope / Limitations
- Research Methodology
- Chapter Orientation
- Analytical Lens and Working Hypotheses
- Market Structure, Signals, and Trend Drivers
- Benchmarking and Cross-market Comparability
- Company Annual and Sustainability Reports
- Peer-reviewed Journals and Academic Literature
- Corporate Websites, Product Literature, and Technical Notes
- Earnings Decks and Investor Briefings
- Statutory Filings and Regulatory Disclosures
- Technical White Papers and Standards Notes
- Trade Journals, Industry Magazines, and Analyst Briefs
- Conference Proceedings, Webinars, and Seminar Materials
- Government Statistics Portals and Public Data Releases
- Press Releases and Reputable Media Coverage
- Specialist Newsletters and Curated Briefings
- Sector Databases and Reference Repositories
- FMI Internal Proprietary Databases and Historical Market Datasets
- Subscription Datasets and Paid Sources
- Social Channels, Communities, and Digital Listening Inputs
- Additional Desk Sources
- Expert Input and Fieldwork (Primary Evidence)
- Primary Modes
- Qualitative Interviews and Expert Elicitation
- Quantitative Surveys and Structured Data Capture
- Blended Approach
- Why Primary Evidence is Used
- Field Techniques
- Interviews
- Surveys
- Focus Groups
- Observational and In-context Research
- Social and Community Interactions
- Stakeholder Universe Engaged
- C-suite Leaders
- Board Members
- Presidents and Vice Presidents
- R&D and Innovation Heads
- Technical Specialists
- Domain Subject-matter Experts
- Scientists
- Physicians and Other Healthcare Professionals
- Governance, Ethics, and Data Stewardship
- Research Ethics
- Data Integrity and Handling
- Primary Modes
- Tooling, Models, and Reference Databases
- Data Engineering and Model Build
- Data Acquisition and Ingestion
- Cleaning, Normalisation, and Verification
- Synthesis, Triangulation, and Analysis
- Quality Assurance and Audit Trail
- Market Background
- Market Dynamics
- Drivers
- Restraints
- Opportunity
- Trends
- Scenario Forecast
- Demand in Optimistic Scenario
- Demand in Likely Scenario
- Demand in Conservative Scenario
- Opportunity Map Analysis
- Product Life Cycle Analysis
- Supply Chain Analysis
- Investment Feasibility Matrix
- Value Chain Analysis
- PESTLE and Porter’s Analysis
- Regulatory Landscape
- Regional Parent Market Outlook
- Production and Consumption Statistics
- Import and Export Statistics
- Market Dynamics
- Global Market Analysis 2021 to 2025 and Forecast, 2026 to 2036
- Historical Market Size Value (USD Million) Analysis, 2021 to 2025
- Current and Future Market Size Value (USD Million) Projections, 2026 to 2036
- Y-o-Y Growth Trend Analysis
- Absolute $ Opportunity Analysis
- Global Market Pricing Analysis 2021 to 2025 and Forecast 2026 to 2036
- Global Market Analysis 2021 to 2025 and Forecast 2026 to 2036, By Product Type
- Introduction / Key Findings
- Historical Market Size Value (USD Million) Analysis By Product Type, 2021 to 2025
- Current and Future Market Size Value (USD Million) Analysis and Forecast By Product Type, 2026 to 2036
- Notebook PCs
- Gaming Laptops
- Ultrabooks/Thin & Light
- Others
- Notebook PCs
- Y-o-Y Growth Trend Analysis By Product Type, 2021 to 2025
- Absolute $ Opportunity Analysis By Product Type, 2026 to 2036
- Global Market Analysis 2021 to 2025 and Forecast 2026 to 2036, By Application
- Introduction / Key Findings
- Historical Market Size Value (USD Million) Analysis By Application, 2021 to 2025
- Current and Future Market Size Value (USD Million) Analysis and Forecast By Application, 2026 to 2036
- Consumer PC
- Enterprise PC
- Industrial PC
- Consumer PC
- Y-o-Y Growth Trend Analysis By Application, 2021 to 2025
- Absolute $ Opportunity Analysis By Application, 2026 to 2036
- Global Market Analysis 2021 to 2025 and Forecast 2026 to 2036, By Region
- Introduction
- Historical Market Size Value (USD Million) Analysis By Region, 2021 to 2025
- Current Market Size Value (USD Million) Analysis and Forecast By Region, 2026 to 2036
- North America
- Latin America
- Western Europe
- Eastern Europe
- East Asia
- South Asia and Pacific
- Middle East & Africa
- Market Attractiveness Analysis By Region
- North America Market Analysis 2021 to 2025 and Forecast 2026 to 2036, By Country
- Historical Market Size Value (USD Million) Trend Analysis By Market Taxonomy, 2021 to 2025
- Market Size Value (USD Million) Forecast By Market Taxonomy, 2026 to 2036
- By Country
- USA
- Canada
- Mexico
- By Product Type
- By Application
- By Country
- Market Attractiveness Analysis
- By Country
- By Product Type
- By Application
- Key Takeaways
- Latin America Market Analysis 2021 to 2025 and Forecast 2026 to 2036, By Country
- Historical Market Size Value (USD Million) Trend Analysis By Market Taxonomy, 2021 to 2025
- Market Size Value (USD Million) Forecast By Market Taxonomy, 2026 to 2036
- By Country
- Brazil
- Chile
- Rest of Latin America
- By Product Type
- By Application
- By Country
- Market Attractiveness Analysis
- By Country
- By Product Type
- By Application
- Key Takeaways
- Western Europe Market Analysis 2021 to 2025 and Forecast 2026 to 2036, By Country
- Historical Market Size Value (USD Million) Trend Analysis By Market Taxonomy, 2021 to 2025
- Market Size Value (USD Million) Forecast By Market Taxonomy, 2026 to 2036
- By Country
- Germany
- UK
- Italy
- Spain
- France
- Nordic
- BENELUX
- Rest of Western Europe
- By Product Type
- By Application
- By Country
- Market Attractiveness Analysis
- By Country
- By Product Type
- By Application
- Key Takeaways
- Eastern Europe Market Analysis 2021 to 2025 and Forecast 2026 to 2036, By Country
- Historical Market Size Value (USD Million) Trend Analysis By Market Taxonomy, 2021 to 2025
- Market Size Value (USD Million) Forecast By Market Taxonomy, 2026 to 2036
- By Country
- Russia
- Poland
- Hungary
- Balkan & Baltic
- Rest of Eastern Europe
- By Product Type
- By Application
- By Country
- Market Attractiveness Analysis
- By Country
- By Product Type
- By Application
- Key Takeaways
- East Asia Market Analysis 2021 to 2025 and Forecast 2026 to 2036, By Country
- Historical Market Size Value (USD Million) Trend Analysis By Market Taxonomy, 2021 to 2025
- Market Size Value (USD Million) Forecast By Market Taxonomy, 2026 to 2036
- By Country
- China
- Japan
- South Korea
- By Product Type
- By Application
- By Country
- Market Attractiveness Analysis
- By Country
- By Product Type
- By Application
- Key Takeaways
- South Asia and Pacific Market Analysis 2021 to 2025 and Forecast 2026 to 2036, By Country
- Historical Market Size Value (USD Million) Trend Analysis By Market Taxonomy, 2021 to 2025
- Market Size Value (USD Million) Forecast By Market Taxonomy, 2026 to 2036
- By Country
- India
- ASEAN
- Australia & New Zealand
- Rest of South Asia and Pacific
- By Product Type
- By Application
- By Country
- Market Attractiveness Analysis
- By Country
- By Product Type
- By Application
- Key Takeaways
- Middle East & Africa Market Analysis 2021 to 2025 and Forecast 2026 to 2036, By Country
- Historical Market Size Value (USD Million) Trend Analysis By Market Taxonomy, 2021 to 2025
- Market Size Value (USD Million) Forecast By Market Taxonomy, 2026 to 2036
- By Country
- Kingdom of Saudi Arabia
- Other GCC Countries
- Turkiye
- South Africa
- Other African Union
- Rest of Middle East & Africa
- By Product Type
- By Application
- By Country
- Market Attractiveness Analysis
- By Country
- By Product Type
- By Application
- Key Takeaways
- Key Countries Market Analysis
- USA
- Pricing Analysis
- Market Share Analysis, 2025
- By Product Type
- By Application
- Canada
- Pricing Analysis
- Market Share Analysis, 2025
- By Product Type
- By Application
- Mexico
- Pricing Analysis
- Market Share Analysis, 2025
- By Product Type
- By Application
- Brazil
- Pricing Analysis
- Market Share Analysis, 2025
- By Product Type
- By Application
- Chile
- Pricing Analysis
- Market Share Analysis, 2025
- By Product Type
- By Application
- Germany
- Pricing Analysis
- Market Share Analysis, 2025
- By Product Type
- By Application
- UK
- Pricing Analysis
- Market Share Analysis, 2025
- By Product Type
- By Application
- Italy
- Pricing Analysis
- Market Share Analysis, 2025
- By Product Type
- By Application
- Spain
- Pricing Analysis
- Market Share Analysis, 2025
- By Product Type
- By Application
- France
- Pricing Analysis
- Market Share Analysis, 2025
- By Product Type
- By Application
- India
- Pricing Analysis
- Market Share Analysis, 2025
- By Product Type
- By Application
- ASEAN
- Pricing Analysis
- Market Share Analysis, 2025
- By Product Type
- By Application
- Australia & New Zealand
- Pricing Analysis
- Market Share Analysis, 2025
- By Product Type
- By Application
- China
- Pricing Analysis
- Market Share Analysis, 2025
- By Product Type
- By Application
- Japan
- Pricing Analysis
- Market Share Analysis, 2025
- By Product Type
- By Application
- South Korea
- Pricing Analysis
- Market Share Analysis, 2025
- By Product Type
- By Application
- Russia
- Pricing Analysis
- Market Share Analysis, 2025
- By Product Type
- By Application
- Poland
- Pricing Analysis
- Market Share Analysis, 2025
- By Product Type
- By Application
- Hungary
- Pricing Analysis
- Market Share Analysis, 2025
- By Product Type
- By Application
- Kingdom of Saudi Arabia
- Pricing Analysis
- Market Share Analysis, 2025
- By Product Type
- By Application
- Turkiye
- Pricing Analysis
- Market Share Analysis, 2025
- By Product Type
- By Application
- South Africa
- Pricing Analysis
- Market Share Analysis, 2025
- By Product Type
- By Application
- USA
- Market Structure Analysis
- Competition Dashboard
- Competition Benchmarking
- Market Share Analysis of Top Players
- By Regional
- By Product Type
- By Application
- Competition Analysis
- Competition Deep Dive
- Foxconn
- Overview
- Product Portfolio
- Profitability by Market Segments (Product/Age /Sales Channel/Region)
- Sales Footprint
- Strategy Overview
- Marketing Strategy
- Product Strategy
- Channel Strategy
- Quanta Computer
- Pegatron
- Compal Electronics
- Wistron Corporation
- Inventec Corporation
- Huaqin
- Longcheer Technology
- Wingtech
- Clevo
- ASUSTek Computer
- MSI (Micro-Star International)
- Foxconn
- Competition Deep Dive
- Assumptions & Acronyms Used


