Upcycled Pet Ingredients Size and Share Forecast Outlook 2025 to 2035

The upcycled pet ingredients market is projected to be valued at USD 240 million in 2025, expanding to USD 651.4 million in 2035, reflecting an absolute increase of USD 411.4 million over the assessment period. This expansion represents a 10.5% CAGR, resulting in nearly a 2.7X increase in overall market size within the decade.
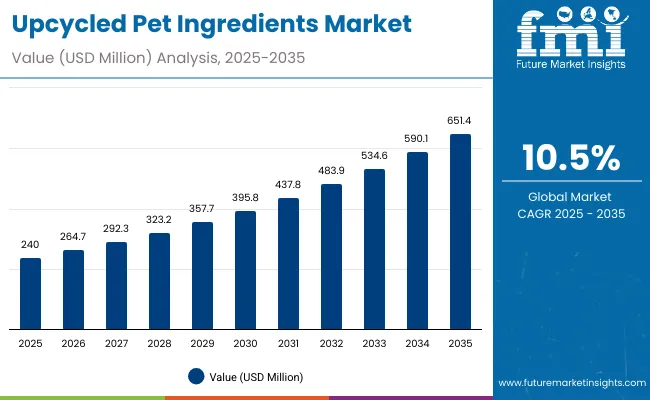
Upcycled Pet Ingredients Market 1

Quick Stats for Upcycled Pet Ingredients

  • Upcycled Pet Ingredients Value (2025): USD 240.0 million
  • Upcycled Pet Ingredients Forecast Value (2035): USD 651.4 million
  • Upcycled Pet Ingredients Forecast CAGR: 10.5%
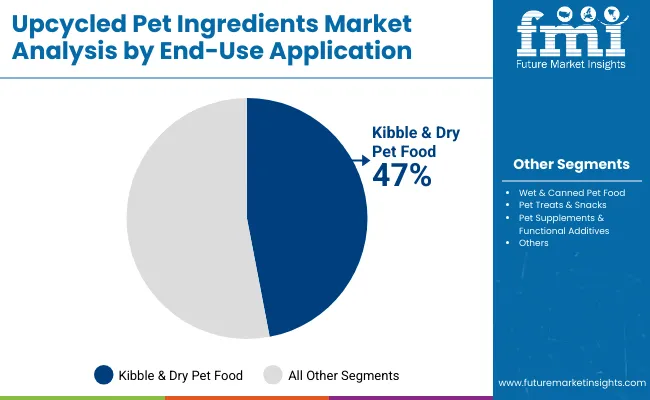
  • Leading Segment in Upcycled Pet Ingredients in 2025, by End-Use Application: Kibble & Dry Pet Food (47%)
  • Key Growth Regions in the Upcycled Pet Ingredients: North America, Asia-Pacific, Europe
  • Top Key Players in Upcycled Pet Ingredients: Darling Ingredients, SARIA Group, Lauridsen Group Inc. (LGI), Tyson Ingredient Solutions, JBS S.A., Sanimax, Baker Commodities, West Coast Reduction Ltd., Pelagia, TripleNine Group.

Upcycled Pet Ingredients Key Takeaways
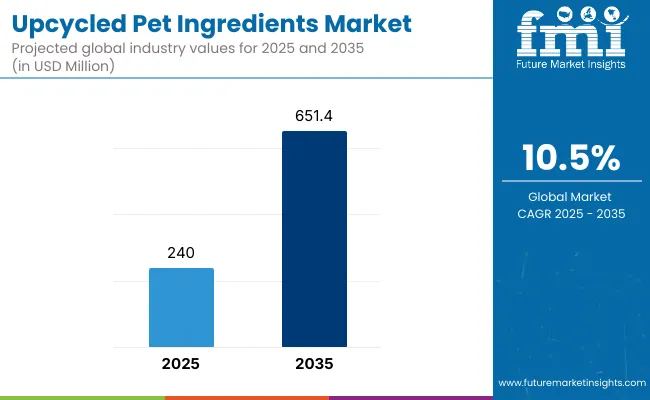
Upcycled Pet Ingredients Market

Metric Value
Upcycled Pet Ingredients Estimated Value in (2025E) USD 240.0 million
Upcycled Pet Ingredients Forecast Value in (2035F) USD 651.4 million
Forecast CAGR (2025 to 2035) 10.5%

During the first half of the forecast horizon (2025 to 2030), the market is anticipated to expand from USD 240 million to approximately USD 395.8 million, generating USD 155.8 million in incremental revenue, equivalent to nearly 38% of the decade’s total growth. This phase is expected to be characterized by steady mainstreaming of upcycled proteins, fibers, and oils in pet food formulations, supported by greater alignment with sustainability narratives and increasing acceptance among premium product categories. Market adoption is likely to be driven by regulatory incentives and stronger partnerships between food processors and pet nutrition companies.

In the second phase (2030 to 2035), the market is forecasted to accelerate significantly, adding USD 255.6 million, which represents 62% of the decade’s growth. Expansion is expected to be catalyzed by advancements in upcycling technologies, stronger consumer trust in circular economy models, and integration of functional health benefits into ingredient positioning. By 2035, demand for high-value formulations and transparency-driven labeling is projected to elevate market appeal, positioning upcycled pet ingredients as a mainstream growth pillar within the global pet nutrition industry.

From 2020 to 2024, the upcycled pet ingredients market expanded from a niche sustainability-driven concept into a structured commercial category, supported by increasing adoption of circular economy practices. During this period, global leaders such as Darling Ingredients and SARIA Group consolidated share through acquisitions, broad rendering networks, and sustainability certifications. Competitive positioning was determined by raw material access, processing innovation, and integration into global pet food supply chains.

By 2025, demand is expected to reach USD 240 million, with revenue distribution led by dry pet food and treats. The decade ahead will witness a structural shift toward premiumization, functional additives, and supplements, with faster growth in Asia-Pacific and Europe. Competitive differentiation is projected to move from scale and feedstock control toward traceability, ESG compliance, and innovation in functional formulations, enabling recurring partnerships with leading pet food manufacturers.

Why the Upcycled Pet Ingredients is growing?

Growth in the upcycled pet ingredients market is being propelled by rising awareness of sustainability and the circular economy in pet nutrition. Increasing emphasis on waste valorization within food supply chains is being translated into viable ingredient opportunities, positioning by-products as value-added resources rather than liabilities. Consumer demand for transparency and eco-conscious purchasing is being reflected in the acceptance of upcycled inputs across premium pet food segments. Regulatory encouragement of sustainable sourcing practices is also being anticipated to reinforce adoption over the coming decade.

Innovation in processing technologies is being recognized as a catalyst for enhancing safety, palatability, and nutrient retention, allowing broader integration into diverse pet food formats. Partnerships between food processors and pet nutrition manufacturers are being leveraged to secure consistent supply streams, ensuring scalability. With sustainability commitments becoming non-negotiable, the adoption of upcycled ingredients is being forecasted to accelerate as a strategic response to industry and consumer expectations.

Segmental Analysis

The upcycled pet ingredients market has been segmented across multiple strategic dimensions to reflect evolving consumer preferences and sustainability drivers. Key segmentation has been performed by ingredient source, ingredient type, product form, and end-use application. Ingredient sources include fruits and vegetables, brewery residues, oilseed cakes, meat and poultry by-products, dairy-by products, and other food processing residues, each offering distinct nutritional and functional benefits. Ingredient types are classified into proteins, fibers, fats, starches carbohydrates, mineral & micronutrients, and functional blends to highlight diverse formulation roles. Product forms are differentiated as dry, liquid, and semi-moist, depending on stability and application suitability. End-use applications encompass kibble, wet food, treats, and supplements, ensuring comprehensive coverage of growth opportunities across the global pet nutrition industry.
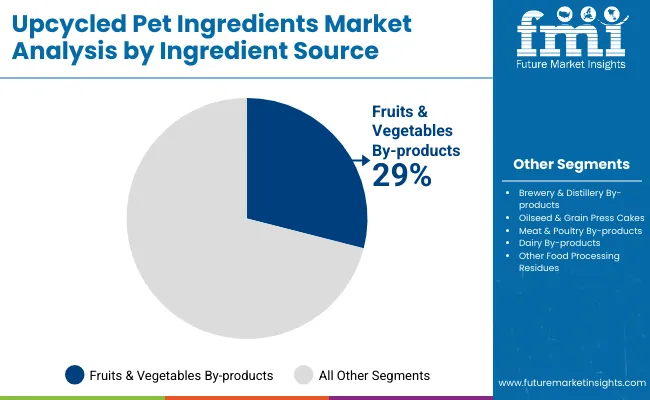
Insights into the Ingredient Source Segment with Fruits & Vegetables By-products Leading in Market Share

Upcycled Pet Ingredients Market By Ingredients Source

Ingredient Source Segment Market Value Share, 2025
Fruits & Vegetables By-products (pomace, peels, pulps) 29%
Brewery & Distillery By-products (spent grains, yeast) 24%

The ingredient source landscape is projected to be dominated by fruits and vegetable by-products, which account for 29% of the 2025 market value. Their prevalence is being reinforced by abundant availability, nutritional richness, and consumer alignment with plant-forward pet food formulations. Brewery and distillery by-products follow closely, benefitting from consistent supply streams and protein density. Growth within oilseed cakes, dairy, and meat by-products is anticipated to accelerate as sustainability frameworks integrate circular economy models more firmly into pet nutrition. Over the next decade, ingredient diversification is expected to deepen as functional blends from multiple sources are innovated. The emphasis on valorizing underutilized streams is projected to expand the scope of both plant- and animal-based upcycled inputs.
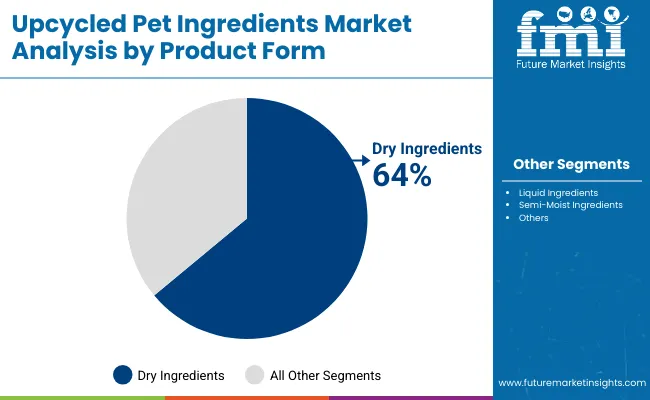
Insights into the Product Form Segment with Dry Ingredients Dominating the Demand

Upcycled Pet Ingredients Market By Product Form

Product Form 2025 Share%
Dry Ingredients 64%
Liquid Ingredients 22%
Semi-Moist Ingredients 15%

The product form outlook reveals a clear dominance of dry ingredients, which account for 64% of the 2025 market value. Their stronghold is being attributed to cost-efficiency, ease of storage, and flexibility across kibble and treat formulations. Liquid ingredients are projected to register faster growth, supported by their integration into functional blends, oils, and hydrolysates that enhance palatability and nutritional absorption. Semi-moist formats are anticipated to rise as consumer interest in fresh and minimally processed offerings strengthens. The decade is expected to witness increased innovation in hybrid formats that combine stability of dry forms with functional benefits of liquids and semi-moist options. This progression is projected to support diversification across pet food and supplement categories globally.
Insights into the End-Use Application Segment with Focus on Kibble & Dry Pet Food

Upcycled Pet Ingredients Market By End Use Application

End-Use Application 2025 Share%
Kibble & Dry Pet Food 47%
Wet & Canned Pet Food 23%
Pet Treats & Snacks 19%

The end-use application outlook indicates that kibble and dry pet food will dominate with 47% of 2025 market revenues. Adoption in this segment is being supported by high-volume consumption patterns and the suitability of dry formulations for integrating protein-rich meals, fibers, and oils. Wet and canned formats are anticipated to expand steadily, leveraging their compatibility with semi-moist and liquid by-products. Pet treats and snacks are forecasted to provide agile growth avenues, driven by rising demand for natural, sustainable indulgence options. Supplements and functional additives are projected to achieve above-average growth rates, supported by consumer preferences for targeted health benefits. Over the decade, the expansion of upcycled inputs into supplements is expected to reshape premium positioning across the category.

What are the Drivers, Restraints, and Key Trends of the Upcycled Pet Ingredients?

Rising concerns around waste reduction and sustainable sourcing are reshaping ingredient strategies, even as supply variability and cost barriers challenge broader integration of upcycled inputs into pet food and supplements.

Growing Alignment with Circular Economy and Sustainability Goals

Market growth is being reinforced by the increasing alignment of pet food production with global sustainability commitments and circular economy models. Food and beverage by-products that previously represented disposal costs are now being revalorized into high-quality inputs for pet nutrition. This dynamic is being strengthened by policy incentives, consumer demand for eco-conscious choices, and corporate ESG frameworks that prioritize waste minimization. As transparency becomes a defining factor in brand trust, upcycled pet ingredients are expected to gain further acceptance as a visible proof point of sustainability action. Over the forecast period, the ability to communicate carbon reduction and resource efficiency through ingredient selection is projected to act as a catalyst for mainstream adoption across diverse product categories.

Supply Chain Variability and Standardization Challenges

Despite positive momentum, growth potential is being constrained by the variability of supply chains for upcycled ingredients. Availability and consistency are being influenced by agricultural cycles, brewery output, or meat processing volumes, resulting in fluctuating ingredient quality and reliability. Manufacturers face challenges in achieving standardized nutrient profiles, which complicates product formulation and regulatory compliance. The absence of harmonized guidelines for upcycled certification in some markets is further delaying adoption, as consumer and industry stakeholders demand assurance of safety and authenticity. Without predictable supply chains and robust quality assurance mechanisms, scalability of the category may be hindered. Addressing these limitations through strategic partnerships, traceability systems, and technology-led processing innovation is being recognized as essential for unlocking the full market potential.
Analysis of Upcycled Pet Ingredients by Key Countries

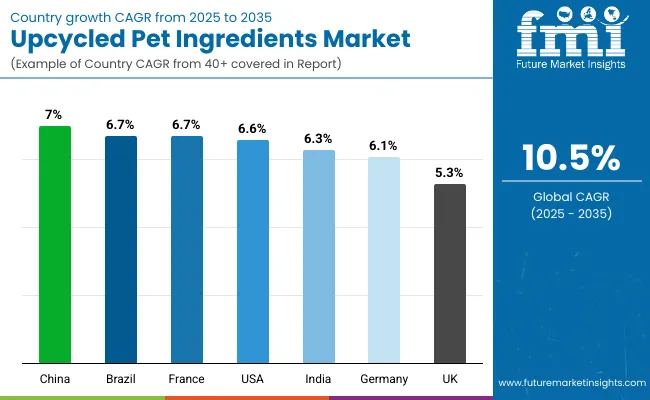
Country Wise Upcycled Pet Ingredients Market

Country CAGR (2025 to 2035)
China 7.0%
India 6.3%
Germany 6.1%
France 6.7%
UK 5.3%
USA 6.6%
Brazil 6.9%

The global upcycled pet ingredients market is expected to reflect significant country-level variations in adoption, shaped by regulatory landscapes, consumer behavior, and resource availability. In Asia, China is projected to expand at a 7.1% CAGR, supported by abundant access to agricultural and food processing by-products, along with strong government backing for circular economy initiatives. India’s growth, forecasted at 5.3%, is being reinforced by a rising organized pet food industry and gradual integration of sustainability-driven product positioning.

In Europe, Germany (6.1%), France (6.7%), and the UK (5.3%) are expected to remain central growth hubs, influenced by strict sustainability frameworks, pet humanization trends, and the presence of leading manufacturers with established supply partnerships. Regulatory pressure for food waste reduction is being translated into consistent investment in upcycled ingredient utilization across pet nutrition categories.

North America, led by the United States at 6.6%, is anticipated to demonstrate steady expansion, driven by consumer demand for premium and eco-conscious products and strong participation from established rendering companies. Brazil, with a 6.9% CAGR, is projected to emerge as a Latin American growth leader, benefiting from robust livestock and oilseed processing sectors that ensure consistent feedstock availability.
Sales Outlook for Upcycled Pet Ingredients in the United States

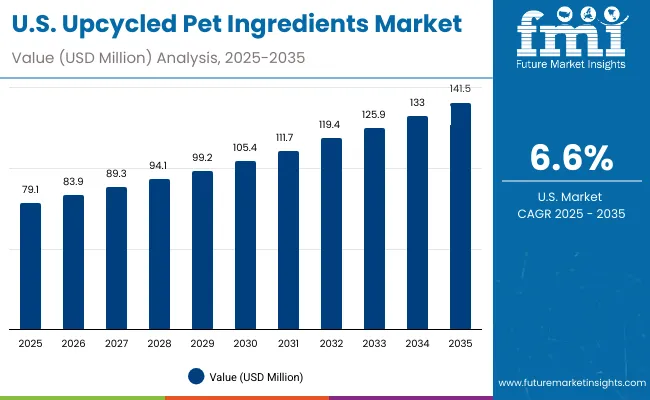
Usa Upcycled Pet Ingredients Market

Year USA Upcycled Pet Ingredients Market (USD Million)
2025 79.1
2026 83.8
2027 89.3
2028 94.7
2029 101.2
2030 107.3
2031 114.7
2032 122.4
2033 128.7
2034 136.7
2035 144.9

The upcycled pet ingredients market in the United States is projected to grow from USD 79.1 million in 2025 to USD 144.9 million by 2035, reflecting steady expansion at a CAGR of 6.6%. Growth is being reinforced by strong consumer awareness of sustainability, rising adoption of premium pet food, and the presence of established rendering and recycling infrastructure. Mainstream pet food brands are increasingly incorporating upcycled proteins, fibers, and oils to align with consumer demand for eco-conscious formulations.

Opportunities are expected to arise from functional positioning of upcycled ingredients, particularly in digestive health, joint support, and weight management. Partnerships between food processors and pet food manufacturers are being leveraged to secure consistent raw material streams. Regulatory support for food waste reduction is also anticipated to strengthen market penetration.

  • Sustainability-driven consumer behavior is shaping ingredient sourcing strategies in pet food.
  • Partnerships between processors and pet nutrition brands are enhancing supply consistency.

Growth and Expansion Outlook for Upcycled Pet Ingredients in the United Kingdom

The upcycled pet ingredients market in the UK is projected to expand steadily at a CAGR of 5.3% through 2035. Growth is being influenced by heightened consumer demand for eco-conscious products, alongside government targets for food waste reduction. Premium pet food manufacturers are integrating proteins and fibers from brewery by-products and vegetable residues, aligning with rising sustainability narratives. Established retail chains are increasingly featuring eco-labeled pet food brands, enhancing visibility and consumer acceptance. Despite slower growth compared to continental Europe, the UK’s innovation-driven food sector is expected to sustain long-term adoption.

  • Retail-led demand for eco-conscious pet food is reinforcing growth.
  • Brewery and distillery by-products are being widely utilized.
  • Sustainability commitments are aligning with consumer purchasing behavior.
  • Premiumization is shaping brand positioning strategies.

Growth and Expansion Outlook for Upcycled Pet Ingredients in India

The upcycled pet ingredients market in India is forecasted to expand at a CAGR of 6.3% between 2025 and 2035. Growth is being driven by rapid urbanization, rising pet adoption, and the expansion of organized retail channels. Abundant availability of oilseed press cakes and fruit residues is supporting cost-effective ingredient sourcing. However, variability in raw material consistency and limited consumer awareness of upcycled claims remain challenges. Increasing entry of multinational pet food brands and government interest in waste valorization are expected to create favorable conditions for market penetration. By the end of the forecast period, premium pet nutrition incorporating upcycled blends is projected to gain stronger traction in metropolitan centers.

  • Raw material abundance supports low-cost ingredient streams.
  • Urban pet ownership is reinforcing product demand.
  • Organized retail expansion enables broader distribution.
  • Consumer education remains key to scaling adoption.

Sales Outlook for Upcycled Pet Ingredients in China

The upcycled pet ingredients market in China is projected to grow at a CAGR of 7.1%, marking the fastest expansion among major economies. This growth is being supported by large-scale agricultural and food processing industries that provide abundant by-product streams. Consumer adoption of sustainable pet food is being reinforced by government emphasis on circular economy models. Urban pet owners are showing strong willingness to adopt eco-conscious formulations, particularly in premium pet nutrition segments. Domestic manufacturers are actively investing in traceability and processing innovation to ensure global competitiveness. China’s position as both a major consumer and exporter of pet food products is expected to further strengthen market expansion.

  • Strong government backing for circular economy initiatives.
  • Large-scale by-product availability ensures feedstock security.
  • Urban consumers increasingly prefer eco-conscious pet food.
  • Domestic producers are investing in global-standard innovation.

China’s dual emphasis on food safety and health positioning is expected to support widespread biotic flavor adoption across F&B, pharma, and nutraceutical sectors.
In-depth Analysis of Upcycled Pet Ingredients in Germany

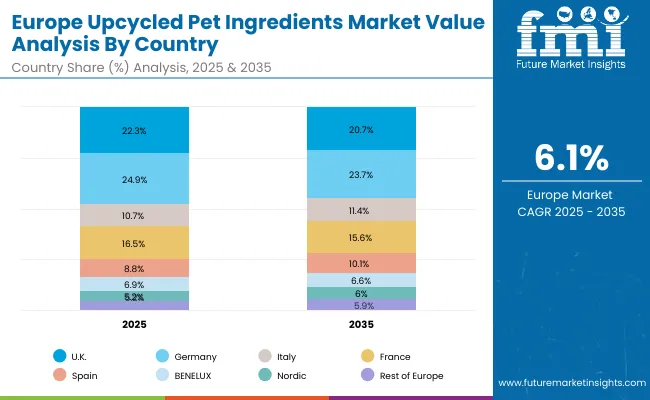
Europe Upcycled Pet Ingredients Market

Country 2025
UK 22.3%
Germany 24.9%
Italy 10.7%
France 16.5%
Spain 8.8%
BENELUX 6.9%
Nordic 5.2%
Rest of Europe 4.7%
Country 2035
UK 20.7%
Germany 23.7%
Italy 11.4%
France 15.6%
Spain 10.1%
BENELUX 6.6%
Nordic 6.0%
Rest of Europe 5.9%

Germany’s upcycled pet ingredients market is anticipated to expand at a CAGR of 6.1% through 2035, maintaining its position as a European leader. Growth is being underpinned by stringent regulations on food waste reduction and the high penetration of sustainability-driven consumer preferences. Meat and poultry by-products, as well as dairy residues, are being increasingly valorized into protein-rich inputs for premium pet food. Established partnerships between food processors and pet nutrition companies are ensuring supply chain stability. Germany’s advanced R&D ecosystem is fostering innovation in processing technologies, supporting the creation of functional blends. By the end of the forecast horizon, the German market is expected to remain a benchmark for sustainable pet food practices in Europe.
  • Strict regulatory frameworks are driving adoption.
  • High consumer preference for sustainability-based products.
  • Meat and dairy by-products are widely utilized.
  • Innovation pipelines reinforce long-term growth prospects

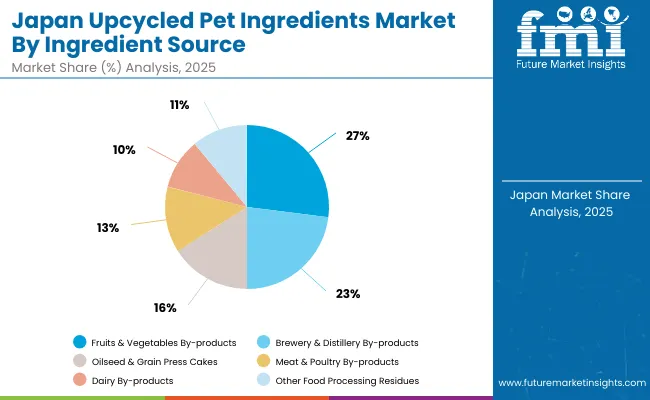
Growth Outlook for Upcycled Pet Ingredients in Japan

Japan Upcycled Pet Ingredients Market

Ingredient Source 2025 Share%
Fruits & Vegetables By-products (pomace, peels, pulps) 29%
Brewery & Distillery By-products (spent grains, yeast) 24%
Oilseed & Grain Press Cakes (soybean meal, sunflower cake) 17%
Meat & Poultry By-products (rendered meals, organs, fats) 14%
Dairy By-products (whey, casein, lactose) 9%
Other Food Processing Residues (eggshells, root vegetable starches) 7%

The upcycled pet ingredients market in Japan is projected at USD 9.83 million in 2025, with fruits and vegetable by-products contributing 29% and brewery residues accounting for 24%. This distribution highlights Japan’s reliance on plant-based and fermentation-derived sources, reflecting consumer trust in natural and sustainable formulations. Growth is being accelerated by regulatory emphasis on food waste reduction and strong consumer preference for transparency in sourcing.

A shift toward diversified sources such as dairy residues (9%) and other food processing by-products (7%) is being observed, signaling expanding acceptance of novel inputs. Functional blends leveraging oilseed cakes and meat-derived proteins are expected to gain traction, especially in premium pet nutrition lines. Over the forecast horizon, adoption is anticipated to be supported by Japan’s advanced processing technologies, which ensure nutrient consistency and safety. Integration of traceability platforms and AI-enabled quality monitoring is likely to strengthen consumer confidence, positioning Japan as a high-value market in Asia.
  • Fruits & vegetable by-products lead at 27%, followed by brewery residues at 23%.
  • Growth supported by regulatory pressure on food waste reduction.
  • Advanced processing technologies ensure safety and consistency

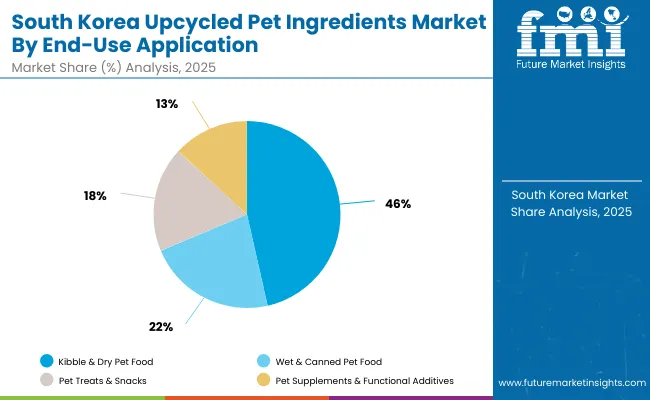
Opportunity Analysis of South Korea Upcycled Pet Ingredients

South Korea Upcycled Pet Ingredients Market

End-Use Application Market Value Share, 2025
Kibble & Dry Pet Food 46%
Wet & Canned Pet Food 22%
Pet Treats & Snacks 18%
Pet Supplements & Functional Additives 13%

The upcycled pet ingredients market in South Korea is projected at USD 5.62 million in 2025, with kibble and dry pet food contributing 46% of demand. This dominance is being supported by strong consumer reliance on packaged dry formats, which provide convenience and affordability. Wet and canned pet food, representing 22%, is expected to expand steadily, benefiting from rising demand for premiumization and freshness in urban households.

Pet treats and snacks, holding an 18% share, are forecasted to achieve faster growth, reinforced by consumer interest in natural and functional indulgence options. Supplements and functional additives, at 13%, are anticipated to record the highest CAGR at 9.9%, reflecting South Korea’s advanced pet healthcare culture and demand for tailored nutrition. Over the decade, integration of upcycled proteins, fibers, and oils into functional applications is expected to position South Korea as a high-value innovation hub within Asia.
  • Dry pet food leads at 46%, sustained by consumer convenience preferences.
  • Wet formats grow with urban demand for premium freshness.
  • Snacks gain traction as functional indulgence offerings.
  • Supplements achieve highest growth, driven by pet healthcare trends.

Competitive Landscape of Upcycled Pet Ingredients

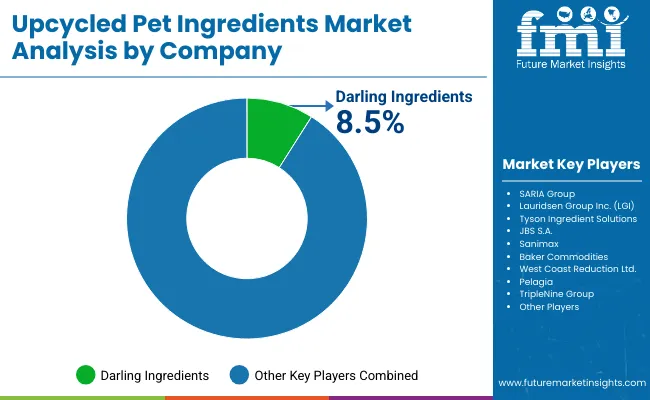
Upcycled Pet Ingredients Market By Company

Company Global Value Share 2025
Darling Ingredients 8. 5%
Others 91 .5%

The upcycled pet ingredients market is moderately fragmented, with global leaders, mid-sized innovators, and niche-focused specialists competing across sourcing, processing, and distribution channels. Global rendering and by-product leaders such as Darling Ingredients (US), SARIA Group (Germany), and Lauridsen Group Inc. (US) hold significant market share, driven by expansive collection networks, established processing expertise, and integration with global pet food manufacturers. Their strategies are being directed toward sustainability certifications, traceability systems, and expansion into functional blends.

Established players such as Tyson Foods – Tyson Ingredient Solutions (US), JBS S.A. (Brazil), and Sanimax (Canada/US) are catering to the rising demand for protein meals, oils, and organ-based inputs. These companies are being positioned as critical suppliers to both multinational and regional pet food processors, leveraging scale advantages and vertical integration within meat and poultry industries.

Specialized providers, including Baker Commodities (US), West Coast Reduction Ltd. (Canada), Pelagia (Norway), and TripleNine Group, are focusing on marine, dairy, and niche by-products to meet functional requirements. Their strength lies in customization and alignment with regional regulatory frameworks rather than global scale.

Competitive differentiation is shifting from basic supply capabilities toward innovation in upcycling technologies, functional positioning, and partnerships with pet food brands. Greater emphasis on transparency, ESG alignment, and premium-grade formulations is expected to shape competitive advantage over the coming decade.

Key Developments in Upcycled Pet Ingredients

  • In August, 2025, SARIA SE & Co. KG was again awarded the EcoVadis Gold medal, placing it among the top 5% of globally assessed companies. This was recognized as validation of its continuous leadership in sustainability performance, and is anticipated to support stronger stakeholder confidence and growth in upcycled ingredient demand.
  • In July 2025, Darling Ingredients announced that its global sustainability progress report had confirmed a 45% drop in its Lost Time Incident Rate (LTIR) year-on-year. This improvement was enabled by strengthened safety systems and workforce training, and it is expected to enhance operational reliability and brand trust.

Scope of the Report

Item Value
Quantitative Units USD 240.0 million
Ingredient Source Fruits & vegetables by-products, Brewery & distillery by-products, Oilseed & grain press cakes, Meat & poultry by-products, Dairy by-products, Other food processing residues
Ingredient Type P roteins & meals, Fibers, Fats & oils, Starches & carbohydrates, Minerals & micronutrients, Functional blends
End-Use Application Kibble & D ry Pet Food, Wet & Canned Pet Food, Pet Treats & Snacks, Pet Supplements & Functional Additives
Product Form Dry Ingredient s (meals, powders, dried pulps), Liquid Ingredien ts (oils, hydrolysates, syrups), and Semi-Moist Ingredients (fresh pulps, slurries)
Regions Covered North America, Europe, Asia-Pacific, Latin America, Middle East & Africa
Country Covered United States, Canada, Germany, France, United Kingdom, China, Japan, India, Brazil, South Africa
Key Companies Profiled Darling Ingredients, SARIA Group, Lauridsen Group Inc. (LGI), Tyson Ingredient Solutions, JBS S.A., Sanimax, Baker Commodities, West Coast Reduction Ltd., Pelagia, TripleNine Group
Additional Attributes Dollar sales by ingredient source and end-use application; adoption trends in premium and functional pet food; rising demand for eco-conscious and sustainable formulations; sector-specific growth in treats, supplements, and wet food; integration with ESG and waste valorization frameworks; regional adoption influenced by sustainability policies; innovations in upcycling technologies and traceability systems.

Key Segments

By Ingredient Source:

  • Fruits & Vegetables By-products
    • Pomace
    • Peels
    • Pulps
  • Brewery & Distillery By-products
    • Spent Grains
    • Yeast
  • Oilseed & Grain Press Cakes
  • Meat & Poultry By-products
  • Other Food Processing Residues

By Ingredient Type:

  • Proteins & Meals
  • Fibers
  • Fats & Oils
  • Starches & Carbohydrates
  • Minerals & Micronutrients
  • Functional Blends

By Product Form:

  • Powders
  • Liquid
  • Semi-Moist Ingredients

By End-Use Application:

  • Kibble & Dry Pet Food
  • Wet & Canned Pet Food
  • Pet Treats & Snacks
  • Pet Supplements & Functional Additives

By Region:

  • North America
  • Latin America
  • Europe
  • East Asia
  • South Asia & Pacific
  • MEA

Table of Content

  1. Executive Summary
    • Global Market Outlook
    • Demand-side Trends
    • Supply-side Trends
    • Technology Roadmap Analysis
    • Analysis and Recommendations
  2. Market Overview
    • Market Coverage / Taxonomy
    • Market Definition / Scope / Limitations
  3. Market Background
    • Market Dynamics
      • Drivers
      • Restraints
      • Opportunity
      • Trends
    • Scenario Forecast
      • Demand in Optimistic Scenario
      • Demand in Likely Scenario
      • Demand in Conservative Scenario
    • Opportunity Map Analysis
    • Product Life Cycle Analysis
    • Supply Chain Analysis
    • Investment Feasibility Matrix
    • Value Chain Analysis
    • PESTLE and Porter’s Analysis
    • Regulatory Landscape
    • Regional Parent Market Outlook
    • Production and Consumption Statistics
    • Import and Export Statistics
  4. Global Market Analysis 2020 to 2024 and Forecast, 2025 to 2035
    • Historical Market Size Value (USD Million) & Volume (MT) Analysis, 2020 to 2024
    • Current and Future Market Size Value (USD Million) & Volume (MT) Projections, 2025 to 2035
      • Y-o-Y Growth Trend Analysis
      • Absolute $ Opportunity Analysis
  5. Global Market Pricing Analysis 2020 to 2024 and Forecast 2025 to 2035
  6. Global Market Analysis 2020 to 2024 and Forecast 2025 to 2035, By Ingredient Source
    • Introduction / Key Findings
    • Historical Market Size Value (USD Million) & Volume (MT) Analysis By Ingredient Source, 2020 to 2024
    • Current and Future Market Size Value (USD Million) & Volume (MT) Analysis and Forecast By Ingredient Source, 2025 to 2035
      • Fruits & Vegetables By-products
        • Pomace
        • Peels
        • Pulps
      • Brewery & Distillery By-products
        • Spent Grains
        • Yeast
      • Oilseed & Grain Press Cakes
      • Meat & Poultry By-products
      • Other Food Processing Residues
    • Y-o-Y Growth Trend Analysis By Ingredient Source, 2020 to 2024
    • Absolute $ Opportunity Analysis By Ingredient Source, 2025 to 2035
  7. Global Market Analysis 2020 to 2024 and Forecast 2025 to 2035, By Ingredient Type
    • Introduction / Key Findings
    • Historical Market Size Value (USD Million) & Volume (MT) Analysis By Ingredient Type, 2020 to 2024
    • Current and Future Market Size Value (USD Million) & Volume (MT) Analysis and Forecast By Ingredient Type, 2025 to 2035
      • Proteins & Meals
      • Fibers
      • Fats & Oils
      • Starches & Carbohydrates
      • Minerals & Micronutrients
      • Functional Blends
    • Y-o-Y Growth Trend Analysis By Ingredient Type, 2020 to 2024
    • Absolute $ Opportunity Analysis By Ingredient Type, 2025 to 2035
  8. Global Market Analysis 2020 to 2024 and Forecast 2025 to 2035, By Product Form
    • Introduction / Key Findings
    • Historical Market Size Value (USD Million) & Volume (MT) Analysis By Product Form, 2020 to 2024
    • Current and Future Market Size Value (USD Million) & Volume (MT) Analysis and Forecast By Product Form, 2025 to 2035
      • Powders
      • Liquid
      • Semi-Moist Ingredients
    • Y-o-Y Growth Trend Analysis By Product Form, 2020 to 2024
    • Absolute $ Opportunity Analysis By Product Form, 2025 to 2035
  9. Global Market Analysis 2020 to 2024 and Forecast 2025 to 2035, By End-Use Application
    • Introduction / Key Findings
    • Historical Market Size Value (USD Million) & Volume (MT) Analysis By End-Use Application, 2020 to 2024
    • Current and Future Market Size Value (USD Million) & Volume (MT) Analysis and Forecast By End-Use Application, 2025 to 2035
      • Kibble & Dry Pet Food
      • Wet & Canned Pet Food
      • Pet Treats & Snacks
      • Pet Supplements & Functional Additives
    • Y-o-Y Growth Trend Analysis By End-Use Application, 2020 to 2024
    • Absolute $ Opportunity Analysis By End-Use Application, 2025 to 2035
  10. Global Market Analysis 2020 to 2024 and Forecast 2025 to 2035, By Region
    • Introduction
    • Historical Market Size Value (USD Million) & Volume (MT) Analysis By Region, 2020 to 2024
    • Current Market Size Value (USD Million) & Volume (MT) Analysis and Forecast By Region, 2025 to 2035
      • North America
      • Latin America
      • Europe
      • East Asia
      • South Asia & Pacific
      • MEA
    • Market Attractiveness Analysis By Region
  11. North America Market Analysis 2020 to 2024 and Forecast 2025 to 2035, By Country
    • Historical Market Size Value (USD Million) & Volume (MT) Trend Analysis By Market Taxonomy, 2020 to 2024
    • Market Size Value (USD Million) & Volume (MT) Forecast By Market Taxonomy, 2025 to 2035
      • By Country
        • USA
        • Canada
      • By Ingredient Source
      • By Ingredient Type
      • By Product Form
      • By End-Use Application
    • Market Attractiveness Analysis
      • By Country
      • By Ingredient Source
      • By Ingredient Type
      • By Product Form
      • By End-Use Application
    • Key Takeaways
  12. Latin America Market Analysis 2020 to 2024 and Forecast 2025 to 2035, By Country
    • Historical Market Size Value (USD Million) & Volume (MT) Trend Analysis By Market Taxonomy, 2020 to 2024
    • Market Size Value (USD Million) & Volume (MT) Forecast By Market Taxonomy, 2025 to 2035
      • By Country
        • Brazil
        • Mexico
        • Colombia
        • Rest of Latin America
      • By Ingredient Source
      • By Ingredient Type
      • By Product Form
      • By End-Use Application
    • Market Attractiveness Analysis
      • By Country
      • By Ingredient Source
      • By Ingredient Type
      • By Product Form
      • By End-Use Application
    • Key Takeaways
  13. Europe Market Analysis 2020 to 2024 and Forecast 2025 to 2035, By Country
    • Historical Market Size Value (USD Million) & Volume (MT) Trend Analysis By Market Taxonomy, 2020 to 2024
    • Market Size Value (USD Million) & Volume (MT) Forecast By Market Taxonomy, 2025 to 2035
      • By Country
        • Germany
        • UK
        • France
        • Italy
        • Spain
        • Belgium
        • Netherlands
        • Nordic
        • Switzerland
        • Russia
        • Poland
        • Rest of Europe
      • By Ingredient Source
      • By Ingredient Type
      • By Product Form
      • By End-Use Application
    • Market Attractiveness Analysis
      • By Country
      • By Ingredient Source
      • By Ingredient Type
      • By Product Form
      • By End-Use Application
    • Key Takeaways
  14. East Asia Market Analysis 2020 to 2024 and Forecast 2025 to 2035, By Country
    • Historical Market Size Value (USD Million) & Volume (MT) Trend Analysis By Market Taxonomy, 2020 to 2024
    • Market Size Value (USD Million) & Volume (MT) Forecast By Market Taxonomy, 2025 to 2035
      • By Country
        • China
        • Japan
        • South Korea
      • By Ingredient Source
      • By Ingredient Type
      • By Product Form
      • By End-Use Application
    • Market Attractiveness Analysis
      • By Country
      • By Ingredient Source
      • By Ingredient Type
      • By Product Form
      • By End-Use Application
    • Key Takeaways
  15. South Asia & Pacific Market Analysis 2020 to 2024 and Forecast 2025 to 2035, By Country
    • Historical Market Size Value (USD Million) & Volume (MT) Trend Analysis By Market Taxonomy, 2020 to 2024
    • Market Size Value (USD Million) & Volume (MT) Forecast By Market Taxonomy, 2025 to 2035
      • By Country
        • India
        • Thailand
        • Malaysia
        • Indonesia
        • Singapore
        • Vietnam
        • Australia
        • New Zealand
        • Rest of South Asia & Pacific
      • By Ingredient Source
      • By Ingredient Type
      • By Product Form
      • By End-Use Application
    • Market Attractiveness Analysis
      • By Country
      • By Ingredient Source
      • By Ingredient Type
      • By Product Form
      • By End-Use Application
    • Key Takeaways
  16. MEA Market Analysis 2020 to 2024 and Forecast 2025 to 2035, By Country
    • Historical Market Size Value (USD Million) & Volume (MT) Trend Analysis By Market Taxonomy, 2020 to 2024
    • Market Size Value (USD Million) & Volume (MT) Forecast By Market Taxonomy, 2025 to 2035
      • By Country
        • Turkey
        • UAE
        • Saudi Arabia
        • Israel
        • Other GCC Countries
        • North Africa
        • South Africa
        • Central Africa
      • By Ingredient Source
      • By Ingredient Type
      • By Product Form
      • By End-Use Application
    • Market Attractiveness Analysis
      • By Country
      • By Ingredient Source
      • By Ingredient Type
      • By Product Form
      • By End-Use Application
    • Key Takeaways
  17. Key Countries Market Analysis
    • USA
      • Pricing Analysis
      • Market Share Analysis, 2024
        • By Ingredient Source
        • By Ingredient Type
        • By Product Form
        • By End-Use Application
    • Canada
      • Pricing Analysis
      • Market Share Analysis, 2024
        • By Ingredient Source
        • By Ingredient Type
        • By Product Form
        • By End-Use Application
    • Brazil
      • Pricing Analysis
      • Market Share Analysis, 2024
        • By Ingredient Source
        • By Ingredient Type
        • By Product Form
        • By End-Use Application
    • Mexico
      • Pricing Analysis
      • Market Share Analysis, 2024
        • By Ingredient Source
        • By Ingredient Type
        • By Product Form
        • By End-Use Application
    • Colombia
      • Pricing Analysis
      • Market Share Analysis, 2024
        • By Ingredient Source
        • By Ingredient Type
        • By Product Form
        • By End-Use Application
    • Germany
      • Pricing Analysis
      • Market Share Analysis, 2024
        • By Ingredient Source
        • By Ingredient Type
        • By Product Form
        • By End-Use Application
    • UK
      • Pricing Analysis
      • Market Share Analysis, 2024
        • By Ingredient Source
        • By Ingredient Type
        • By Product Form
        • By End-Use Application
    • France
      • Pricing Analysis
      • Market Share Analysis, 2024
        • By Ingredient Source
        • By Ingredient Type
        • By Product Form
        • By End-Use Application
    • Italy
      • Pricing Analysis
      • Market Share Analysis, 2024
        • By Ingredient Source
        • By Ingredient Type
        • By Product Form
        • By End-Use Application
    • Spain
      • Pricing Analysis
      • Market Share Analysis, 2024
        • By Ingredient Source
        • By Ingredient Type
        • By Product Form
        • By End-Use Application
    • Belgium
      • Pricing Analysis
      • Market Share Analysis, 2024
        • By Ingredient Source
        • By Ingredient Type
        • By Product Form
        • By End-Use Application
    • Netherlands
      • Pricing Analysis
      • Market Share Analysis, 2024
        • By Ingredient Source
        • By Ingredient Type
        • By Product Form
        • By End-Use Application
    • Nordic
      • Pricing Analysis
      • Market Share Analysis, 2024
        • By Ingredient Source
        • By Ingredient Type
        • By Product Form
        • By End-Use Application
    • Switzerland
      • Pricing Analysis
      • Market Share Analysis, 2024
        • By Ingredient Source
        • By Ingredient Type
        • By Product Form
        • By End-Use Application
    • Russia
      • Pricing Analysis
      • Market Share Analysis, 2024
        • By Ingredient Source
        • By Ingredient Type
        • By Product Form
        • By End-Use Application
    • Poland
      • Pricing Analysis
      • Market Share Analysis, 2024
        • By Ingredient Source
        • By Ingredient Type
        • By Product Form
        • By End-Use Application
    • China
      • Pricing Analysis
      • Market Share Analysis, 2024
        • By Ingredient Source
        • By Ingredient Type
        • By Product Form
        • By End-Use Application
    • Japan
      • Pricing Analysis
      • Market Share Analysis, 2024
        • By Ingredient Source
        • By Ingredient Type
        • By Product Form
        • By End-Use Application
    • South Korea
      • Pricing Analysis
      • Market Share Analysis, 2024
        • By Ingredient Source
        • By Ingredient Type
        • By Product Form
        • By End-Use Application
    • India
      • Pricing Analysis
      • Market Share Analysis, 2024
        • By Ingredient Source
        • By Ingredient Type
        • By Product Form
        • By End-Use Application
    • Thailand
      • Pricing Analysis
      • Market Share Analysis, 2024
        • By Ingredient Source
        • By Ingredient Type
        • By Product Form
        • By End-Use Application
    • Indonesia
      • Pricing Analysis
      • Market Share Analysis, 2024
        • By Ingredient Source
        • By Ingredient Type
        • By Product Form
        • By End-Use Application
    • Australia
      • Pricing Analysis
      • Market Share Analysis, 2024
        • By Ingredient Source
        • By Ingredient Type
        • By Product Form
        • By End-Use Application
    • New Zealand
      • Pricing Analysis
      • Market Share Analysis, 2024
        • By Ingredient Source
        • By Ingredient Type
        • By Product Form
        • By End-Use Application
    • Turkey
      • Pricing Analysis
      • Market Share Analysis, 2024
        • By Ingredient Source
        • By Ingredient Type
        • By Product Form
        • By End-Use Application
    • UAE
      • Pricing Analysis
      • Market Share Analysis, 2024
        • By Ingredient Source
        • By Ingredient Type
        • By Product Form
        • By End-Use Application
    • Saudi Arabia
      • Pricing Analysis
      • Market Share Analysis, 2024
        • By Ingredient Source
        • By Ingredient Type
        • By Product Form
        • By End-Use Application
    • Israel
      • Pricing Analysis
      • Market Share Analysis, 2024
        • By Ingredient Source
        • By Ingredient Type
        • By Product Form
        • By End-Use Application
    • North Africa
      • Pricing Analysis
      • Market Share Analysis, 2024
        • By Ingredient Source
        • By Ingredient Type
        • By Product Form
        • By End-Use Application
    • South Africa
      • Pricing Analysis
      • Market Share Analysis, 2024
        • By Ingredient Source
        • By Ingredient Type
        • By Product Form
        • By End-Use Application
  18. Market Structure Analysis
    • Competition Dashboard
    • Competition Benchmarking
    • Market Share Analysis of Top Players
      • By Regional
      • By Ingredient Source
      • By Ingredient Type
      • By Product Form
      • By End-Use Application
  19. Competition Analysis
    • Competition Deep Dive
      • Darling Ingredients
        • Overview
        • Product Portfolio
        • Profitability by Market Segments (Source/Form /End-Use Application/Region)
        • Sales Footprint
        • Strategy Overview
        • SARIA Group
        • Lauridsen Group, Inc.
        • Tyson Foods
        • JBS S.A.
        • Sanimax
        • Baker Commodities
        • West Coast Reduction Ltd.
        • Pelagia
        • TripleNine Group
        • Others
    • Assumptions & Acronyms Used
    • Research Methodology

List of Tables

  • Table 1: Global Market Value (USD Million) Forecast by Region, 2020-2035
  • Table 2: Global Market Volume (MT) Forecast by Region, 2020-2035
  • Table 3: Global Market Value (USD Million) Forecast by Ingredient Source, 2020-2035
  • Table 4: Global Market Volume (MT) Forecast by Ingredient Source, 2020-2035
  • Table 5: Global Market Value (USD Million) Forecast by Ingredient Type, 2020-2035
  • Table 6: Global Market Volume (MT) Forecast by Ingredient Type, 2020-2035
  • Table 7: Global Market Value (USD Million) Forecast by Product Form, 2020-2035
  • Table 8: Global Market Volume (MT) Forecast by Product Form, 2020-2035
  • Table 9: Global Market Value (USD Million) Forecast by End-Use Application, 2020-2035
  • Table 10: Global Market Volume (MT) Forecast by End-Use Application, 2020-2035
  • Table 11: North America Market Value (USD Million) Forecast by Country, 2020-2035
  • Table 12: North America Market Volume (MT) Forecast by Country, 2020-2035
  • Table 13: North America Market Value (USD Million) Forecast by Ingredient Source, 2020-2035
  • Table 14: North America Market Volume (MT) Forecast by Ingredient Source, 2020-2035
  • Table 15: North America Market Value (USD Million) Forecast by Ingredient Type, 2020-2035
  • Table 16: North America Market Volume (MT) Forecast by Ingredient Type, 2020-2035
  • Table 17: North America Market Value (USD Million) Forecast by Product Form, 2020-2035
  • Table 18: North America Market Volume (MT) Forecast by Product Form, 2020-2035
  • Table 19: North America Market Value (USD Million) Forecast by End-Use Application, 2020-2035
  • Table 20: North America Market Volume (MT) Forecast by End-Use Application, 2020-2035
  • Table 21: Latin America Market Value (USD Million) Forecast by Country, 2020-2035
  • Table 22: Latin America Market Volume (MT) Forecast by Country, 2020-2035
  • Table 23: Latin America Market Value (USD Million) Forecast by Ingredient Source, 2020-2035
  • Table 24: Latin America Market Volume (MT) Forecast by Ingredient Source, 2020-2035
  • Table 25: Latin America Market Value (USD Million) Forecast by Ingredient Type, 2020-2035
  • Table 26: Latin America Market Volume (MT) Forecast by Ingredient Type, 2020-2035
  • Table 27: Latin America Market Value (USD Million) Forecast by Product Form, 2020-2035
  • Table 28: Latin America Market Volume (MT) Forecast by Product Form, 2020-2035
  • Table 29: Latin America Market Value (USD Million) Forecast by End-Use Application, 2020-2035
  • Table 30: Latin America Market Volume (MT) Forecast by End-Use Application, 2020-2035
  • Table 31: Europe Market Value (USD Million) Forecast by Country, 2020-2035
  • Table 32: Europe Market Volume (MT) Forecast by Country, 2020-2035
  • Table 33: Europe Market Value (USD Million) Forecast by Ingredient Source, 2020-2035
  • Table 34: Europe Market Volume (MT) Forecast by Ingredient Source, 2020-2035
  • Table 35: Europe Market Value (USD Million) Forecast by Ingredient Type, 2020-2035
  • Table 36: Europe Market Volume (MT) Forecast by Ingredient Type, 2020-2035
  • Table 37: Europe Market Value (USD Million) Forecast by Product Form, 2020-2035
  • Table 38: Europe Market Volume (MT) Forecast by Product Form, 2020-2035
  • Table 39: Europe Market Value (USD Million) Forecast by End-Use Application, 2020-2035
  • Table 40: Europe Market Volume (MT) Forecast by End-Use Application, 2020-2035
  • Table 41: East Asia Market Value (USD Million) Forecast by Country, 2020-2035
  • Table 42: East Asia Market Volume (MT) Forecast by Country, 2020-2035
  • Table 43: East Asia Market Value (USD Million) Forecast by Ingredient Source, 2020-2035
  • Table 44: East Asia Market Volume (MT) Forecast by Ingredient Source, 2020-2035
  • Table 45: East Asia Market Value (USD Million) Forecast by Ingredient Type, 2020-2035
  • Table 46: East Asia Market Volume (MT) Forecast by Ingredient Type, 2020-2035
  • Table 47: East Asia Market Value (USD Million) Forecast by Product Form, 2020-2035
  • Table 48: East Asia Market Volume (MT) Forecast by Product Form, 2020-2035
  • Table 49: East Asia Market Value (USD Million) Forecast by End-Use Application, 2020-2035
  • Table 50: East Asia Market Volume (MT) Forecast by End-Use Application, 2020-2035
  • Table 51: South Asia & Pacific Market Value (USD Million) Forecast by Country, 2020-2035
  • Table 52: South Asia & Pacific Market Volume (MT) Forecast by Country, 2020-2035
  • Table 53: South Asia & Pacific Market Value (USD Million) Forecast by Ingredient Source, 2020-2035
  • Table 54: South Asia & Pacific Market Volume (MT) Forecast by Ingredient Source, 2020-2035
  • Table 55: South Asia & Pacific Market Value (USD Million) Forecast by Ingredient Type, 2020-2035
  • Table 56: South Asia & Pacific Market Volume (MT) Forecast by Ingredient Type, 2020-2035
  • Table 57: South Asia & Pacific Market Value (USD Million) Forecast by Product Form, 2020-2035
  • Table 58: South Asia & Pacific Market Volume (MT) Forecast by Product Form, 2020-2035
  • Table 59: South Asia & Pacific Market Value (USD Million) Forecast by End-Use Application, 2020-2035
  • Table 60: South Asia & Pacific Market Volume (MT) Forecast by End-Use Application, 2020-2035
  • Table 61: MEA Market Value (USD Million) Forecast by Country, 2020-2035
  • Table 62: MEA Market Volume (MT) Forecast by Country, 2020-2035
  • Table 63: MEA Market Value (USD Million) Forecast by Ingredient Source, 2020-2035
  • Table 64: MEA Market Volume (MT) Forecast by Ingredient Source, 2020-2035
  • Table 65: MEA Market Value (USD Million) Forecast by Ingredient Type, 2020-2035
  • Table 66: MEA Market Volume (MT) Forecast by Ingredient Type, 2020-2035
  • Table 67: MEA Market Value (USD Million) Forecast by Product Form, 2020-2035
  • Table 68: MEA Market Volume (MT) Forecast by Product Form, 2020-2035
  • Table 69: MEA Market Value (USD Million) Forecast by End-Use Application, 2020-2035
  • Table 70: MEA Market Volume (MT) Forecast by End-Use Application, 2020-2035

List of Figures

  • Figure 1: Global Market Volume (MT) Forecast 2020-2035
  • Figure 2: Global Market Pricing Analysis
  • Figure 3: Global Market Value (USD Million) Forecast 2020-2035
  • Figure 4: Global Market Value Share and BPS Analysis by Ingredient Source, 2025 and 2035
  • Figure 5: Global Market Y-o-Y Growth Comparison by Ingredient Source, 2025-2035
  • Figure 6: Global Market Attractiveness Analysis by Ingredient Source
  • Figure 7: Global Market Value Share and BPS Analysis by Ingredient Type, 2025 and 2035
  • Figure 8: Global Market Y-o-Y Growth Comparison by Ingredient Type, 2025-2035
  • Figure 9: Global Market Attractiveness Analysis by Ingredient Type
  • Figure 10: Global Market Value Share and BPS Analysis by Product Form, 2025 and 2035
  • Figure 11: Global Market Y-o-Y Growth Comparison by Product Form, 2025-2035
  • Figure 12: Global Market Attractiveness Analysis by Product Form
  • Figure 13: Global Market Value Share and BPS Analysis by End-Use Application, 2025 and 2035
  • Figure 14: Global Market Y-o-Y Growth Comparison by End-Use Application, 2025-2035
  • Figure 15: Global Market Attractiveness Analysis by End-Use Application
  • Figure 16: Global Market Value (USD Million) Share and BPS Analysis by Region, 2025 and 2035
  • Figure 17: Global Market Y-o-Y Growth Comparison by Region, 2025-2035
  • Figure 18: Global Market Attractiveness Analysis by Region
  • Figure 19: North America Market Incremental $ Opportunity, 2025-2035
  • Figure 20: Latin America Market Incremental $ Opportunity, 2025-2035
  • Figure 21: Europe Market Incremental $ Opportunity, 2025-2035
  • Figure 22: East Asia Market Incremental $ Opportunity, 2025-2035
  • Figure 23: South Asia & Pacific Market Incremental $ Opportunity, 2025-2035
  • Figure 24: MEA Market Incremental $ Opportunity, 2025-2035
  • Figure 25: North America Market Value Share and BPS Analysis by Country, 2025 and 2035
  • Figure 26: North America Market Value Share and BPS Analysis by Ingredient Source, 2025 and 2035
  • Figure 27: North America Market Y-o-Y Growth Comparison by Ingredient Source, 2025-2035
  • Figure 28: North America Market Attractiveness Analysis by Ingredient Source
  • Figure 29: North America Market Value Share and BPS Analysis by Ingredient Type, 2025 and 2035
  • Figure 30: North America Market Y-o-Y Growth Comparison by Ingredient Type, 2025-2035
  • Figure 31: North America Market Attractiveness Analysis by Ingredient Type
  • Figure 32: North America Market Value Share and BPS Analysis by Product Form, 2025 and 2035
  • Figure 33: North America Market Y-o-Y Growth Comparison by Product Form, 2025-2035
  • Figure 34: North America Market Attractiveness Analysis by Product Form
  • Figure 35: North America Market Value Share and BPS Analysis by End-Use Application, 2025 and 2035
  • Figure 36: North America Market Y-o-Y Growth Comparison by End-Use Application, 2025-2035
  • Figure 37: North America Market Attractiveness Analysis by End-Use Application
  • Figure 38: Latin America Market Value Share and BPS Analysis by Country, 2025 and 2035
  • Figure 39: Latin America Market Value Share and BPS Analysis by Ingredient Source, 2025 and 2035
  • Figure 40: Latin America Market Y-o-Y Growth Comparison by Ingredient Source, 2025-2035
  • Figure 41: Latin America Market Attractiveness Analysis by Ingredient Source
  • Figure 42: Latin America Market Value Share and BPS Analysis by Ingredient Type, 2025 and 2035
  • Figure 43: Latin America Market Y-o-Y Growth Comparison by Ingredient Type, 2025-2035
  • Figure 44: Latin America Market Attractiveness Analysis by Ingredient Type
  • Figure 45: Latin America Market Value Share and BPS Analysis by Product Form, 2025 and 2035
  • Figure 46: Latin America Market Y-o-Y Growth Comparison by Product Form, 2025-2035
  • Figure 47: Latin America Market Attractiveness Analysis by Product Form
  • Figure 48: Latin America Market Value Share and BPS Analysis by End-Use Application, 2025 and 2035
  • Figure 49: Latin America Market Y-o-Y Growth Comparison by End-Use Application, 2025-2035
  • Figure 50: Latin America Market Attractiveness Analysis by End-Use Application
  • Figure 51: Europe Market Value Share and BPS Analysis by Country, 2025 and 2035
  • Figure 52: Europe Market Value Share and BPS Analysis by Ingredient Source, 2025 and 2035
  • Figure 53: Europe Market Y-o-Y Growth Comparison by Ingredient Source, 2025-2035
  • Figure 54: Europe Market Attractiveness Analysis by Ingredient Source
  • Figure 55: Europe Market Value Share and BPS Analysis by Ingredient Type, 2025 and 2035
  • Figure 56: Europe Market Y-o-Y Growth Comparison by Ingredient Type, 2025-2035
  • Figure 57: Europe Market Attractiveness Analysis by Ingredient Type
  • Figure 58: Europe Market Value Share and BPS Analysis by Product Form, 2025 and 2035
  • Figure 59: Europe Market Y-o-Y Growth Comparison by Product Form, 2025-2035
  • Figure 60: Europe Market Attractiveness Analysis by Product Form
  • Figure 61: Europe Market Value Share and BPS Analysis by End-Use Application, 2025 and 2035
  • Figure 62: Europe Market Y-o-Y Growth Comparison by End-Use Application, 2025-2035
  • Figure 63: Europe Market Attractiveness Analysis by End-Use Application
  • Figure 64: East Asia Market Value Share and BPS Analysis by Country, 2025 and 2035
  • Figure 65: East Asia Market Value Share and BPS Analysis by Ingredient Source, 2025 and 2035
  • Figure 66: East Asia Market Y-o-Y Growth Comparison by Ingredient Source, 2025-2035
  • Figure 67: East Asia Market Attractiveness Analysis by Ingredient Source
  • Figure 68: East Asia Market Value Share and BPS Analysis by Ingredient Type, 2025 and 2035
  • Figure 69: East Asia Market Y-o-Y Growth Comparison by Ingredient Type, 2025-2035
  • Figure 70: East Asia Market Attractiveness Analysis by Ingredient Type
  • Figure 71: East Asia Market Value Share and BPS Analysis by Product Form, 2025 and 2035
  • Figure 72: East Asia Market Y-o-Y Growth Comparison by Product Form, 2025-2035
  • Figure 73: East Asia Market Attractiveness Analysis by Product Form
  • Figure 74: East Asia Market Value Share and BPS Analysis by End-Use Application, 2025 and 2035
  • Figure 75: East Asia Market Y-o-Y Growth Comparison by End-Use Application, 2025-2035
  • Figure 76: East Asia Market Attractiveness Analysis by End-Use Application
  • Figure 77: South Asia & Pacific Market Value Share and BPS Analysis by Country, 2025 and 2035
  • Figure 78: South Asia & Pacific Market Value Share and BPS Analysis by Ingredient Source, 2025 and 2035
  • Figure 79: South Asia & Pacific Market Y-o-Y Growth Comparison by Ingredient Source, 2025-2035
  • Figure 80: South Asia & Pacific Market Attractiveness Analysis by Ingredient Source
  • Figure 81: South Asia & Pacific Market Value Share and BPS Analysis by Ingredient Type, 2025 and 2035
  • Figure 82: South Asia & Pacific Market Y-o-Y Growth Comparison by Ingredient Type, 2025-2035
  • Figure 83: South Asia & Pacific Market Attractiveness Analysis by Ingredient Type
  • Figure 84: South Asia & Pacific Market Value Share and BPS Analysis by Product Form, 2025 and 2035
  • Figure 85: South Asia & Pacific Market Y-o-Y Growth Comparison by Product Form, 2025-2035
  • Figure 86: South Asia & Pacific Market Attractiveness Analysis by Product Form
  • Figure 87: South Asia & Pacific Market Value Share and BPS Analysis by End-Use Application, 2025 and 2035
  • Figure 88: South Asia & Pacific Market Y-o-Y Growth Comparison by End-Use Application, 2025-2035
  • Figure 89: South Asia & Pacific Market Attractiveness Analysis by End-Use Application
  • Figure 90: MEA Market Value Share and BPS Analysis by Country, 2025 and 2035
  • Figure 91: MEA Market Value Share and BPS Analysis by Ingredient Source, 2025 and 2035
  • Figure 92: MEA Market Y-o-Y Growth Comparison by Ingredient Source, 2025-2035
  • Figure 93: MEA Market Attractiveness Analysis by Ingredient Source
  • Figure 94: MEA Market Value Share and BPS Analysis by Ingredient Type, 2025 and 2035
  • Figure 95: MEA Market Y-o-Y Growth Comparison by Ingredient Type, 2025-2035
  • Figure 96: MEA Market Attractiveness Analysis by Ingredient Type
  • Figure 97: MEA Market Value Share and BPS Analysis by Product Form, 2025 and 2035
  • Figure 98: MEA Market Y-o-Y Growth Comparison by Product Form, 2025-2035
  • Figure 99: MEA Market Attractiveness Analysis by Product Form
  • Figure 100: MEA Market Value Share and BPS Analysis by End-Use Application, 2025 and 2035
  • Figure 101: MEA Market Y-o-Y Growth Comparison by End-Use Application, 2025-2035
  • Figure 102: MEA Market Attractiveness Analysis by End-Use Application
  • Figure 103: Global Market - Tier Structure Analysis
  • Figure 104: Global Market - Company Share Analysis

Frequently Asked Questions

How big is the Upcycled Pet Ingredients in 2025?

The global Upcycled Pet Ingredients is estimated to be valued at USD 240.0 million in 2025.

What will be the size of Upcycled Pet Ingredients in 2035?

The market size for the Upcycled Pet Ingredients is projected to reach USD 651.4 million by 2035.

How much will be the Upcycled Pet Ingredients growth between 2025 and 2035?

The Upcycled Pet Ingredients is expected to grow at a 10.5% CAGR between 2025 and 2035.

What are the key product forms in the Upcycled Pet Ingredients?

The key product forms in the Upcycled Pet Ingredients Market are dry ingredients, liquid ingredients, and semi-moist ingredients.

Which end-use application segment to contribute significant share in the Upcycled Pet Ingredients in 2025?

In terms of end-use application, Kibble & Dry Pet Food is forecasted to hold the largest share at 47% of the global market in 2025.

Explore Similar Insights

Future Market Insights

Upcycled Pet Ingredients Market

Chat With

MaRIA

Hi There, I am MaRIA, Your Market Research Intelligence Assistant. How may I help you?