The Persistent Epithelial Defect Management Market is estimated to be valued at USD 11.8 billion in 2025 and is projected to reach USD 56.4 billion by 2035, registering a compound annual growth rate (CAGR) of 16.9% over the forecast period.
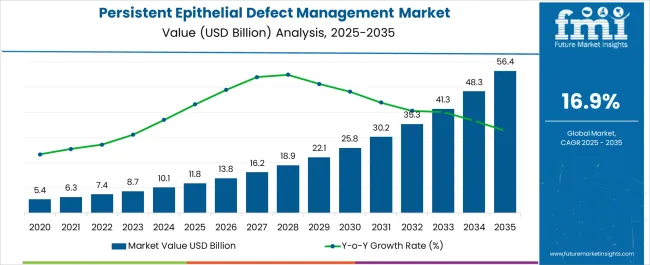
| Metric | Value |
|---|---|
| Persistent Epithelial Defect Management Market Estimated Value in (2025 E) | USD 11.8 billion |
| Persistent Epithelial Defect Management Market Forecast Value in (2035 F) | USD 56.4 billion |
| Forecast CAGR (2025 to 2035) | 16.9% |
The persistent epithelial defect management market is advancing due to increasing prevalence of corneal disorders, rising awareness of ocular health, and technological improvements in regenerative therapies. A growing patient pool with chronic ocular surface conditions is creating sustained demand for innovative treatment modalities that support faster healing and reduce recurrence.
Clinical research has accelerated the development of advanced biologics, stem cell therapies, and growth factor-based approaches, improving treatment efficacy and patient outcomes. Hospitals and clinics are increasingly adopting multidisciplinary strategies combining pharmacological, surgical, and device-based interventions to address complex cases.
Regulatory bodies are also placing emphasis on safe and effective solutions that enhance long-term corneal health, encouraging innovation and adoption. With continuous advancements and strong focus on reducing vision impairment risks, the market outlook remains positive, offering opportunities for both established players and new entrants.
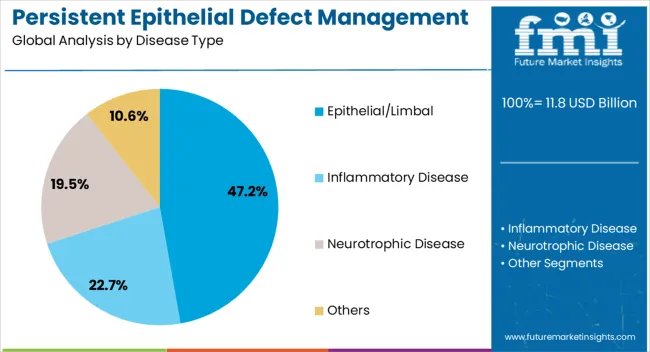
The epithelial or limbal segment is projected to contribute 47.20% of total market revenue by 2025, making it the leading disease type category. This dominance is driven by the high incidence of limbal stem cell deficiency and recurrent corneal epithelial breakdown, both of which require specialized and continuous management.
Advanced therapeutic options such as amniotic membrane transplantation, autologous serum drops, and stem cell-based approaches have been increasingly utilized in this segment, strengthening its market position.
The critical nature of timely intervention in preventing corneal scarring and vision loss has further supported adoption, consolidating its share as the most prominent disease type.
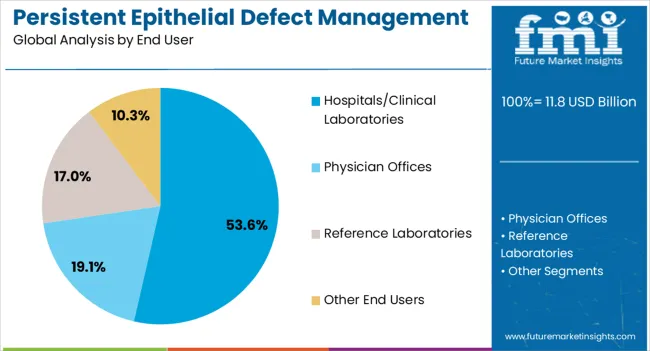
The hospitals and clinical laboratories segment is expected to hold 53.60% of total revenue by 2025, positioning it as the dominant end user. This leadership is attributed to the presence of advanced infrastructure, availability of specialized ophthalmologists, and access to cutting-edge diagnostic and therapeutic technologies.
Hospitals and clinical laboratories also manage a higher volume of patients requiring complex ocular interventions, making them central hubs for persistent epithelial defect treatment. The integration of multidisciplinary care and ongoing clinical trials within hospital settings has further reinforced their role in advancing treatment outcomes.
As patient preference leans toward specialized care facilities with comprehensive treatment options, hospitals and clinical laboratories continue to account for the largest revenue share in the market.
The global persistent epithelial defect management market is expected to surge at a CAGR of 18% for the forecast period compared to the historic CAGR from 2020 to 2025 of 19.3%, as per Future Market Insights, a provider of market research and com compared to the competitive intelligence.
Patients usually present with pain, watering, and foreign body sensation in the affected eye. However, these features may be absent in neurotrophic PEDs. There may be blurring of vision, redness, photophobia, pain with blinking, and eye movements. PED, if left untreated, can lead to corneal inflammation, infection, ulceration, scarring, melting, and even perforation due to disruption of the protective epithelial and stromal layers of the cornea.
A comprehensive history comprising duration, mechanism of trauma, prior treatment received and surgeries, associated ocular and systemic comorbidities, family history, and immune status will help arrive at an etiological diagnosis and allow more specific treatment. Distinguishing an epithelial defect from a PED can be done based on the time required for complete healing after an injury. An epithelial defect recovers by 7 to 10 days, while a PED will not heal even after two weeks, and such a patient is usually refractory to standard treatments and supportive care
But nowadays, a thorough examination of both the eyes, adnexa, and systemic assessment is of utmost importance to determine the etiology. Fluorescein staining is used to photograph the defect for serial monitoring and measuring the size, depth, and location of the epithelial defect using a slit lamp. Deeper PEDs take longer to absorb the fluorescein into the stroma and frequently have grayish-white edges with heaped-up epithelium.
Associated signs of infection, such as underlying haze and infiltrates and anterior chamber inflammation, must be actively sought.
There can be associated basement membrane dystrophies, nodular degeneration, dendrites, limbal stem cell deficiency, conjunctival injection, features of superior limbic keratoconjunctivitis, allergic conjunctivitis, foreign body, and concretions. It is essential to assess dry eyes using the Schirmer test and tear-film breakup time. The Rose Bengal dye stains devitalized epithelial cells, implying impaired tear function, regardless of gross tear flow.
The diagnosis of PED is primarily clinical. It can be supplemented by investigations that help to quantify the lesion and track its progress.
AS-OCT is a non-invasive definitive technique for quantifying epithelial thickness and loss over time, especially in areas of corneal thinning and scarring. Confocal microscopy is a technique that allows the imaging of thin layers of living corneal cellular structures in real time. In vivo HRT-II confocal microscopy has been designed for studying the superficial and peripheral corneal and conjunctival epithelium.
For systemic comorbidities, relevant systemic investigations must be conducted. For example, in patients with diabetes, fasting and postprandial blood sugar levels and HbA1C values are measured. Vitamin A deficiency can be confirmed by measuring serum retinol-binding protein and zinc levels.
Rheumatoid factor, anti-cyclic citrullinated peptide (anti-CCP) antibody for rheumatoid arthritis, antinuclear antibody (ANA), anti-double-stranded DNA (anti-dsDNA) antibody for systemic lupus erythematosus (SLE), anti-Ro/SSA, and anti-La/SSB antibody for Sjogren syndrome are all autoimmune indicators.
Increased Partnerships and Collaborations
The increasing partnerships and collaborations between numerous companies boost market growth. For instance, in October 2020, Bio-Tissue entered a strategic agreement with Optima Pharmazeutische GmbH, a pharmaceutical company that offers otorhinolaryngology, ophthalmology, and pneumology products. This agreement helps the company to distribute its Natural Ocular Cleanser in Germany. Thus, all these collaborations boost the growth of the market.
Higher Demand for Hospitals
The increasing demand for hospitals surges the market grows rapidly. Most chronic disease diagnostics are majorly performed in hospitals since they are very complex and it requires technologically advanced products and thus this is boosting the market for hospital/clinical laboratories.
Lack of skilled professionals
The lack of qualified healthcare professionals who cannot treat the patients with appropriate treatments could reduce the growth of the persistent corneal epithelial defect treatment market over a forecast period.
High Cost of Treatment
The enormous expenditure that is required for setting up these techniques hinders market growth. Numerous market players make huge investments in installing new and advanced machines to faster the process and in return, the cost is increased.
This persistent corneal epithelial defects treatment market report provides details of new recent developments, trade regulations, import-export analysis, production analysis, value chain optimization, market share, the impact of domestic and localized market players, analyses opportunities in terms of emerging revenue pockets, changes in market regulations, strategic market growth analysis, market size, category market growths, application niches and dominance, product approvals, product launches, geographic expansions, technological innovations in the market.
The presence of key players and increasing initiatives are accelerating the growth
North America’s persistent epithelial defects treatment market is expected to witness significant growth during the forecast period. Although numerous therapies exist and a growing number of novel approaches are evolving, treatment of this disease can still be quite challenging.
It is necessary to treat the underlying causative condition, which includes infection, limbal stem cell deficiency, or diabetes, to facilitate wound healing. The introduction of the latest technology development which offers various therapies for treating various complications caused by the disorder and the rise in the incidence of dry eye syndrome boosts the market growth.
The market in North America was valued at USD 10.1 million in 2024. In addition to the market insights such as market value, growth rate, market segments, geographical coverage, market players, and market scenario, the market report curated by the Future Market Insights team also includes in-depth expert analysis, patient epidemiology, pipeline analysis, pricing analysis, and regulatory framework.
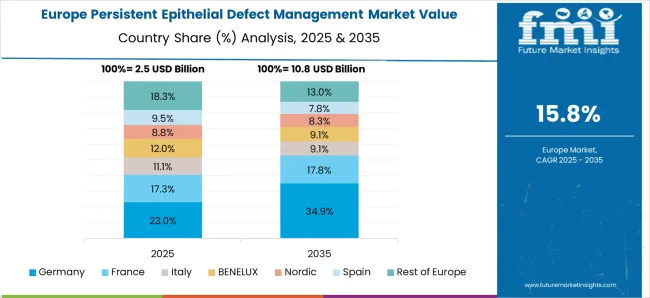
The persistent epithelial defects treatment market is projected to witness significant growth during the forecast period. Although several therapies exist and an increasing number of novel approaches are evolving, treatment of this disease can still be quite challenging. It is essential to treat the underlying causative condition, which includes infection, limbal stem cell deficiency, or diabetes, to facilitate wound healing.
The introduction of the latest technology development offers numerous therapies for treating several complications caused by the disorder and the increase in the incidence of market growth. The expected CAGR of the persistent epithelial defects treatment market in Europe is likely to amount to 17.8% from 2025 to 2035.
The Asia-Pacific persistent epithelial defects treatment market is projected to witness significant growth during the forecast period. Although several therapies exist and an increasing number of novel approaches are evolving, treatment of this disease can still be quite challenging. It is essential to treat the underlying causative condition, which includes infection, limbal stem cell deficiency, or diabetes, to facilitate wound healing.
The introduction of the latest technology development offers numerous therapies for treating several complications caused by the disorder and the increase in the incidence of market growth. A growth rate in the persistent epithelial defects treatment market in the forecast period 2025 to 2035. The expected CAGR in the Asia Pacific is expected to be around 17.7% in the mentioned forecast period.
The epithelial/limber segment will gain the dominant market share
Over the course of the forecast period, the epithelial/limber segment of disease type is anticipated to occupy a significant share of the global persistent epithelial defect management treatment market. In 2025, this category is also anticipated to acquire revenue share.
Due to their superior therapeutic activity, the epithelial/limber segment subgroup of disease types occupies a leading position in the worldwide persistent epithelial defect market. This is so because, epithelial cell migration and corneal epithelial stem cells in the limbus are crucial to regenerate the tissue after an insult to the corneal epithelium. Therefore, limbal stem cell deficiency (LSCD) often results in the inability of epithelial regeneration, stromal melting, scarring, persistent epithelial defects, corneal conjunctivalization, and neovascularization.
One of the common causes of severe limbal stem cell deficiency is an alkali-induced chemical injury from lye, household cleaning solutions, and fertilizers. Such factors are expected to accelerate the growth prospects for persistent epithelial defect management treatment from 2025 to 2035. The way to cure epithelial/limber disease is when the limbal stem cell deficiency has not yet fully developed, it can be treated with eye drops. However, in severe cases, limbal stem cell transplantation is regarded as the best option.
The demand for hospital/clinical laboratories will be more during the forecast period.
According to a report by Future Market Insights, the hospital/clinical laboratories would grow within the anticipated time frame. This market sector is expected to hold a greater share of the worldwide market from 2025 to 2035.
Due to the growing number of people visiting hospitals for advice on treatment related to epithelial/limber disease, the hospital/clinical laboratory sector is anticipated to dominate the worldwide persistent epithelial defect management market.
As a result, individuals more pertain towards their health and well-being. Thus, the majority of consumers are expected to only buy medications from hospital pharmacies.
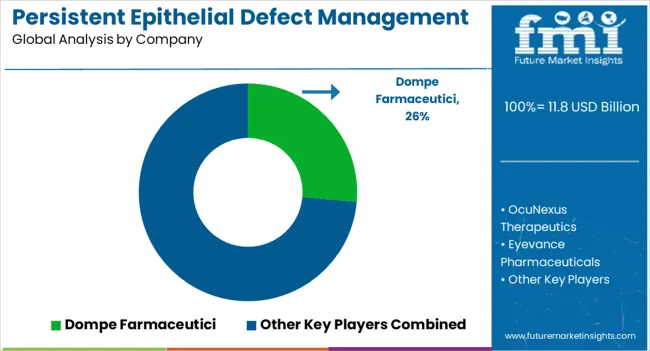
The persistent epithelial defects management treatment market competitive landscape provides details of competitors. Details included are company overview, company financials, revenue generated, market potential, investment in research and development, new market initiatives, global presence, production sites and facilities, production capacities, company strengths and weaknesses, product launch, product width, and breadth, and application dominance. The above data points provided are only related to the companies' focus related to the persistent corneal epithelial defects treatment market.
Some of the important developments of the key players in the market are
| Report Attribute | Details |
|---|---|
| Growth Rate | 18% CAGR |
| Base Year Estimation | 2025 |
| Market Value in 2025 | USD 8.5 billion |
| Market Value in 2035 | USD 44.49 billion |
| Historical Data | 2020 to 2025 |
| Forecast Period | 2025 to 2035 |
| Quantitative Units | USD billion for Value and CAGR from 2025 to 2035 |
| Reports Coverage | Revenue Forecast, Company Ranking, Competitive Landscape, Growth Factors, Trends, and Pricing Analysis |
| Segments Covered | Disease Type, End User, Region |
| Regions Covered | North America; Latin America; Europe; South Asia; East Asia; Oceania; Middle East & Africa |
| Key Countries Profiled | United States, Canada, Brazil, Mexico, United Kingdom, Spain, Germany, Italy, France, China, Japan, South Korea, India, Malaysia, Singapore, Thailand, South Africa, Australia, New Zealand, GCC Countries, South Africa, Israel |
| Key Companies Profiled | Dompe Farmaceutici; OcuNexus Therapeutics; Eyevance Pharmaceuticals; Noveome Biotherapeutics; RegeneRx Biopharmaceuticals; Recordati Rare Diseases; Mimetech; Johnson & Johnson Services Inc.; Bausch Health Companies Inc.; Integra Lifesciences |
| Customization Scope | Available on Request |
The global persistent epithelial defect management market is estimated to be valued at USD 11.8 billion in 2025.
The market size for the persistent epithelial defect management market is projected to reach USD 56.4 billion by 2035.
The persistent epithelial defect management market is expected to grow at a 16.9% CAGR between 2025 and 2035.
The key product types in persistent epithelial defect management market are epithelial/limbal, inflammatory disease, neurotrophic disease and others.
In terms of end user, hospitals/clinical laboratories segment to command 53.6% share in the persistent epithelial defect management market in 2025.


Full Research Suite comprises of:
Market outlook & trends analysis
Interviews & case studies
Strategic recommendations
Vendor profiles & capabilities analysis
5-year forecasts
8 regions and 60+ country-level data splits
Market segment data splits
12 months of continuous data updates
DELIVERED AS:
PDF EXCEL ONLINE
Advanced Persistent Threat Protection Market
Tax Management Market Size and Share Forecast Outlook 2025 to 2035
Key Management as a Service Market
Cash Management Supplies Packaging Market Size and Share Forecast Outlook 2025 to 2035
Fuel Management Software Market Size and Share Forecast Outlook 2025 to 2035
Risk Management Market Size and Share Forecast Outlook 2025 to 2035
SBOM Management and Software Supply Chain Compliance Market Analysis - Size, Share, and Forecast Outlook 2025 to 2035
Case Management Software (CMS) Market Size and Share Forecast Outlook 2025 to 2035
Farm Management Software Market Size and Share Forecast Outlook 2025 to 2035
Lead Management Market Size and Share Forecast Outlook 2025 to 2035
Pain Management Devices Market Growth - Trends & Forecast 2025 to 2035
Data Management Platforms Market Analysis and Forecast 2025 to 2035, By Type, End User, and Region
Cash Management Services Market – Trends & Forecast 2025 to 2035
CAPA Management (Corrective Action / Preventive Action) Market
Exam Management Software Market
Light Management System Market Size and Share Forecast Outlook 2025 to 2035
Labor Management System In Retail Market Size and Share Forecast Outlook 2025 to 2035
Waste Management Carbon Credit Market Size and Share Forecast Outlook 2025 to 2035
Waste Management Market Size and Share Forecast Outlook 2025 to 2035
Stool Management System Market Analysis - Size, Share, and Forecast Outlook 2025 to 2035

Thank you!
You will receive an email from our Business Development Manager. Please be sure to check your SPAM/JUNK folder too.
Chat With
MaRIA