

- Market Size (2026)
- USD 36.8 Bn
- Forecast (2036)
- USD 58.8 Bn
- CAGR (2026 to 2036)
- 4.8%
How big is Platinum Group Metals PGM Market in 2026?
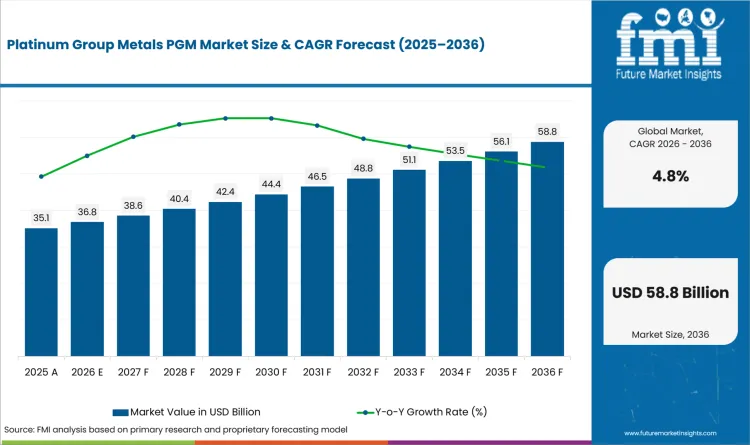
USD 36.8 billion in 2026 and USD 58.8 billion by 2036 at a 4.8% CAGR.
Demand in the Platinum Group Metals PGM market is anticipated to push valuation from USD 36.8 billion in 2026 to USD 58.8 billion by 2036 at a 4.8% CAGR over the forecast period. Growth is supported by steady demand across industrial and emerging clean-energy applications, even as supply constraints influence metal availability and pricing. For instance, Johnson Matthey reported in May 2026 that industrial PGM use remained firm as constrained mine output limited the 2026 supply balance. Its report also identified recovering autocatalyst recycling and the first commercial-scale iridium use in PEM electrolysis. These routes follow different purchasing cycles, so each contract must match the required metal form with a dependable delivery schedule.
Supply planning differs between mine-led Southern Africa and consuming regions that rely more heavily on recovered feed. Valterra Platinum reported in April 2026 that refined PGM production reached 778,500 ounces during the first quarter after higher mined output and revised maintenance timing. The result shows how processing schedules can change deliverable metal without a similar change in end-use requirements. North American and European manufacturers can reduce part of that exposure through metal recycling systems once collected material meets assay and contamination limits. Japanese and South Korean hydrogen programs create narrower platinum and iridium requirements through fuel-cell and electrolyser components. Commercial planning therefore needs separate assumptions for mine output and recovered feed alongside application qualification across each regional route.
Key Takeaways of Platinum Group Metals PGM Market
- Automotive exhaust treatment and industrial reactions require recurring PGM supply through formulations that remain qualified across demanding production cycles.
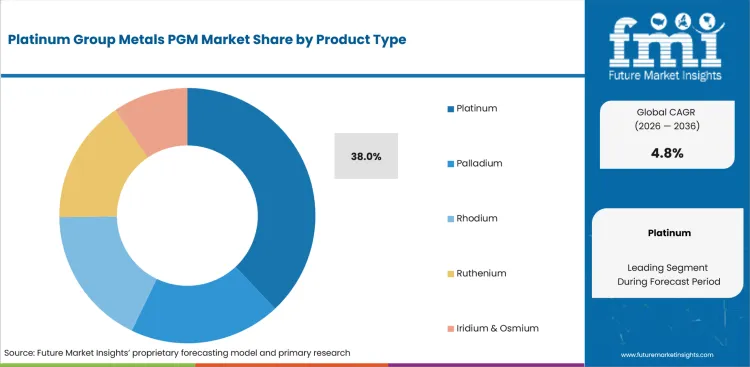
- Platinum is estimated to represent 38.0% of product type in 2026 through broad catalytic and chemical functionality.
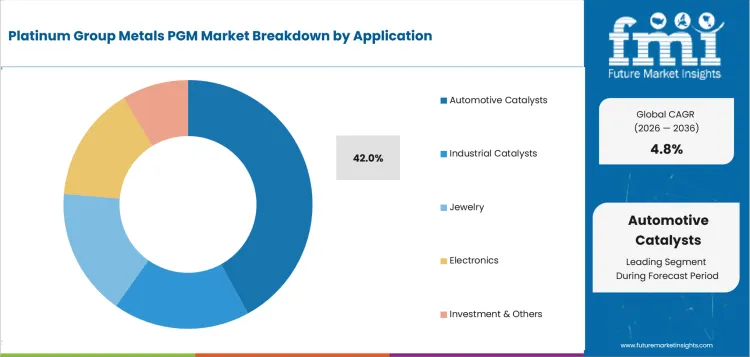
- Automotive catalysts are projected to account for 42.0% of application in 2026 through regulated exhaust-treatment programs.
- Primary mining is forecast to capture 71.0% of source in 2026 since recovered material depends on collection and assay quality.
- Concentrated production and metal substitution can change inventory exposure alongside the cost and timing of application requalification.
- Competition spans integrated miners, specialist refiners and diversified producers whose customer services differ from their physical metal output.
Analyst Perspective
"PGM demand requires a metal-by-metal assessment since automotive catalysts, chemical processes, data storage, and hydrogen equipment follow different replacement cycles. The strongest commercial position does not come from mine scale alone or from temporary price advantage. It comes from matching the required metal form with dependable refining and clear settlement terms. Management should protect autocatalyst exposure while testing narrower platinum and iridium routes against real qualification schedules."
- Nikhil Kaitwade, Principal Analyst, Future Market Insights
How is the Platinum Group Metals PGM market segmented?
The platinum group metals PGM market is segmented by Product Type, Application, End User, Distribution Channel, Source, and Region.
The market is organized by product type, application, end user, distribution channel, source, and region. Product type separates six metals with different catalytic properties, processing routes, and price exposure across qualified uses. Application distinguishes automotive catalysts from industrial processes and consumer uses across different replacement and purchasing cycles. End user identifies the industries that consume metal inside qualified production systems or hold refined material as an investment. Distribution channel separates negotiated supply agreements from distributors and exchange-based trading with different settlement responsibilities. Source distinguishes mined output from recycled material and by-product recovery through separate availability and quality constraints. Regional analysis compares countries with different mine access, recycling depth, industrial demand, and hydrogen investment. The selected segment shares are 2026 estimates within categories that follow distinct technical qualifications and settlement practices.
What supports platinum within the product type category?
Platinum combines catalytic durability with resistance to heat and chemical attack across exhaust treatment and industrial reaction systems. Valterra Platinum reported in February 2026 that refined PGM production reached 3.412 million ounces during 2025. The integrated processing result shows how mine output must pass through smelting and refining before it becomes deliverable metal. Demand for platinum compounds broadens the commercial route beyond vehicle catalysts into chemical and electronic formulations.
- Platinum is projected to hold 38.0% share in 2026 owing to its functional range across automotive and industrial reactions. Its position depends on accepted purity and reliable refining history, since different applications require specific forms rather than interchangeable bulk metal. Industrial users also value platinum where thermal stability protects process quality across long campaigns and repeated regeneration cycles.
- Platinum is drawing attention from chemical processors and electronics manufacturers that need stable performance through repeated production cycles. Controlled inputs for precious-metal plating chemicals strengthen demand, although high prices encourage engineers to reduce loadings or qualify alternative metals. Refiners must maintain lot consistency and precise settlement records across recurring purchases from established industrial accounts.
Why do automotive catalysts retain a large application share?
Automotive catalysts use platinum and palladium alongside rhodium to convert regulated exhaust gases during combustion and hybrid operation. Engine design and regional emission limits determine the approved metal mix for each vehicle program. Emission-control catalysts therefore link PGM consumption with coating durability and thermal performance across established vehicle programs. Catalyst manufacturers must preserve conversion efficiency through aging tests before a formulation enters high-volume production.
- By application, automotive catalysts are estimated to hold 42.0% in 2026 owing to mandatory exhaust treatment across combustion and hybrid fleets. Umicore reported in April 2026 that its automotive catalyst unit outperformed global light-duty vehicle production through strong demand across Europe and China as well as India. The result confirms active demand across qualified programs without serving as proof of the approved segment share.
- Automakers are increasingly purchasing automotive catalyst systems through approved programs that survive thermal aging and regional emission tests. Engineering teams continue to reduce PGM loadings or change metal ratios, but every adjustment requires fresh validation across durability and warranty conditions. The commercial value lies in preserving emissions performance without extending vehicle-program approval schedules or warranty testing.
How does the automotive industry shape the end-user category?
The automotive industry coordinates metal supply with catalyst coaters and exhaust-system manufacturers across multiyear vehicle programs. Powertrain changes can alter palladium and rhodium requirements before total vehicle output shifts materially across regional programs. Production plans therefore need separate assumptions for combustion models and hybrids alongside battery-electric substitution effects. Catalyst manufacturers must preserve approved formulations during platform transfers and model redesigns across regional factories.
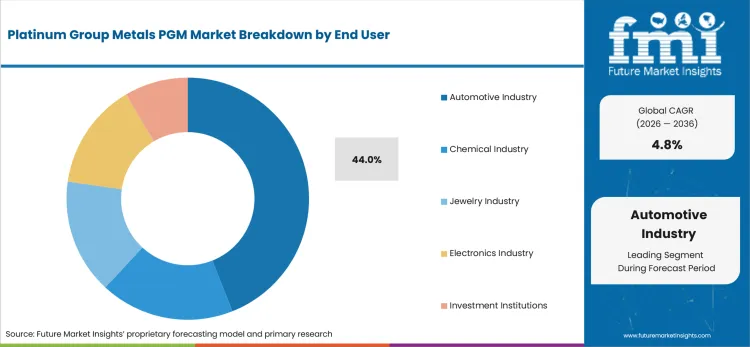
- In 2026, the automotive industry is expected to lead end user with 44.0% share because qualified catalyst programs require recurring metal supply. Original-equipment manufacturers protect continuity through approved refiners and contracted metal routes during platform launches and replacement cycles. This structure reduces production risk during model launches that require uninterrupted catalyst supply across several factories.
- Demand for PGM supply programs is expected to grow among automakers that manage combustion and hybrid platforms across several regions. Umicore reported in February 2026 that automotive catalyst revenue remained stable despite a moderately weaker global vehicle market. The result shows how qualified programs sustain orders across three-way converter systems even during softer production periods.
Why do direct sales remain important within distribution channel?
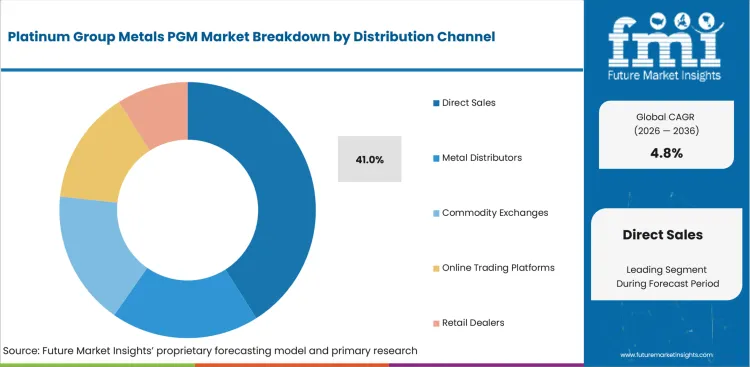
Large PGM users need negotiated specifications and delivery schedules that public exchanges cannot fully represent. Johnson Matthey described customer metal accounts and global refining services in its June 2026 annual report. These services support title transfer and assay settlement through direct commercial relationships with accountable counterparties. Direct contracts also assign treatment losses and delivery exceptions across volatile price periods, which reduces ambiguity during repeated transactions.
- Direct sales are set to lead the distribution channel category with 41.0% share in 2026 due to negotiated metal forms and delivery schedules. Long-term agreements define settlement timing and treatment charges beside leasing or inventory arrangements through annual purchasing cycles and planned maintenance periods. Customers also gain clearer responsibility for assay disputes and delayed deliveries across each annual contract.
- Purchase activity for direct sales is anticipated to rise among catalyst manufacturers and chemical processors that need prompt resolution of assay differences. The route loses value if regional support remains limited or settlement terms obscure refining losses across recurring customer accounts. Clear escalation rules protect production schedules during disputed deliveries and treatment adjustments across the contract term.
How does primary mining shape the source category?
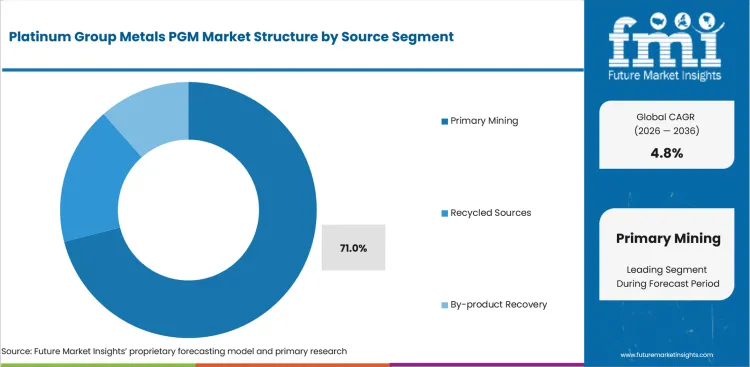
Mine production supplies most new PGM units given that secondary output depends on collection timing and scrap quality. Primary operations therefore anchor physical availability across automotive and industrial demand despite wider secondary processing capacity. Concentrated ore bodies expose industrial customers to regional disruptions and planned processing maintenance across integrated production networks. Mine operators must coordinate concentrator output with smelter and refinery capacity across schedules that can temporarily reduce deliverable metal.
- The source category is forecast to be led by primary mining at 71.0% share in 2026 due to established ore and refining capacity. The USA Geological Survey reported in February 2026 that South Africa and Russia remained central sources of global PGM mine production within the reported supply structure. The concentration makes processing continuity a direct commercial issue for users with limited inventory cover.
- Metal users are expected to favour primary mining over alternatives where recovered material cannot meet volume or purity requirements. Recycling broadens supply as spent catalysts and industrial residues reach refinery thresholds for metal content, contamination, and consistent settlement. Collection delays can restrict secondary output during periods when higher prices would otherwise support commercial recovery.
What are the drivers, restraints, and opportunities in the Platinum Group Metals PGM market?
Regulated catalyst programs create recurring PGM demand, concentrated mine supply and substitution complicate inventory planning, closed-loop recovery expands usable secondary metal once feed quality and refining routes are verified.
- Driver: Established automotive and industrial catalyst programs require repeat metal supply through qualified formulations and planned replacement cycles.
- Restraint: Concentrated mine production and metal substitution increase inventory exposure alongside the cost and timing of application requalification.
- Opportunity: Closed-loop recovery expands usable secondary supply through traceable collection and refining routes that return verified metal to production.
Regulated vehicle fleets create recurring catalyst requirements through new production and replacement channels in automotive markets. The Society of Motor Manufacturers and Traders reported in April 2026 that the United Kingdom vehicle fleet reached 42.55 million units during 2025. Older combustion vehicles remain exposed to exhaust-treatment servicing, although metal loading differs across models and powertrains. The fleet figure therefore supports a continuing catalyst base without proving equal PGM demand for every vehicle. Manufacturers should model replacement demand separately from new-platform loading and electric-vehicle substitution across each regional fleet profile.
Concentrated mine production limits rapid supply responses during disruptions or extended processing maintenance across major production regions. The World Platinum Investment Council forecast a 297,000-ounce platinum deficit in May 2026 and expected year-end stocks below three months of global demand. The balance increases inventory pressure for platinum but does not establish identical shortages across palladium or rhodium. Metal users need separate exposure limits and approved substitution routes for each formulation and contracted delivery period. Longer contracts become harder to justify commercially if supply risk and requalification costs remain unassigned.
Closed-loop recovery creates a commercial opening through scrap streams that already contain qualified platinum-group metals. Johnson Matthey reported in March 2026 that kilogram-scale PGM and ionomer recovery had been demonstrated from PEM component scrap. The program reintegrated recovered material into new membrane-electrode assemblies without reducing performance during subsequent validation trials. Future feed pools could expand as hydrogen electrolyzer components reach replacement across installed equipment. Recovery projects need sufficient collection volume and strict contamination controls to support dependable commercial refining economics.
Which country CAGRs are profiled in the Platinum Group Metals PGM market?
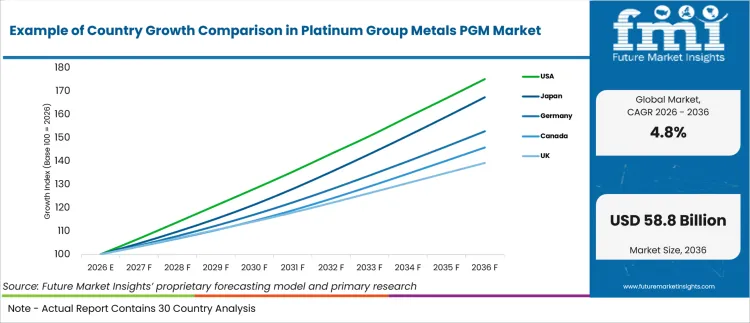
| Country | CAGR |
|---|---|
| Australia | 6.2% |
| USA | 5.8% |
| Japan | 5.3% |
| South Korea | 4.8% |
| Germany | 4.3% |
| Canada | 3.8% |
| UK | 3.4% |
How do country-level CAGRs compare in the Platinum Group Metals PGM market?
The profiled country rates span 2.8 percentage points between Australia and the United Kingdom. The measured spread describes forecast pace and not current market size or guaranteed project returns. Commercial conditions depend on local mine output, recycling capacity, qualified industrial demand, and hydrogen investment. Country plans therefore need operating evidence beyond the approved CAGR table and verified local constraints.
- Australia pairs the broadest forecast pace with substantial resources but limited output from dedicated PGE operations.
- The USA combines established autocatalyst recovery with collection economics that determine the volume of specification-ready secondary metal.
- Japan links fuel-cell commercial vehicles with regional infrastructure planning but faces high hydrogen costs outside priority corridors.
- South Korea coordinates vehicle and station support through one program while maintenance coverage shapes wider fleet reliability.
- Germany retains a large combustion-vehicle base as battery-electric registrations reduce catalyst requirements across new model cycles.
- Canada offers direct mine and by-product output although remote operations remain exposed to logistics and base-metal economics.
- The United Kingdom has established refining and recycling capability but limited primary PGM extraction within its domestic supply base.
The full report provides country-level CAGR analysis across North America, Latin America, Europe, East Asia, South Asia, Oceania and the Middle East and Africa.
Country-wise Analysis
- Australia has substantial PGE resources but no dedicated operating PGE mine within the national inventory. Platinum Group Metals PGM sales in Australia are forecast to expand at 6.2% CAGR by 2036, due to by-product recovery and a large undeveloped resource base. Nickel and copper projects offer a practical recovery route, although complex metallurgy and long development schedules limit near-term output. Geoscience Australia recorded 527.6 tonnes of PGE economic resources and 0.575 tonnes of 2024 production in December 2025. The gap between resources and current output prevents resource estimates from serving as a direct measure of deliverable supply. New entrants should secure processing partners and offtake terms rather than assume standalone mining economics across remote projects.
- United States refiners have established collection and processing routes for spent automotive catalysts and industrial residues. Domestic recovery capacity gives manufacturers a local source of secondary metal, but feed quality changes with vehicle scrappage and metal prices. By 2036, the United States Platinum Group Metals PGM market is projected to grow at 5.8% CAGR, supported by autocatalyst recovery and industrial consumption. The USA Geological Survey reported in February 2026 that automotive catalysts remained the principal domestic PGM use in September 2025. Refinery throughput differs from specification-ready output, assay losses and contamination can materially reduce final metal returns. Commercial plans should measure recovered metal yield and settlement timing across each contracted material stream.
- Japan is organizing fuel-cell commercial-vehicle corridors around coordinated fleet and hydrogen-station planning within selected freight regions. In Japan, Platinum Group Metals PGM demand is predicted to advance at 5.3% CAGR through 2036, linked to fuel-cell commercial vehicles and specialized industrial uses. The Ministry of Economy, Trade and Industry selected five priority regions in May 2025 and paired the program with added fuel-cost support. The regional model creates an identifiable route for platinum-containing fuel-cell systems rather than nationwide demand from the start. High hydrogen cost and strict component qualification remain material barriers outside supported regional corridors and fleet programs. Companies serving PEM fuel-cell components should align technical support with fleet schedules and station uptime commitments.
- South Korea links hydrogen-vehicle subsidies with refueling-station investment through one national deployment program for commercial transport. The coordinated structure gives component manufacturers a visible route into bus and passenger-vehicle fleet operators. South Korea is estimated to post 4.8% CAGR over the forecast period, reinforced by simultaneous vehicle and station support. The South Korea's environment ministry allocated support for 7,820 vehicles and more than 500 cumulative stations in January 2026. Station utilization and maintenance coverage remain material operating frictions outside dense urban corridors and supported fleet routes. Entrants should combine component qualification with a local service plan that assigns response times across fleet and station operators.
- Germany combines a large passenger-car fleet with formal technical approval across automotive supply chains nationwide. Germany's Platinum Group Metals PGM outlook is anticipated to advance at 4.3% CAGR over the assessment period, influenced by replacement demand across a large registered fleet. Battery-electric registrations reduce catalyst requirements in new vehicles, but existing combustion and hybrid models continue to create replacement exposure. Destatis reported in July 2026 that 49.5 million passenger cars were registered at the start of the year. The fleet provides a measurable installed base without proving equal catalyst replacement across every vehicle. Commercial forecasts should separate service demand from new-platform loading and regional powertrain changes through 2036.
- Canada combines one dedicated PGM mine with by-product recovery from nickel operations across several provinces. Natural Resources Canada reported in January 2026 that 2024 mine production reached 746,000 troy ounces and Ontario supplied 74%. Adoption of Platinum Group Metals PGM supply in Canada is estimated to expand at 3.8% CAGR through 2036, supported by existing mining and smelting infrastructure. The direct production base provides an enabler for domestic supply and export contracts across established customer routes. Remote service distances and exposure to base-metal economics remain material operating frictions for northern mining operations. Project plans should test logistics and processing agreements rather than assign value to undeveloped ore or future by-product streams.
- The United Kingdom has established PGM refining and industrial catalyst recovery but limited primary extraction. Platinum Group Metals PGM demand in the United Kingdom is forecast to rise at 3.4% CAGR over the forecast period, linked to refining and recycling capability rather than domestic mine output. The Department for Business and Trade published the UK Critical Minerals Strategy in November 2025 and identified PGMs within established midstream and recycling capability. The strategy provides a policy enabler for domestic processing and critical-mineral recovery across established industrial facilities. Feed availability and recovery cost remain practical constraints for expanding specification-ready secondary PGM output at commercial scale. Operators recovering metals from electronic-waste should secure material contracts and assay standards and then add specialized separation capacity.
Who are the notable companies in the Platinum Group Metals PGM market?
Valterra Platinum Limited, Impala Platinum Holdings Limited, Sibanye-Stillwater Limited, Northam Platinum Holdings Limited, Johnson Matthey Plc, Heraeus Precious Metals, Nornickel, and Vale S.A.
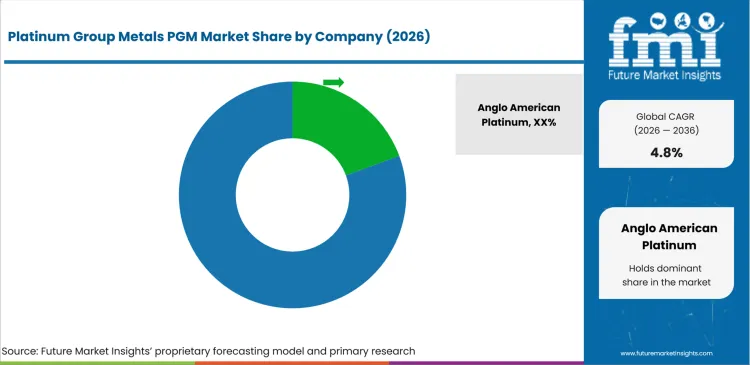
PGM competition spans mine operators, refiners and diversified by-product producers with different routes to customer contracts. Implats reported in March 2026 that refined and saleable six-element production reached 1.78 million ounces during the first half of FY2026. The figure confirms operating scale but does not establish equal recycling depth or metal-account capability across peers. Company comparisons therefore need to separate primary output from third-party refining and customer settlement services. Geographic access shapes contract performance through different mine concentration and customer-support footprints across the peer group.
- Valterra Platinum and Northam combine mine ownership with concentrator and refining capacity across Southern Africa. Northam operates a narrower integrated production base, whereas Sibanye-Stillwater and Implats add different recycling or third-party treatment routes. Their commercial positions depend on processing continuity and the ability to deliver contracted metal through scheduled maintenance.
- Johnson Matthey and Heraeus Precious Metals focus on refining and customer metal services rather than primary mining. Their platforms serve catalyst and industrial accounts that need assay settlement alongside refined metal for environmental catalyst applications.
- Nornickel and Vale produce PGMs within broader nickel and copper portfolios that follow base-metal operating priorities. PGM availability from both companies therefore depends partly on operating decisions made for larger base-metal systems.
Competitive Benchmarking: Platinum Group Metals PGM Market
| Company | Primary PGM Production | Recycling and Refining | Customer Metal Services | Geographic Reach |
|---|---|---|---|---|
| Valterra Platinum Limited | High | Medium | Medium | Southern Africa and global sales |
| Impala Platinum Holdings Limited | High | High | Medium | Southern Africa and global sales |
| Sibanye-Stillwater Limited | High | High | Medium | Southern Africa and United States |
| Northam Platinum Holdings Limited | High | Medium | Low | Southern Africa |
| Johnson Matthey Plc | Low | High | High | Global |
| Heraeus Precious Metals | Low | High | High | Global |
| Nornickel | High | Medium | Low | Russia-focused production |
| Vale S.A. | Medium | Low | Low | Canada-focused PGM output |
Key Developments in the Platinum Group Metals PGM Market
- In September 2025, Sibanye-Stillwater completed the acquisition of Metallix and added two United States precious-metal recycling facilities. The acquired operations brought established processing capacity and a customer base for PGM-bearing materials across several industrial feed streams. The transaction widened Sibanye-Stillwater's recovery route, although commercial value depends on feed collection and consistent assay settlement across the combined network.
- In February 2026, Johnson Matthey formed a multi-year PGM technology collaboration with Sibanye-Stillwater and Valterra Platinum. The program targets hydrogen and emission-control technologies alongside electronic materials that require qualified PGM functions and repeat validation. It creates a route from producer-backed research toward qualified applications, but commercial impact depends on selected projects reaching repeat production and customer validation.
- In July 2026, Northam Platinum reported record own production of 938,754 four-element ounces for the financial year. Total metal sold reached 1,087,327 ounces during the same completed financial reporting period. The update confirms expanded operating scale, although customer value depends on refining continuity and delivery performance across contracted sales and third-party material flows.
Key Players in the Platinum Group Metals PGM Market
Integrated PGM Producers
- Valterra Platinum Limited
- Impala Platinum Holdings Limited
- Sibanye-Stillwater Limited
- Northam Platinum Holdings Limited
Refining and Customer Metal Service Providers
- Johnson Matthey Plc
- Heraeus Precious Metals
Diversified and By-product Producers
- Nornickel
- Vale S.A.
Platinum Group Metals PGM Market - Report Scope
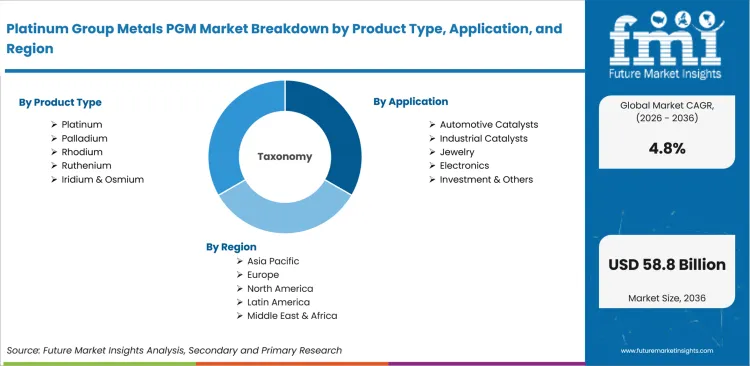
| Coverage field | Report scope |
|---|---|
| Market breakdown | Product Type, Application, End User, Distribution Channel, Source, and Region. |
| Market Definition | Primary and recycled platinum, palladium, rhodium, ruthenium, iridium, and osmium supplied into automotive, chemical, jewelry, electronics, hydrogen, and investment applications. |
| Regions Covered | North America, Latin America, Western Europe, Eastern Europe, East Asia, South Asia and Pacific, and the Middle East and Africa. |
| Countries Covered | Australia, USA, Japan, South Korea, Germany, Canada, and UK. |
| Key Companies Profiled | Valterra Platinum Limited, Impala Platinum Holdings Limited, Sibanye-Stillwater Limited, Northam Platinum Holdings Limited, Johnson Matthey Plc, Heraeus Precious Metals, Nornickel, and Vale S.A. |
| Forecast Period | 2026 to 2036. |
| Approach | Hybrid bottom-up and top-down market sizing supported by primary interviews and official desk research. |
Platinum Group Metals PGM Market - Research Methodology
| Method | Approach |
|---|---|
| Primary Research | FMI analysts gathered input from manufacturers, service providers, technology developers, distributors, end users, procurement teams, and subject-matter experts. Interviews examined purchasing decisions, product or service evaluation, adoption barriers, approval requirements, pricing considerations, and expectations for technical or commercial support. Respondents were also asked what evidence is required before a trial, pilot, or initial order develops into regular purchasing. |
| Desk Research | Desk research covered government statistics, regulatory publications, trade data, industry associations, technical literature, standards, company filings, product information, and official corporate announcements. Sources were reviewed for relevance, publication date, geographic coverage, and consistency with the defined market scope. Claims relating to performance, applications, approvals, capacity, investment, and commercial activity were retained only when supported by credible public evidence. |
| Market Sizing and Forecasting | The market model combined the baseline value with historical performance, segment structure, pricing and volume indicators, adoption levels, company participation, and country-level demand conditions. Forecast assumptions considered economic activity, investment trends, regulatory developments, technology adoption, purchasing cycles, supply availability, and barriers to wider market use. Segment and regional estimates were reconciled before the final market total was calculated. |
| Data Validation | Estimates were checked against multiple independent indicators, including public data, company activity, trade patterns, industry developments, and findings from primary interviews. Validation also tested whether products, services, applications, and company revenues fell within the defined market boundaries. Adjacent categories, unsupported claims, overlapping revenues, and activities without direct market relevance were excluded to reduce double counting and maintain consistency across segments and countries. |
Platinum Group Metals PGM Market by Segments
Platinum Group Metals PGM Market segmented by Product Type:
- Platinum
- Primary Platinum
- Recycled Platinum
- Palladium
- Automotive Grade Palladium
- Industrial Grade Palladium
- Rhodium
- Primary Rhodium
- Recovered Rhodium
- Ruthenium
- Chemical Grade Ruthenium
- Electronic Grade Ruthenium
- Iridium & Osmium
- Iridium
- Osmium
Platinum Group Metals PGM Market segmented by Application:
- Automotive Catalysts
- Passenger Vehicles
- Commercial Vehicles
- Industrial Catalysts
- Petrochemical Catalysts
- Chemical Processing
- Jewelry
- Rings
- Necklaces & Ornaments
- Electronics
- Semiconductors
- Electrical Contacts
- Investment & Others
- Bullion
- Coins
Platinum Group Metals PGM Market segmented by End User:
- Automotive Industry
- OEMs
- Aftermarket
- Chemical Industry
- Petrochemicals
- Specialty Chemicals
- Jewelry Industry
- Luxury Jewelry
- Bridal Jewelry
- Electronics Industry
- Consumer Electronics
- Industrial Electronics
- Investment Institutions
- ETFs
- Precious Metal Traders
Platinum Group Metals PGM Market segmented by Distribution Channel:
- Direct Sales
- Long-Term Supply Contracts
- OEM Supply Agreements
- Metal Distributors
- Global Distributors
- Regional Distributors
- Commodity Exchanges
- Spot Trading
- Futures Trading
- Online Trading Platforms
- B2B Platforms
- Digital Bullion Platforms
- Retail Dealers
- Authorized Dealers
- Precious Metal Retailers
Platinum Group Metals PGM Market segmented by Source:
- Primary Mining
- Underground Mining
- Open Pit Mining
- Recycled Sources
- Automotive Catalyst Recycling
- Electronic Scrap Recycling
- By-product Recovery
- Nickel Mining
- Copper Mining
Platinum Group Metals PGM Market by Region:
- North America
- United States
- Canada
- Latin America
- Brazil
- Mexico
- Argentina
- Chile
- Western Europe
- Germany
- France
- United Kingdom
- Italy
- Spain
- Benelux
- Nordics
- Eastern Europe
- Poland
- Czech Republic
- Romania
- Hungary
- East Asia
- China
- Japan
- South Korea
- South Asia and Pacific
- India
- ASEAN
- Australia and New Zealand
- Middle East and Africa
- GCC Countries
- South Africa
- Türkiye
- Israel
Research Sources and Bibliography
- Johnson Matthey Plc. (2026, May 14).
- Valterra Platinum Limited. (2026, April 23).
- Valterra Platinum Limited. (2026, February 25).
- Valterra Platinum Limited. (2026, February 5).
- Umicore. (2026, April 30).
- Umicore. (2026, February 20).
- Johnson Matthey Plc. (2026, June 10).
- USA Geological Survey. (2026, February 6).
- Society of Motor Manufacturers and Traders. (2026, April 24)
- World Platinum Investment Council. (2026, May 18).
- Johnson Matthey Plc. (2026, March 4).
- Geoscience Australia. (2025, December 10).
- USA Geological Survey. (2026, February 13).
- Ministry of Economy, Trade and Industry. (2025, May 19).
- Ministry of Climate, Energy and Environment. (2026, January 4).
- Federal Statistical Office of Germany. (2026, July 22).
- Natural Resources Canada. (2026, January 29).
- Department for Business and Trade. (2025, November 22).
- Impala Platinum Holdings Limited. (2026, March 5).
- Johnson Matthey Plc. (2026, May 28)
- Heraeus Precious Metals. (2026, July 1).
- Nornickel. (2026, January 28).
- Vale. (2026, January 27).
- Valterra Platinum Limited. (2025, June 3).
- Sibanye-Stillwater. (2025, September 9).
- Johnson Matthey Plc. (2026, February 10).
- Northam Platinum Holdings Limited. (2026, July 13).
This bibliography is provided for reader reference and is not exhaustive. The full report contains the complete reference list and detailed citations.
This Report Answers
- How large is the Platinum Group Metals PGM market in 2026 and 2036?
- Which operating mechanisms sustain recurring demand for platinum-group metals?
- Why does platinum hold the selected product type share during 2026?
- How do automotive catalysts influence application demand and changing metal mix?
- Why does primary mining retain most source allocation despite expanding recycling?
- How do commercial conditions differ across the seven profiled country markets?
- Which companies combine mining with refining or customer metal services?
- What supply concentration and substitution risks can weaken market returns?
- How can qualified recovery routes broaden usable secondary PGM supply?
Frequently Asked Questions
How big is the Platinum Group Metals PGM Market in 2026?
The platinum group metals PGM market is valued at USD 36.8 billion in 2026 and is forecast to reach USD 58.8 billion by 2036, reflecting steady demand across automotive catalyst programs and emerging clean-energy applications even as concentrated mine supply influences metal availability and pricing.
What is the CAGR of the Platinum Group Metals PGM Market from 2026 to 2036?
The platinum group metals PGM market is projected to grow at a CAGR of 4.8% between 2026 and 2036, supported by established automotive and industrial catalyst programs that require repeat metal supply through qualified formulations and planned replacement cycles.
Which application leads the Platinum Group Metals PGM Market?
Automotive catalysts account for 42.0% of the platinum group metals PGM market by application in 2026, driven by mandatory exhaust treatment requirements across combustion and hybrid vehicle fleets that sustain recurring demand for qualified platinum, palladium, and rhodium formulations.
Which country is growing fastest in the Platinum Group Metals PGM Market?
The platinum group metals PGM market in Australia is projected to expand at a CAGR of 6.2% through 2036, ahead of the USA at 5.8%, Japan at 5.3%, South Korea at 4.8%, Germany at 4.3%, Canada at 3.8%, and the UK at 3.4%, reflecting by-product recovery potential and a substantial undeveloped resource base across nickel and copper operations.
Who are the leading companies in the Platinum Group Metals PGM Market?
Leading companies in the platinum group metals PGM market include Valterra Platinum Limited, Impala Platinum Holdings Limited, Sibanye-Stillwater Limited, Northam Platinum Holdings Limited, Johnson Matthey Plc, Heraeus Precious Metals, Nornickel, and Vale S.A., spanning integrated mine production, specialist refining, and customer metal services across automotive and industrial applications.
Preview the report firsthand - request a free sample
Get SampleGet the brochure for pricing and purchase details.
Get PDFTable of Content
- Key Takeaways
- Market Size and CAGR
- Top Growth Driver
- Fastest Growing Segment
- Leading Region
- Key Companies
- Emerging Opportunities
- Executive Summary
- Global Market Outlook
- Demand-side Trends
- Supply-side Trends
- Technology Roadmap Analysis
- Analysis and Recommendations
- Analyst Perspective (What is happening? Why now? What should investors know?)
- Key Questions Answered
- How large is the market?
- What is the CAGR?
- What are key trends?
- Which region dominates?
- Who are the leaders?
- Market Overview
- Market Coverage / Taxonomy
- Market Definition / Scope / Limitations
- Research Methodology
- Chapter Orientation
- Analytical Lens and Working Hypotheses
- Market Structure, Signals, and Trend Drivers
- Benchmarking and Cross-market Comparability
- Market Sizing, Forecasting, and Opportunity Mapping
- Research Design and Evidence Framework
- Desk Research Programme (Secondary Evidence)
- Expert Input and Fieldwork (Primary Evidence)
- Tooling, Models, and Reference Databases
- Data Engineering and Model Build
- Quality Assurance and Audit Trail
- Market Background
- Market Dynamics (Drivers, Restraints, Opportunity, Trends)
- Scenario Forecast (Optimistic, Likely, Conservative)
- Impact Analysis
- AI Impact
- Sustainability Impact
- Regulatory Impact
- Technology Impact
- Consumer / Buyer Analysis
- Purchase Drivers
- Adoption Barriers
- Buyer Journey
- Opportunity Map Analysis
- Product Life Cycle Analysis
- Supply Chain Analysis
- Investment Feasibility Matrix
- Value Chain Analysis
- PESTLE and Porter's Analysis
- Regulatory Landscape
- Regional Parent Market Outlook
- Production and Consumption Statistics
- Import and Export Statistics
- Global Market Analysis and Forecast, 2021 to 2036
- Historical Market Size Value (USD Billion) Analysis, 2021 to 2025
- Current and Future Market Size Value (USD Billion) Projections, 2026 to 2036
- Y-o-Y Growth Trend Analysis
- Absolute $ Opportunity Analysis
- Global Market Pricing Analysis, 2021 to 2036
- Global Market Analysis and Forecast, By Product Type, 2021 to 2036
- Introduction / Key Findings
- Historical Market Size Value (USD Billion) Analysis By Product Type, 2021 to 2025
- Current and Future Market Size Value (USD Billion) Analysis and Forecast By Product Type, 2026 to 2036
- Platinum
- Primary Platinum
- Recycled Platinum
- Palladium
- Automotive Grade Palladium
- Industrial Grade Palladium
- Rhodium
- Primary Rhodium
- Recovered Rhodium
- Ruthenium
- Chemical Grade Ruthenium
- Electronic Grade Ruthenium
- Iridium & Osmium
- Iridium
- Osmium
- Platinum
- Y-o-Y Growth Trend Analysis By Product Type, 2021 to 2025
- Absolute $ Opportunity Analysis By Product Type, 2026 to 2036
- Global Market Analysis and Forecast, By Application, 2021 to 2036
- Introduction / Key Findings
- Historical Market Size Value (USD Billion) Analysis By Application, 2021 to 2025
- Current and Future Market Size Value (USD Billion) Analysis and Forecast By Application, 2026 to 2036
- Automotive Catalysts
- Passenger Vehicles
- Commercial Vehicles
- Industrial Catalysts
- Petrochemical Catalysts
- Chemical Processing
- Jewelry
- Rings
- Necklaces & Ornaments
- Electronics
- Semiconductors
- Electrical Contacts
- Investment & Others
- Bullion
- Coins
- Automotive Catalysts
- Y-o-Y Growth Trend Analysis By Application, 2021 to 2025
- Absolute $ Opportunity Analysis By Application, 2026 to 2036
- Global Market Analysis and Forecast, By End User, 2021 to 2036
- Introduction / Key Findings
- Historical Market Size Value (USD Billion) Analysis By End User, 2021 to 2025
- Current and Future Market Size Value (USD Billion) Analysis and Forecast By End User, 2026 to 2036
- Automotive Industry
- OEMs
- Aftermarket
- Chemical Industry
- Petrochemicals
- Specialty Chemicals
- Jewelry Industry
- Luxury Jewelry
- Bridal Jewelry
- Electronics Industry
- Consumer Electronics
- Industrial Electronics
- Investment Institutions
- ETFs
- Precious Metal Traders
- Automotive Industry
- Y-o-Y Growth Trend Analysis By End User, 2021 to 2025
- Absolute $ Opportunity Analysis By End User, 2026 to 2036
- Global Market Analysis and Forecast, By Distribution Channel, 2021 to 2036
- Introduction / Key Findings
- Historical Market Size Value (USD Billion) Analysis By Distribution Channel, 2021 to 2025
- Current and Future Market Size Value (USD Billion) Analysis and Forecast By Distribution Channel, 2026 to 2036
- Direct Sales
- Long-Term Supply Contracts
- OEM Supply Agreements
- Metal Distributors
- Global Distributors
- Regional Distributors
- Commodity Exchanges
- Spot Trading
- Futures Trading
- Online Trading Platforms
- B2B Platforms
- Digital Bullion Platforms
- Retail Dealers
- Authorized Dealers
- Precious Metal Retailers
- Direct Sales
- Y-o-Y Growth Trend Analysis By Distribution Channel, 2021 to 2025
- Absolute $ Opportunity Analysis By Distribution Channel, 2026 to 2036
- Global Market Analysis and Forecast, By Source, 2021 to 2036
- Introduction / Key Findings
- Historical Market Size Value (USD Billion) Analysis By Source, 2021 to 2025
- Current and Future Market Size Value (USD Billion) Analysis and Forecast By Source, 2026 to 2036
- Primary Mining
- Underground Mining
- Open Pit Mining
- Recycled Sources
- Automotive Catalyst Recycling
- Electronic Scrap Recycling
- By-product Recovery
- Nickel Mining
- Copper Mining
- Primary Mining
- Y-o-Y Growth Trend Analysis By Source, 2021 to 2025
- Absolute $ Opportunity Analysis By Source, 2026 to 2036
- Global Market Analysis and Forecast, By Region, 2021 to 2036
- Introduction
- Historical Market Size Value (USD Billion) Analysis By Region, 2021 to 2025
- Current Market Size Value (USD Billion) Analysis and Forecast By Region, 2026 to 2036
- North America
- Latin America
- Western Europe
- Eastern Europe
- East Asia
- South Asia and Pacific
- Middle East & Africa
- Market Attractiveness Analysis By Region
- North America Market Analysis and Forecast, By Country, 2021 to 2036
- Historical Market Size Value (USD Billion) Trend Analysis By Market Taxonomy, 2021 to 2025
- Market Size Value (USD Billion) Forecast By Market Taxonomy, 2026 to 2036
- By Country
- USA
- Canada
- By Product Type
- By Application
- By End User
- By Distribution Channel
- By Source
- By Country
- Market Attractiveness Analysis
- By Country
- By Product Type
- By Application
- By End User
- By Distribution Channel
- By Source
- Key Takeaways
- Latin America Market Analysis and Forecast, By Country
- Historical Market Size Value (USD Billion) Trend Analysis By Market Taxonomy, 2021 to 2025
- Market Size Value (USD Billion) Forecast By Market Taxonomy, 2026 to 2036
- By Country
- Brazil
- Mexico
- Chile
- Rest of Latin America
- By Product Type
- By Application
- By End User
- By Distribution Channel
- By Source
- By Country
- Market Attractiveness Analysis
- By Country
- By Product Type
- By Application
- By End User
- By Distribution Channel
- By Source
- Key Takeaways
- Western Europe Market Analysis and Forecast, By Country
- Historical Market Size Value (USD Billion) Trend Analysis By Market Taxonomy, 2021 to 2025
- Market Size Value (USD Billion) Forecast By Market Taxonomy, 2026 to 2036
- By Country
- Germany
- UK
- Italy
- Spain
- France
- Nordic
- BENELUX
- Rest of Western Europe
- By Product Type
- By Application
- By End User
- By Distribution Channel
- By Source
- By Country
- Market Attractiveness Analysis
- By Country
- By Product Type
- By Application
- By End User
- By Distribution Channel
- By Source
- Key Takeaways
- Eastern Europe Market Analysis and Forecast, By Country
- Historical Market Size Value (USD Billion) Trend Analysis By Market Taxonomy, 2021 to 2025
- Market Size Value (USD Billion) Forecast By Market Taxonomy, 2026 to 2036
- By Country
- Russia
- Poland
- Hungary
- Balkan & Baltic
- Rest of Eastern Europe
- By Product Type
- By Application
- By End User
- By Distribution Channel
- By Source
- By Country
- Market Attractiveness Analysis
- By Country
- By Product Type
- By Application
- By End User
- By Distribution Channel
- By Source
- Key Takeaways
- East Asia Market Analysis and Forecast, By Country
- Historical Market Size Value (USD Billion) Trend Analysis By Market Taxonomy, 2021 to 2025
- Market Size Value (USD Billion) Forecast By Market Taxonomy, 2026 to 2036
- By Country
- China
- Japan
- South Korea
- By Product Type
- By Application
- By End User
- By Distribution Channel
- By Source
- By Country
- Market Attractiveness Analysis
- By Country
- By Product Type
- By Application
- By End User
- By Distribution Channel
- By Source
- Key Takeaways
- South Asia and Pacific Market Analysis and Forecast, By Country
- Historical Market Size Value (USD Billion) Trend Analysis By Market Taxonomy, 2021 to 2025
- Market Size Value (USD Billion) Forecast By Market Taxonomy, 2026 to 2036
- By Country
- India
- ASEAN
- Australia & New Zealand
- Rest of South Asia and Pacific
- By Product Type
- By Application
- By End User
- By Distribution Channel
- By Source
- By Country
- Market Attractiveness Analysis
- By Country
- By Product Type
- By Application
- By End User
- By Distribution Channel
- By Source
- Key Takeaways
- Middle East & Africa Market Analysis and Forecast, By Country
- Historical Market Size Value (USD Billion) Trend Analysis By Market Taxonomy, 2021 to 2025
- Market Size Value (USD Billion) Forecast By Market Taxonomy, 2026 to 2036
- By Country
- Kingdom of Saudi Arabia
- Other GCC Countries
- Türkiye
- South Africa
- Other African Union
- Rest of Middle East & Africa
- By Product Type
- By Application
- By End User
- By Distribution Channel
- By Source
- By Country
- Market Attractiveness Analysis
- By Country
- By Product Type
- By Application
- By End User
- By Distribution Channel
- By Source
- Key Takeaways
- Key Countries Market Analysis
- USA
- Pricing Analysis
- Market Share Analysis, 2025
- By Product Type
- By Application
- By End User
- By Distribution Channel
- By Source
- Canada
- Pricing Analysis
- Market Share Analysis, 2025
- By Product Type
- By Application
- By End User
- By Distribution Channel
- By Source
- Mexico
- Pricing Analysis
- Market Share Analysis, 2025
- By Product Type
- By Application
- By End User
- By Distribution Channel
- By Source
- Brazil
- Pricing Analysis
- Market Share Analysis, 2025
- By Product Type
- By Application
- By End User
- By Distribution Channel
- By Source
- Chile
- Pricing Analysis
- Market Share Analysis, 2025
- By Product Type
- By Application
- By End User
- By Distribution Channel
- By Source
- Germany
- Pricing Analysis
- Market Share Analysis, 2025
- By Product Type
- By Application
- By End User
- By Distribution Channel
- By Source
- UK
- Pricing Analysis
- Market Share Analysis, 2025
- By Product Type
- By Application
- By End User
- By Distribution Channel
- By Source
- Italy
- Pricing Analysis
- Market Share Analysis, 2025
- By Product Type
- By Application
- By End User
- By Distribution Channel
- By Source
- Spain
- Pricing Analysis
- Market Share Analysis, 2025
- By Product Type
- By Application
- By End User
- By Distribution Channel
- By Source
- France
- Pricing Analysis
- Market Share Analysis, 2025
- By Product Type
- By Application
- By End User
- By Distribution Channel
- By Source
- India
- Pricing Analysis
- Market Share Analysis, 2025
- By Product Type
- By Application
- By End User
- By Distribution Channel
- By Source
- ASEAN
- Pricing Analysis
- Market Share Analysis, 2025
- By Product Type
- By Application
- By End User
- By Distribution Channel
- By Source
- Australia & New Zealand
- Pricing Analysis
- Market Share Analysis, 2025
- By Product Type
- By Application
- By End User
- By Distribution Channel
- By Source
- China
- Pricing Analysis
- Market Share Analysis, 2025
- By Product Type
- By Application
- By End User
- By Distribution Channel
- By Source
- Japan
- Pricing Analysis
- Market Share Analysis, 2025
- By Product Type
- By Application
- By End User
- By Distribution Channel
- By Source
- South Korea
- Pricing Analysis
- Market Share Analysis, 2025
- By Product Type
- By Application
- By End User
- By Distribution Channel
- By Source
- Russia
- Pricing Analysis
- Market Share Analysis, 2025
- By Product Type
- By Application
- By End User
- By Distribution Channel
- By Source
- Poland
- Pricing Analysis
- Market Share Analysis, 2025
- By Product Type
- By Application
- By End User
- By Distribution Channel
- By Source
- Hungary
- Pricing Analysis
- Market Share Analysis, 2025
- By Product Type
- By Application
- By End User
- By Distribution Channel
- By Source
- Kingdom of Saudi Arabia
- Pricing Analysis
- Market Share Analysis, 2025
- By Product Type
- By Application
- By End User
- By Distribution Channel
- By Source
- Türkiye
- Pricing Analysis
- Market Share Analysis, 2025
- By Product Type
- By Application
- By End User
- By Distribution Channel
- By Source
- South Africa
- Pricing Analysis
- Market Share Analysis, 2025
- By Product Type
- By Application
- By End User
- By Distribution Channel
- By Source
- USA
- Market Structure Analysis
- Competition Dashboard
- Competition Benchmarking
- Market Share Analysis of Top Players
- By Regional
- By Product Type
- By Application
- By End User
- By Distribution Channel
- By Source
- Emerging Startups
- Innovation Benchmarking
- Competition Analysis
- Competition Deep Dive
- Anglo American Platinum
- Overview
- Product Portfolio
- Profitability by Market Segments
- Sales Footprint
- Strategy Overview
- Marketing Strategy
- Product Strategy
- Channel Strategy
- Impala Platinum Holdings (Implats)
- Sibanye-Stillwater
- Northam Platinum
- Johnson Matthey
- Heraeus Holding
- Vale S.A.
- Norilsk Nickel
- Glencore plc
- Eastern Platinum Limited
- Anglo American Platinum
- Case Studies
- Success Stories
- Recent Developments
- Competition Deep Dive
- Assumptions & Acronyms Used


