
- Market Size (2026)
- USD 972.0 Mn
- Forecast (2036)
- USD 2003.3 Mn
- CAGR (2026 to 2036)
- 7.5%
How big is the Polyaryletherketone (PAEK) Market in 2026?
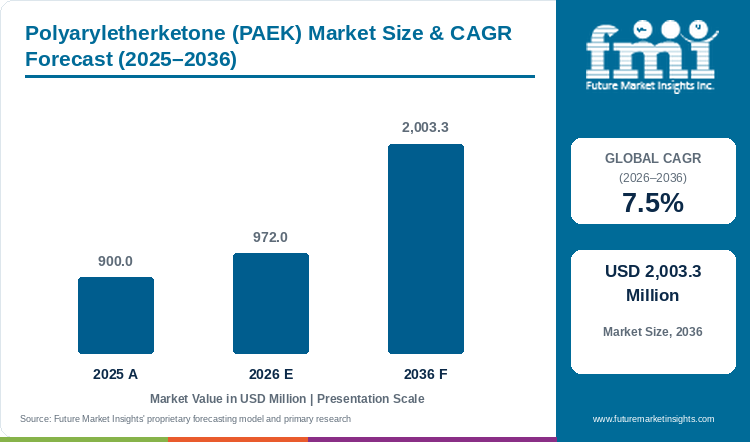
FMI expects the global polyaryletherketone market to reach USD 2,003.3 million by 2036 at a 7.5% CAGR from 2026. The market was valued at USD 900.0 million in 2025. FMI estimates USD 972.0 million for 2026.
Polyaryletherketone (PAEK) Market Size and Forecast
Table 1: Polyaryletherketone (PAEK) Market Size and Forecast
| Market size and forecast | Value |
|---|---|
| Market size in 2025 | USD 900.0 million |
| Estimated market size in 2026 | USD 972.0 million |
| Projected market size by 2036 | USD 2,003.3 million |
| CAGR from 2026 to 2036 | 7.5% |
Source: Future Market Insights analysis of the polyaryletherketone (PAEK) market, 2026.
Qualified processing capacity matters more to this market than announced polymer nameplate capacity. Victrex disclosed in May 2026 that a final manufacturing stage at Panjin could not deliver the plant's full intended 1,500-tonne capacity. It recorded a GBP 60.6 million impairment while continuing to support domestic Chinese supply.
Shipments show how volume demand behaves. The same producer's 2025 volume rose 11.6% to 4,164 tonnes while its average selling price fell from GBP 78.0 to GBP 70.0 per kilogram. Asia-Pacific volume grew 11.0% against 8.0% in Europe. Value added resellers convert polymer into stock shapes for machine shops and accounted for 43.0% of that volume. Per-unit content remains small at about 11 grams of PEEK in a car and about 0.5 tonne in an aircraft, against more than 200 grams and more than 5 tonnes possible on 800-volt platforms and in thermoplastic wing structures.
Key Market Trends & Insights
- Specialised forms are growing faster than neat resin. FMI projects Powder and Filament at 11.7% a year against 6.2% for Neat Resin. Oxford Performance Materials shows the pattern by pairing proprietary PEKK material with additive manufacturing platforms.
- Medical demand is uneven across applications. One PEEK producer reported spine revenue down 28.0% in its 2025 financial year while non-spine medical revenue rose 7.0%. Medical growth therefore depends on application mix, not on the segment as a whole.
- Semiconductor tool makers specify PAEK on contamination limits. Ionic contamination, particle shedding and outgassing are the stated concerns for wafer-contact parts. That narrows qualification to grades with documented purity, as Ensinger sets out for its semiconductor components.
Regional Highlights
- Asia-Pacific is gaining share of global revenue. FMI projects China rising from 22.0% to 26.4% by 2036, India from 3.0% to 3.8% and South Korea from 5.0% to 5.2%. Evonik opened a PEEK wire-coating laboratory in Shanghai in April 2026 to serve electric-drive supply chains in China and wider Asia.
- Established markets add revenue but lose share. The United States moves from 21.0% to 20.0% of global revenue, Japan from 8.0% to 6.9% and Germany from 11.0% to 9.5% over the same period. Ensinger operates facilities or commercial operations in Germany, France and Italy. European component makers therefore have local access to converted PEEK.
Analyst Perspective
“PAEK suppliers will win sustained business through repeatable processing and application evidence. Polymer capacity has limited commercial value until the output meets a customer's approved specification. The strongest opportunities connect a suitable resin with the converter's actual route: semiconductor stock-shape machining, motor-wire coating or thermoplastic aircraft structures. Buyers should compare the cost of a qualified component and its production yield alongside the resin quotation.”
- Nikhil Kaitwade, Principal Consultant, FMI
How is the Polyaryletherketone (PAEK) Market segmented?
- By type: PEEK, PEKK, and PEK and Other PAEK.
- By form: Neat Resin, Filled and Reinforced Compounds, and Powder and Filament.
- By end use: Aerospace and Defense, Medical and Dental, Automotive, Oil and Gas, Electrical and Electronics, and Other.
- By region: North America, Western Europe, East Asia, South Asia, and Rest of world.
Why does the PEEK segment lead by Type in the Polyaryletherketone (PAEK) Market in 2026?
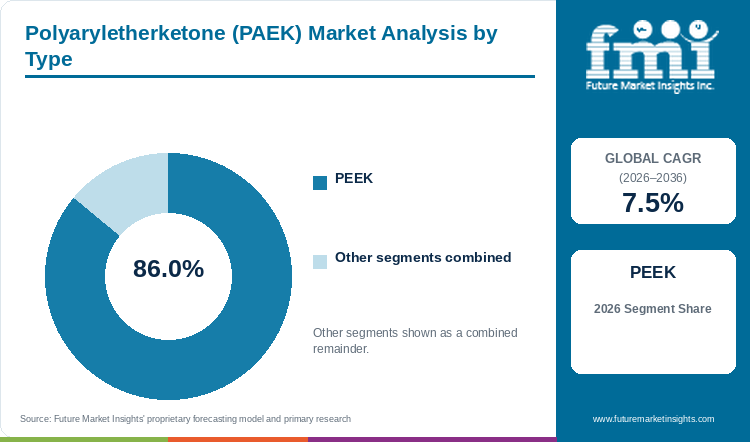
The PEEK segment holds 86.0% of the Polyaryletherketone (PAEK) Market by type in 2026.
PEEK holds this position because suppliers sell it in neat, reinforced and powder grades. One polymer family therefore serves molders, extruders and coaters. Syensqo lists glass-fiber and carbon-fiber compounds alongside neat and powder KetaSpire grades. Once a grade is qualified in a component, a supplier change needs new approval. That keeps repeat orders with the incumbent.
Medical buyers show the same pattern. Evonik documents mold design, machining guidance and approval support for VESTAKEEP PEEK. A device maker that has completed that work has little reason to reopen the grade choice. Melt flow and reinforcement also set a converter's process window. A low-viscosity molding grade is therefore not a drop-in replacement for a powder selected for coating.
FMI projects PEEK revenue at USD 1,695.8 million in 2036 and a type share easing to 84.6% as PEKK grows faster at 9.6% a year. PEKK supply is building from a smaller base, since Arkema's Kepstan business now sits inside its High Performance Polymers segment and a world-scale US unit started up in Mobile in 2019.
PEKK and PEK and Other PAEK together hold the remaining 14.0% by type.
Table 2: Type, 2026 Share
| Leading Share | 2026 market share |
|---|---|
| PEEK | 86.0% |
| All Other Segments Combined Share | 14.0% |
Source: Future Market Insights analysis of the polyaryletherketone (PAEK) market, 2026.
Why does the Neat Resin segment lead by Form in the Polyaryletherketone (PAEK) Market in 2026?
The Neat Resin segment holds 52.0% of the Polyaryletherketone (PAEK) Market by form in 2026.
Neat resin is the starting material for compounds, stock shapes and filament, so converters buy it before adding reinforcement or machining it.
Supply contracts for neat material specify viscosity and permitted processing history. A change of feedstock grade changes machining and molding behavior. Converters with approved process conditions therefore tend to stay with a qualified lot, and grade consistency becomes a purchasing criterion alongside price.
FMI projects Neat Resin to grow from USD 505.4 million in 2026 to USD 919.8 million in 2036, a 6.2% CAGR. Filled and Reinforced Compounds grow at 7.7% and Powder and Filament at 11.7% because coating, printing and compounding applications need a tailored feedstock.
Filled and Reinforced Compounds and Powder and Filament together hold the remaining 48.0% by form.
Table 3: Form, 2026 Share
| Leading Share | 2026 market share |
|---|---|
| Neat Resin | 52.0% |
| All Other Segments Combined Share | 48.0% |
Source: Future Market Insights analysis of the polyaryletherketone (PAEK) market, 2026.
Why does the Aerospace and Defense segment lead by End Use in the Polyaryletherketone (PAEK) Market in 2026?
The Aerospace and Defense segment holds 24.0% of the Polyaryletherketone (PAEK) Market by end use in 2026.
Aerospace buyers qualify the material, the part and the production process together. A polymer therefore gains business only when the manufacturing route is proven. The Arkema and Hexcel emergency-exit-door demonstrator combined carbon-fiber PEKK tape with PEKK injection-molding compounds and reported a forming and overmolding cycle below two minutes. Cycle time governs unit cost in composite structures, so a sub-two-minute result speaks directly to production rate.
Thermoplastic composites entering wing and fuselage structures would multiply resin content per aircraft, with the longer-term case at ten times today's level. That depends on each component passing qualification, so revenue follows approved designs and build schedules.
FMI projects Aerospace and Defense revenue of USD 532.3 million by 2036 at an 8.6% CAGR. That lifts its end-use share to 26.6%. Defense and civil-aircraft programs are grouped for valuation, although their purchasing schedules differ. Competing lightweight materials are covered in FMI's automotive composites market, where component production economics also shape polymer adoption.
The five remaining end uses together hold the other 76.0%.
Table 4: End Use, 2026 Share
| Leading Share | 2026 market share |
|---|---|
| Aerospace and Defense | 24.0% |
| All Other Segments Combined Share | 76.0% |
Source: Future Market Insights analysis of the polyaryletherketone (PAEK) market, 2026.
What are the key drivers restraints and opportunities?
Application qualification supports PAEK expansion. Production bottlenecks and costly process changes constrain conversion, while specialized compounds and new delivery forms create additional supplier opportunities.
Driver
Approved applications create repeat purchases of a specific resin grade and form. Medical supply and semiconductor conversion illustrate why documented material consistency matters.
Restraint
Price competition limits revenue growth. Chinese producers are widening their grade ranges, as Jilin Joinature's September 2026 launch of its 700G grade shows. More local choice adds pressure on export prices.
Opportunity
Specialised forms offer the clearest opportunity. Powder for coating and printing, dental machining stock and thermoplastic structures each need a distinct grade and process support.
How do purchasing rules and qualification affect polyaryletherketone (PAEK) market demand?
PAEK growth comes from several qualification cycles that progress at different speeds. A motor-wire project must establish a reliable coating process before recurring powder orders follow. A medical-device project must resolve the particular product's design and regulatory requirements. A structural composite needs repeatable forming as well as suitable material properties.
Suppliers with a clear division between general industrial grades and application-specific support retain more of a project's development work.
What limits reliable polyaryletherketone (PAEK) market supply and quality?
The key supply risk is not limited to a shortage of reactors. Consistency through washing, filtration, compounding and conversion determines whether material can enter a particular customer program. BIEGLO's description of Panjin Zhongrun emphasizes washing and melt filtration in its CoPEEK supply. Such steps matter when visual contamination or processing defects would cause part rejection.
The market also competes against other engineering polymers and metals at component level. A simpler duty may not justify the resin cost or the equipment needed to process it. This makes new application work selective. Suppliers need to demonstrate an operating or production benefit in the actual component and preserve it across routine batches. Commercial growth is vulnerable when a successful prototype cannot be reproduced economically. Buyers weighing PAEK against polyamides and other resins can set that choice within the broader engineering plastics market.
Where can suppliers win additional business in the polyaryletherketone (PAEK) market?
The form outlook provides the clearest quantitative signal of product differentiation. Powder and Filament revenue rises from USD 116.6 million in 2026 to USD 351.2 million by 2036. This is a smaller base than Neat Resin, but a faster-growing one. A powder designed for coating and a filament selected for a printing process should remain distinct commercial offers.
Electronic applications create another route. Conductivity, purity and dimensional behavior need to match the part's function. The relevant comparison can include both insulating materials and products in FMI's conductive plastics market.
Polyaryletherketone (PAEK) Market by Country (2026 to 2036)
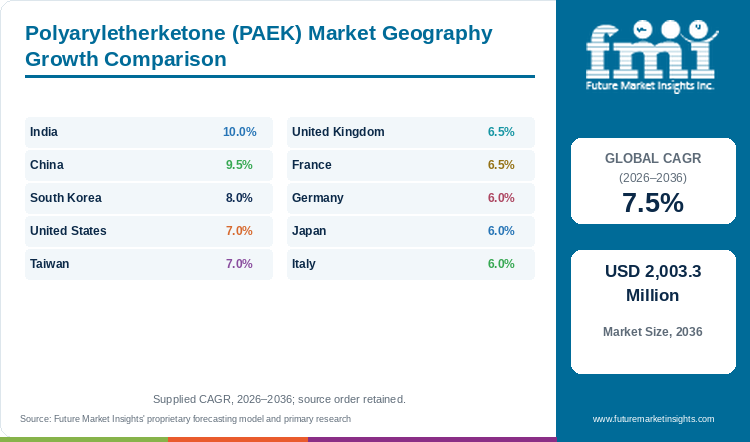
Table 5: Polyaryletherketone (PAEK) Market Country Growth Forecast
| Country | CAGR, 2026 to 2036 |
|---|---|
| India | 10.0% |
| China | 9.5% |
| South Korea | 8.0% |
| United States | 7.0% |
| Taiwan | 7.0% |
| United Kingdom | 6.5% |
| France | 6.5% |
| Germany | 6.0% |
| Japan | 6.0% |
| Italy | 6.0% |
Source: Future Market Insights analysis of the polyaryletherketone (PAEK) market, 2026.
India
India's PAEK opportunity includes an existing base-resin manufacturing role. The KetaSpire producer lists Panoli in Gujarat as a PEEK production location. Syensqo's separate September 2026 announcement of new aromatic-polymer compounding investment at Panoli describes a line planned for the first quarter of 2028. The planned capability includes PEEK alongside other aromatic polymers.
FMI forecasts Indian market revenue of USD 29.2 million in 2026 and USD 75.4 million by 2036. The 10.0% CAGR for 2026 to 2036 is the fastest among the named countries and lifts India's global share from 3.0% to 3.8%. Part of India's faster growth reflects its smaller starting base against China and the United States. The market adds USD 46.2 million over the decade, and 2036 revenue reaches about 2.6 times the 2026 figure. India ties with Taiwan as the smallest named country by 2026 revenue.
Local compounding changes the sourcing model for Indian converters, because compounded grades can come from inside the country instead of arriving as imported stock. Shorter lead times also lower the inventory a converter holds against an approved grade. Customers must approve each grade after start-up, so most of the revenue effect should arrive in the second half of the forecast period. Suppliers that qualify early gain recurring orders because buyers rarely reopen an approved grade. The forecast covers demand consumed in India and excludes exports from Indian plants.
China
China combines the largest national valuation with a more competitive local supply base. FMI estimates revenue at USD 213.8 million in 2026 and USD 528.0 million in 2036. The 9.5% forecast CAGR during 2026 to 2036 accompanies an increase in global revenue share from 22.0% to 26.4%. Domestic producers therefore compete directly with imported grades.
Qualification decides whether a Chinese customer switches to a domestic grade, because buyers need each batch to perform consistently in their approved process. The forecast adds USD 314.2 million over the decade, more than any other named country, so the contest for local share involves the largest absolute increase in the report. China is also the only named country whose global share rises by more than one percentage point.
Chinese competitors are also developing their product offers. Jilin Joinature's ZYPEEK website lists a September 2026 launch of its 700G grade and maintains separate application categories for medical, electronics and additive manufacturing. Local launches give Chinese converters a second source for qualification trials and give buyers more bargaining strength in price discussions. Each new design restarts the supplier choice, which is where a domestic grade can enter. For exporters, protecting an existing specification is different from competing for a newly designed component. The former depends on continuity, while the latter leaves more room for a local alternative.
South Korea
Semiconductor equipment provides a concrete commercial route for high-purity PAEK in South Korea. A SEMICON Korea 2026 listing identifies PEEK among materials offered for CMP retaining rings and describes an Asian service network that includes South Korea. Retaining rings hold the wafer during polishing and wear in service, so purity and wear life set replacement cycles and with them repeat demand.
South Korean PAEK revenue is projected at USD 48.6 million in 2026 and USD 104.5 million in 2036. The 8.0% CAGR over 2026 to 2036 exceeds the global rate of 7.5% and lifts the country's global share from 5.0% to 5.2%. The market adds USD 55.9 million over the decade, ahead of the United Kingdom and India. Orders follow tool qualification and production activity at local component and equipment programs.
Samsung's management-committee disclosures list memory and foundry investment decisions during 2025 and 2026. These decisions indicate an active downstream capital cycle. Only selected equipment parts use PAEK materials, so capital spending lifts demand for a narrow set of grades. For a polymer or stock-shape supplier, the commercial task is to establish processing and purity evidence before procurement. Local technical contact helps with that work, although the specification still determines the acceptable material. The resulting opportunity sits in specific applications and service relationships.
United States
The United States supports both base-polymer supply and specialized PEKK conversion. The KetaSpire producer lists Augusta in Georgia as one of its PEEK production locations. Oxford Performance Materials offers proprietary OXPEKK material and additive manufacturing platforms from the United States. Those businesses occupy different positions. A polymer maker supplies conversion customers, while a device or component producer may sell a much more finished product. US converters therefore have domestic access to base polymer, so buying questions turn on grade and approval.
FMI forecasts national PAEK revenue of USD 204.1 million in 2026 and USD 400.0 million in 2036, at a 7.0% CAGR from 2026 to 2036. The increase of USD 195.9 million is the second largest in the report after China, while the US share of global revenue slips from 21.0% to 20.0% as Asian demand grows faster. The valuation covers resin and compound forms only, so it sits well below the sale price of a personalized implant or an aircraft component.
Medical applications depend on each product's regulatory status. OPM's custom-device instructions specify an individual patient and the physician's prescription, describe a custom-device exemption and state that FDA has not determined that device's safety or efficacy. Material suppliers therefore earn repeat revenue from clearly defined device and industrial routes. Each actual product needs its own controlled manufacturing.
Taiwan
Taiwan's semiconductor production creates a focused application environment for high-performance plastic components. TSMC's 2025 annual report describes preparations for several phases of 2 nm fabs in Hsinchu and Kaohsiung, together with continued leading-edge and advanced-packaging investment in Taiwan. Each fab phase adds wafer-handling and chemical-contact equipment. These are the parts where high-purity polymers compete with ceramics and metals. Parts orders follow the installation schedule of new tools. The fab phases in the annual report set that schedule, so qualified parts are ordered in waves.
FMI forecasts Taiwan PAEK revenue of USD 29.2 million in 2026 and USD 57.2 million in 2036. The CAGR for 2026 to 2036 is 7.0%. Although national revenue almost doubles, Taiwan's global share changes from 3.0% to 2.9%. Growth in this market therefore remains positive while other countries expand faster. The market adds USD 28.0 million over the decade, the smallest increase among the named countries. Taiwan matches the United States on growth at 7.0% a year but starts from a base about one seventh the size.
For component suppliers, the relevant route is through the semiconductor tool or part specification. The supplier must demonstrate the appropriate material grade and controlled conversion route. PAEK is one material option within a larger equipment supply chain, and its opportunity depends on the selected component and operating conditions.
United Kingdom
The United Kingdom is important as a polymer supply base, but domestic demand is a separate measure. A PEEK producer identifies manufacturing and research operations in the country, including its Thornton Cleveleys headquarters and other UK facilities. Much of this output is exported. UK demand is therefore smaller than UK production.
FMI projects UK PAEK demand of USD 58.3 million in 2026 and USD 109.1 million by 2036. The forecast CAGR is 6.5% from 2026 to 2036. The market adds USD 50.8 million over the decade while the country's global share eases from 6.0% to 5.4%. This demand outlook is smaller than the national role in supplying international customers. UK revenue rises 1.9 times over the decade against 2.1 times for the global market. The UK ranks fifth among the named countries by 2026 revenue, after Japan.
UK operations remain the base for a wider network, while the Panjin plant in China addresses part of the customer base. The commercial task for a UK supplier is to keep a clear boundary between standard resin availability and support for a particular end market. Customers with established specifications need continuity. New projects need proof that the selected material can be converted economically. Domestic demand growth is more likely to reflect qualified component activity than the location of a supplier's corporate headquarters.
France
PEKK gives France a distinctive position in the PAEK supplier base. A 2025 universal registration document describes the development of Kepstan and the subsequent integration of the business into High Performance Polymers. It also records the start-up of a world-scale US production unit in Mobile in 2019. The company’s French base therefore coexists with international polymer production.
France is forecast to record USD 48.6 million in PAEK revenue in 2026 and USD 90.9 million in 2036. FMI's 2026 to 2036 CAGR is 6.5%, which adds USD 42.3 million over the decade and eases the country's global share from 5.0% to 4.5%. The outlook covers the same material scope as the global assessment, including PEEK and other PAEK grades.
The most useful commercial question is where a French participant enters the development process. A base-polymer supplier, a composite converter and a component designer can each shape the specification. The resulting resin order depends on how their work is brought together. Offers that make the material and conversion route explicit early in a project reduce the risk of comparing incompatible grades during procurement. They also keep demonstration activity separate from recurring production. Established supply agreements remain important, while new opportunities require a clear component pathway and evidence that the selected process is suitable for the intended duty.
Germany
Germany's commercial position rests on application engineering and downstream conversion as well as resin supply. The new VESTAKEEP dental grades were announced from Darmstadt in October 2026. The company describes compatibility with established CAD/CAM workflows and offers regulatory support to customers pursuing their own MDR registration. An improved machining material can reduce adoption friction, while the customer still owns the requirements of its finished prosthetic product.
National revenue is projected to increase from USD 106.9 million in 2026 to USD 190.8 million in 2036. FMI's 2026 to 2036 CAGR is 6.0%. That base is the third largest among the named countries after China and the United States. The market adds USD 83.9 million over the decade, the third largest increase among the named countries. Its global share eases from 11.0% to 9.5%.
Germany also takes part in the development network behind thermoplastic aircraft structures. The HELUES release identifies German project support and partners including Airbus Helicopters Deutschland. For local suppliers, the opportunity is to secure a role in the actual process specification. For buyers, the relevant comparison is between approved manufacturing routes and their documented output. A lower resin price has limited value if it disrupts an established production cycle or requires extensive requalification. This makes process support a more defensible commercial position than generic claims about polymer performance.
Japan
Established conversion channels shape Japan's PAEK opportunity. The Japanese subsidiary of a conversion specialist says it began operating in 1999 and supplies extruded stock, compounds and filaments alongside other engineering-plastic products. A PEEK producer also lists a Japanese sales and research presence. These channels give component developers access to materials and technical discussion without implying that all polymerization occurs domestically.
FMI assigns Japan a 6.0% CAGR over 2026 to 2036. Revenue moves from USD 77.8 million to USD 138.7 million during that period. The national market grows while its global share declines from 8.0% to 6.9%. That base is the fourth largest among the named countries. The market adds USD 60.9 million over the decade, the fourth largest increase among the named countries.
The commercial priority is the transition from a grade proposal to the customer's established conversion practice. A machined stock shape and a filament have different processing histories. For an existing component, a change in form or producer requires a clear assessment of the consequences for the finished part. Experienced distributors and converters compete through that continuity. New entrants need a specific application case and a reliable local support arrangement. Japan's opportunity consequently lies in selected design wins and improved conversion offers, with growth spread across applications instead of a single national capacity announcement.
Italy
Italy's route to PAEK purchasing is visible in the commercial offer for machined stock. The Italian TECAPEEK natural page identifies the underlying base polymer and lists relevant applications across mechanical engineering, electronics and other industries. This is a conversion-led supply route. The customer can buy a suitable shape for machining without taking responsibility for polymerization or initial stock extrusion.
FMI projects a 6.0% CAGR in Italy from 2026 to 2036. Market revenue rises from USD 38.9 million to USD 69.4 million, which adds USD 30.5 million and eases the country's global share from 4.0% to 3.5%. Italian demand is met through converters, so growth depends on the activity of machine shops and component makers, not on a national resin plant.
The procurement issue is matching the stock shape to the component drawing and the required material identity. A switch in base resin or stock-production route may alter the customer's verification work even if both offers carry a PEEK label. Converters that make those details clear and support the machinist's requirements gain value from documentation and a dependable product range. The appropriate commercial comparison includes material yield and the amount of machining required for the actual part. Stock dimensions and the approved base polymer define the material that enters the next operation. Italy's market opportunity lies in supplying component businesses with those requirements already resolved.
Who are the notable companies in the Polyaryletherketone (PAEK) Market?
Notable companies in the Polyaryletherketone (PAEK) Market include Victrex, Syensqo, Evonik, Arkema and Ensinger.
The company comparison needs to distinguish polymer chemistry from downstream commercial roles. Victrex, Syensqo, Evonik and Arkema each sell PEEK or PEKK as a base polymer, while Ensinger and Oxford Performance Materials convert material into stock shapes and printed devices. Victrex's business covers PEEK and related material forms across several end markets. Syensqo supplies KetaSpire PEEK in neat, reinforced and powder grades. Evonik combines industrial VESTAKEEP offerings with medical support, while Arkema's Kepstan PEKK provides a different PAEK chemistry. The materials overlap in some applications. A common family name does not make their approved specifications interchangeable.
Ensinger converts engineering polymers into forms used by component manufacturers. Panjin Zhongrun supplies PEEK through a documented relationship with BIEGLO. Jilin Joinature markets ZYPEEK grades, and Oxford Performance Materials combines proprietary PEKK with additive-manufacturing platforms. Medical-related material comparisons may also draw on FMI's biopharma plastics market, while the present scope remains PAEK resin and compound forms. Complete device revenue is excluded.
Key Developments in the Polyaryletherketone (PAEK) Market
- In April 2026, Evonik opened its PEEK Rectangular Magnet Wire Lab in China. The laboratory supports powder-based motor-wire coating development and electrical reliability testing.
Key Players in the Polyaryletherketone (PAEK) Market
- Victrex
- Syensqo
- Evonik
- Arkema
- Ensinger
- Panjin Zhongrun High Performance Polymers
- Jilin Joinature Polymer
- Oxford Performance Materials
Polyaryletherketone (PAEK) Market Report Scope
Table 6: Polyaryletherketone (PAEK) Market Report Scope
| Coverage field | Report scope |
|---|---|
| Market definition | Polyaryletherketone resins including PEEK, PEKK and PEK grades sold in the covered forms. |
| Material forms | Neat resin, filled and reinforced compounds, powders and filament. |
| Conversion routes | Molding, extrusion, coating and additive manufacturing. |
| Exclusions | Full finished-part, device and system revenue, and polymers outside the PAEK family. |
| Quantitative Units | USD million |
| End uses | Aerospace and Defense, Medical and Dental, Automotive, Oil and Gas, Electrical and Electronics, and Other. |
| National coverage | China, United States, Germany, Japan, United Kingdom, France, South Korea, Italy, India and Taiwan. |
| Companies covered | Victrex, Syensqo, Evonik, Arkema, Ensinger, Panjin Zhongrun High Performance Polymers, Jilin Joinature Polymer and Oxford Performance Materials. |
Source: Future Market Insights analysis of the polyaryletherketone (PAEK) market, 2026.
Polyaryletherketone (PAEK) Market Research Methodology
FMI's PAEK outlook was assessed alongside original company disclosures and technical documentation. Review checks scope and units, segment totals and country consistency. Competitive analysis distinguishes polymer makers, converters and finished-device businesses. Announced projects and technical demonstrators remain separate from operating production. The valuation excludes complete components and devices.
Polyaryletherketone (PAEK) Market by Segments
Polyaryletherketone (PAEK) Market segmented by Type:
- PEEK
- PEKK
- PEK and Other PAEK
Polyaryletherketone (PAEK) Market segmented by Form:
- Neat Resin
- Filled and Reinforced Compounds
- Powder and Filament
Polyaryletherketone (PAEK) Market segmented by End Use:
- Aerospace and Defense
- Medical and Dental
- Automotive
- Oil and Gas
- Electrical and Electronics
- Other
Polyaryletherketone (PAEK) Market by Region
- North America
- United States
- Western Europe
- Germany
- United Kingdom
- France
- Italy
- East Asia
- China
- Japan
- South Korea
- Taiwan
- South Asia
- India
- Rest of world
Research Sources and Bibliography
- Arkema. (2025, June 18). HELUES project: Arkema and Hexcel highlight thermoplastics breakthrough at Paris Air Show.
- Arkema. (2026). Document d'enregistrement universel 2025.
- BIEGLO. (Accessed 2026, November 9). Panjin Zhongrun: Our partner in PEEK.
- Ensinger. (Accessed 2026, November 9). Semiconductor and electronics manufacturing.
- Ensinger. (Accessed 2026, November 9). TECAPEEK natural: PEEK non caricato. https://www.ensingerplastics.com/it-it/semilavorati/prodotti-semilavorati/peek-tecapeek-natural
- Ensinger. (Accessed 2026, November 9). Locations worldwide. https://www.ensingerplastics.com/en/locations
- Ensinger Japan. (Accessed 2026, November 9). Company profile. https://www.ensingerplastics.com/ja-jp/about-us
- Evonik. (2026, April 29). Evonik opens new PEEK Rectangular Magnet Wire Lab in China. https://www.evonik.com/en/news/press-releases/2026/04/Evonik-opens-new-PEEK-Rectangular-Magnet-Wire-Lab-in-China.html
- Evonik. (2026, October 20). Evonik launches new, stiffer VESTAKEEP PEEK dental grades, widening the possibilities of dental applications for PEEK-based materials. https://www.evonik.com/en/news/press-releases/2026/10/evonik-launches-stiffer-vestakeep-peek-dental-grades.html
- Evonik. (Accessed 2026, November 9). VESTAKEEP PEEK for medical devices: Service and technical support. https://www.evonik.com/en/markets/market_1345345/vestakeep-peek-for-medical-devices/service-and-technical-support.html
- Jilin Joinature Polymer. (Accessed 2026, November 9). ZYPEEK product and application information, including the September 24, 2026 700G announcement. https://www.zypeek.cn/
- Oxford Performance Materials. (Accessed 2026, November 9). Technology: OsteoFab, OXFAB and OXPEKK. https://www.oxfordpm.com/
- Oxford Performance Materials. (Accessed 2026, November 9). Instructions for Use: OsteoFab Custom Device, QMSL-1400 Rev C. https://static1.squarespace.com/static/626ab72aa8041758967353f2/t/666070a79118ef59db5ccdae/1717596328182/QMSL-1400%2BOsteoFab%2BCustom%2BDevice%2BIFU-Rev_C.PDF
- Samsung Electronics. (Accessed 2026, November 9). Management Committee: Activities in 2025 and 2026. https://www.samsung.com/sec/ir/governance-csr/board-committee/mgnt/
- SEMI. (2026). SEMICON Korea 2026: Ensinger exhibitor profile. https://expo.semi.org/korea2026/Public/eBooth.aspx?BoothID=633891&IndexInList=120&ListByBooth=true&Nav=False
- Syensqo. (Accessed 2026, November 9). KetaSpire PEEK: Frequently asked questions. https://www.syensqo.com/en/brands/ketaspire-peek/faq
- Syensqo. (2026, September 3). Syensqo brings aromatic compounding capability to India. https://www.syensqo.com/en/press-release/syensqo-brings-aromatic-compounding-capability-to-india
- Taiwan Semiconductor Manufacturing Company. (2026). 2025 Annual Report. https://investor.tsmc.com/static/annualReports/2025/english/index.html
- Victrex. (Accessed 2026, November 9). Regional contacts. https://www.victrex.com/en/contact-us/regional-contacts
- Victrex plc. (2025, December). Annual Report 2025. https://wp-victrexplc-2020.s3.eu-west-2.amazonaws.com/media/2025/12/Victrex-plc-Annual-Report-2025.pdf
- Victrex plc. (2026, May 11). Interim results 2026. https://www.victrexplc.com/media/dm1ceq1e/victrex-plc-interim-results-announcement-h1-26-final-110526.pdf
Table of Content
- Key Takeaways
- Market Size and CAGR
- Top Growth Driver
- Fastest Growing Segment
- Leading Region
- Key Companies
- Emerging Opportunities
- Executive Summary
- Global Market Outlook
- Demand-side Trends
- Supply-side Trends
- Technology Roadmap Analysis
- Analysis and Recommendations
- Analyst Perspective (What is happening? Why now? What should investors know?)
- Key Questions Answered
- How large is the market?
- What is the CAGR?
- What are key trends?
- Which region dominates?
- Who are the leaders?
Read More...
- Market Overview
- Market Coverage / Taxonomy
- Market Definition / Scope / Limitations
- Research Methodology
- Chapter Orientation
- Analytical Lens and Working Hypotheses
- Market Structure, Signals, and Trend Drivers
- Benchmarking and Cross-market Comparability
- Market Sizing, Forecasting, and Opportunity Mapping
- Research Design and Evidence Framework
- Desk Research Programme (Secondary Evidence)
- Expert Input and Fieldwork (Primary Evidence)
- Tooling, Models, and Reference Databases
- Data Engineering and Model Build
- Quality Assurance and Audit Trail
- Market Background
- Market Dynamics (Drivers, Restraints, Opportunity, Trends)
- Scenario Forecast (Optimistic, Likely, Conservative)
- Impact Analysis
- AI Impact
- Sustainability Impact
- Regulatory Impact
- Technology Impact
- Consumer / Buyer Analysis
- Purchase Drivers
- Adoption Barriers
- Buyer Journey
- Opportunity Map Analysis
- Product Life Cycle Analysis
- Supply Chain Analysis
- Investment Feasibility Matrix
- Value Chain Analysis
- PESTLE and Porter's Analysis
- Regulatory Landscape
- Regional Parent Market Outlook
- Production and Consumption Statistics
- Import and Export Statistics
- Global Market Analysis and Forecast, 2021 to 2036
- Historical Market Size Value (USD Million) Analysis, 2021 to 2025
- Current and Future Market Size Value (USD Million) Projections, 2026 to 2036
- Y-o-Y Growth Trend Analysis
- Absolute $ Opportunity Analysis
- Global Market Pricing Analysis, 2021 to 2036
- Global Market Analysis and Forecast, By Type, 2021 to 2036
- Introduction / Key Findings
- Historical Market Size Value (USD Million) Analysis By Type, 2021 to 2025
- Current and Future Market Size Value (USD Million) Analysis and Forecast By Type, 2026 to 2036
- PEEK
- PEKK
- PEK and Other PAEK
- Y-o-Y Growth Trend Analysis By Type, 2021 to 2025
- Absolute $ Opportunity Analysis By Type, 2026 to 2036
- Global Market Analysis and Forecast, By Form, 2021 to 2036
- Introduction / Key Findings
- Historical Market Size Value (USD Million) Analysis By Form, 2021 to 2025
- Current and Future Market Size Value (USD Million) Analysis and Forecast By Form, 2026 to 2036
- Neat Resin
- Filled and Reinforced Compounds
- Powder and Filament
- Y-o-Y Growth Trend Analysis By Form, 2021 to 2025
- Absolute $ Opportunity Analysis By Form, 2026 to 2036
- Global Market Analysis and Forecast, By End Use, 2021 to 2036
- Introduction / Key Findings
- Historical Market Size Value (USD Million) Analysis By End Use, 2021 to 2025
- Current and Future Market Size Value (USD Million) Analysis and Forecast By End Use, 2026 to 2036
- Aerospace and Defense
- Medical and Dental
- Automotive
- Oil and Gas
- Electrical and Electronics
- Other
- Y-o-Y Growth Trend Analysis By End Use, 2021 to 2025
- Absolute $ Opportunity Analysis By End Use, 2026 to 2036
- Global Market Analysis and Forecast, By Region, 2021 to 2036
- Introduction
- Historical Market Size Value (USD Million) Analysis By Region, 2021 to 2025
- Current Market Size Value (USD Million) Analysis and Forecast By Region, 2026 to 2036
- North America
- Western Europe
- East Asia
- South Asia
- Market Attractiveness Analysis By Region
- North America Market Analysis and Forecast, By Country, 2021 to 2036
- Historical Market Size Value (USD Million) Trend Analysis By Market Taxonomy, 2021 to 2025
- Market Size Value (USD Million) Forecast By Market Taxonomy, 2026 to 2036
- By Country
- United States
- By Type
- By Form
- By End Use
- By Country
- Market Attractiveness Analysis
- By Country
- By Type
- By Form
- By End Use
- Key Takeaways
- Western Europe Market Analysis and Forecast, By Country
- Historical Market Size Value (USD Million) Trend Analysis By Market Taxonomy, 2021 to 2025
- Market Size Value (USD Million) Forecast By Market Taxonomy, 2026 to 2036
- By Country
- Germany
- United Kingdom
- France
- Italy
- By Type
- By Form
- By End Use
- By Country
- Market Attractiveness Analysis
- By Country
- By Type
- By Form
- By End Use
- Key Takeaways
- East Asia Market Analysis and Forecast, By Country
- Historical Market Size Value (USD Million) Trend Analysis By Market Taxonomy, 2021 to 2025
- Market Size Value (USD Million) Forecast By Market Taxonomy, 2026 to 2036
- By Country
- China
- Japan
- South Korea
- Taiwan
- By Type
- By Form
- By End Use
- By Country
- Market Attractiveness Analysis
- By Country
- By Type
- By Form
- By End Use
- Key Takeaways
- South Asia Market Analysis and Forecast, By Country
- Historical Market Size Value (USD Million) Trend Analysis By Market Taxonomy, 2021 to 2025
- Market Size Value (USD Million) Forecast By Market Taxonomy, 2026 to 2036
- By Country
- India
- Rest of world
- By Type
- By Form
- By End Use
- By Country
- Market Attractiveness Analysis
- By Country
- By Type
- By Form
- By End Use
- Key Takeaways
- Key Countries Market Analysis
- United States
- Pricing Analysis
- Market Share Analysis, 2025
- By Type
- By Form
- By End Use
- Germany
- Pricing Analysis
- Market Share Analysis, 2025
- By Type
- By Form
- By End Use
- United Kingdom
- Pricing Analysis
- Market Share Analysis, 2025
- By Type
- By Form
- By End Use
- Italy
- Pricing Analysis
- Market Share Analysis, 2025
- By Type
- By Form
- By End Use
- France
- Pricing Analysis
- Market Share Analysis, 2025
- By Type
- By Form
- By End Use
- India
- Pricing Analysis
- Market Share Analysis, 2025
- By Type
- By Form
- By End Use
- China
- Pricing Analysis
- Market Share Analysis, 2025
- By Type
- By Form
- By End Use
- Japan
- Pricing Analysis
- Market Share Analysis, 2025
- By Type
- By Form
- By End Use
- South Korea
- Pricing Analysis
- Market Share Analysis, 2025
- By Type
- By Form
- By End Use
- Taiwan
- Pricing Analysis
- Market Share Analysis, 2025
- By Type
- By Form
- By End Use
- United States
- Market Structure Analysis
- Competition Dashboard
- Competition Benchmarking
- Market Share Analysis of Top Players
- By Regional
- By Type
- By Form
- By End Use
- Emerging Startups
- Innovation Benchmarking
- Competition Analysis
- Competition Deep Dive
- Victrex
- Overview
- Product Portfolio
- Profitability by Market Segments
- Sales Footprint
- Strategy Overview
- Marketing Strategy
- Product Strategy
- Channel Strategy
- Syensqo
- Evonik
- Arkema
- Ensinger
- Panjin Zhongrun High Performance Polymers
- Jilin Joinature Polymer
- Oxford Performance Materials
- Victrex
- Case Studies
- Success Stories
- Recent Developments
- Competition Deep Dive
- Assumptions & Acronyms Used
List of Tables
- Table 1: Global Market Value (USD Million) Forecast by Region, 2021 to 2036
- Table 2: Global Market Value (USD Million) Forecast by Type, 2021 to 2036
- Table 3: Global Market Value (USD Million) Forecast by Form, 2021 to 2036
- Table 4: Global Market Value (USD Million) Forecast by End Use, 2021 to 2036
- Table 5: North America Market Value (USD Million) Forecast by Country, 2021 to 2036
- Table 6: North America Market Value (USD Million) Forecast by Type, 2021 to 2036
- Table 7: North America Market Value (USD Million) Forecast by Form, 2021 to 2036
- Table 8: North America Market Value (USD Million) Forecast by End Use, 2021 to 2036
- Table 9: Western Europe Market Value (USD Million) Forecast by Country, 2021 to 2036
- Table 10: Western Europe Market Value (USD Million) Forecast by Type, 2021 to 2036
- Table 11: Western Europe Market Value (USD Million) Forecast by Form, 2021 to 2036
- Table 12: Western Europe Market Value (USD Million) Forecast by End Use, 2021 to 2036
- Table 13: East Asia Market Value (USD Million) Forecast by Country, 2021 to 2036
- Table 14: East Asia Market Value (USD Million) Forecast by Type, 2021 to 2036
- Table 15: East Asia Market Value (USD Million) Forecast by Form, 2021 to 2036
- Table 16: East Asia Market Value (USD Million) Forecast by End Use, 2021 to 2036
- Table 17: South Asia Market Value (USD Million) Forecast by Country, 2021 to 2036
- Table 18: South Asia Market Value (USD Million) Forecast by Type, 2021 to 2036
- Table 19: South Asia Market Value (USD Million) Forecast by Form, 2021 to 2036
- Table 20: South Asia Market Value (USD Million) Forecast by End Use, 2021 to 2036
List of Figures
- Figure 1: Global Market Pricing Analysis
- Figure 2: Global Market Value (USD Million) Forecast 2021-2036
- Figure 3: Global Market Value Share and BPS Analysis by Type, 2026 and 2036
- Figure 4: Global Market Y-o-Y Growth Comparison by Type, 2026-2036
- Figure 5: Global Market Attractiveness Analysis by Type
- Figure 6: Global Market Value Share and BPS Analysis by Form, 2026 and 2036
- Figure 7: Global Market Y-o-Y Growth Comparison by Form, 2026-2036
- Figure 8: Global Market Attractiveness Analysis by Form
- Figure 9: Global Market Value Share and BPS Analysis by End Use, 2026 and 2036
- Figure 10: Global Market Y-o-Y Growth Comparison by End Use, 2026-2036
- Figure 11: Global Market Attractiveness Analysis by End Use
- Figure 12: Global Market Value (USD Million) Share and BPS Analysis by Region, 2026 and 2036
- Figure 13: Global Market Y-o-Y Growth Comparison by Region, 2026-2036
- Figure 14: Global Market Attractiveness Analysis by Region
- Figure 15: North America Market Incremental Dollar Opportunity, 2026-2036
- Figure 16: Western Europe Market Incremental Dollar Opportunity, 2026-2036
- Figure 17: East Asia Market Incremental Dollar Opportunity, 2026-2036
- Figure 18: South Asia Market Incremental Dollar Opportunity, 2026-2036
- Figure 19: North America Market Value Share and BPS Analysis by Country, 2026 and 2036
- Figure 20: North America Market Value Share and BPS Analysis by Type, 2026 and 2036
- Figure 21: North America Market Y-o-Y Growth Comparison by Type, 2026-2036
- Figure 22: North America Market Attractiveness Analysis by Type
- Figure 23: North America Market Value Share and BPS Analysis by Form, 2026 and 2036
- Figure 24: North America Market Y-o-Y Growth Comparison by Form, 2026-2036
- Figure 25: North America Market Attractiveness Analysis by Form
- Figure 26: North America Market Value Share and BPS Analysis by End Use, 2026 and 2036
- Figure 27: North America Market Y-o-Y Growth Comparison by End Use, 2026-2036
- Figure 28: North America Market Attractiveness Analysis by End Use
- Figure 29: Western Europe Market Value Share and BPS Analysis by Country, 2026 and 2036
- Figure 30: Western Europe Market Value Share and BPS Analysis by Type, 2026 and 2036
- Figure 31: Western Europe Market Y-o-Y Growth Comparison by Type, 2026-2036
- Figure 32: Western Europe Market Attractiveness Analysis by Type
- Figure 33: Western Europe Market Value Share and BPS Analysis by Form, 2026 and 2036
- Figure 34: Western Europe Market Y-o-Y Growth Comparison by Form, 2026-2036
- Figure 35: Western Europe Market Attractiveness Analysis by Form
- Figure 36: Western Europe Market Value Share and BPS Analysis by End Use, 2026 and 2036
- Figure 37: Western Europe Market Y-o-Y Growth Comparison by End Use, 2026-2036
- Figure 38: Western Europe Market Attractiveness Analysis by End Use
- Figure 39: East Asia Market Value Share and BPS Analysis by Country, 2026 and 2036
- Figure 40: East Asia Market Value Share and BPS Analysis by Type, 2026 and 2036
- Figure 41: East Asia Market Y-o-Y Growth Comparison by Type, 2026-2036
- Figure 42: East Asia Market Attractiveness Analysis by Type
- Figure 43: East Asia Market Value Share and BPS Analysis by Form, 2026 and 2036
- Figure 44: East Asia Market Y-o-Y Growth Comparison by Form, 2026-2036
- Figure 45: East Asia Market Attractiveness Analysis by Form
- Figure 46: East Asia Market Value Share and BPS Analysis by End Use, 2026 and 2036
- Figure 47: East Asia Market Y-o-Y Growth Comparison by End Use, 2026-2036
- Figure 48: East Asia Market Attractiveness Analysis by End Use
- Figure 49: South Asia Market Value Share and BPS Analysis by Country, 2026 and 2036
- Figure 50: South Asia Market Value Share and BPS Analysis by Type, 2026 and 2036
- Figure 51: South Asia Market Y-o-Y Growth Comparison by Type, 2026-2036
- Figure 52: South Asia Market Attractiveness Analysis by Type
- Figure 53: South Asia Market Value Share and BPS Analysis by Form, 2026 and 2036
- Figure 54: South Asia Market Y-o-Y Growth Comparison by Form, 2026-2036
- Figure 55: South Asia Market Attractiveness Analysis by Form
- Figure 56: South Asia Market Value Share and BPS Analysis by End Use, 2026 and 2036
- Figure 57: South Asia Market Y-o-Y Growth Comparison by End Use, 2026-2036
- Figure 58: South Asia Market Attractiveness Analysis by End Use
- Figure 59: Global Market - Tier Structure Analysis
- Figure 60: Global Market - Company Share Analysis
Frequently Asked Questions
How big is the polyaryletherketone (PAEK) market in 2026?
FMI estimates the market at USD 972.0 million in 2026, up from USD 900.0 million in 2025. It is forecast to reach USD 2,003.3 million by 2036 at a 7.5% CAGR.
Which type leads the polyaryletherketone (PAEK) market in 2026?
PEEK leads by type with 86.0% in 2026. All other segments together hold 14.0%.
Which form and end use lead in 2026?
Neat Resin holds 52.0% by form and Aerospace and Defense holds 24.0% by end use in FMI's 2026 assessment.
Which market is forecast to grow fastest through 2036?
India has the highest forecast CAGR at 10.0% during 2026 to 2036, followed by China at 9.5%.
Does a resin supplier's medical offer mean that all finished devices are approved?
No. Material support and a finished device's regulatory route are separate matters. OPM's instructions describe a specific custom-device route and its limitations.[17]
Preview the report firsthand - request a free sample
Get SampleGet the brochure for pricing and purchase details.
Get PDF
