Reports

- Global Locations -

Headquarters

Future Market Insights, Inc.

Christiana Corporate, 200
Continental Drive, Suite 401,
Newark, Delaware - 19713,
United States

T: +1-845-579-5705

Americas

Future Market Insights, Inc.

616 Corporate Way, Suite 2-9018,
Valley Cottage, NY 10989, United States

T: +1-347-918-3531

MEA

Future Market Insights

1602-6 Jumeirah Bay X2 Tower, Plot No: JLT-PH2-X2A,
Jumeirah Lakes Towers, Dubai,
United Arab Emirates

Europe

Future Market Insights

3rd Floor, 207 Regent Street,
W1B 3HH London
United Kingdom

T: + 44 (0) 20 8123 9659
D: +44 (0) 20 3287 4268

Asia Pacific

Future Market Insights

IndiaLand Global Tech Park, Unit UG-1, Behind Grand HighStreet, Phase 1, Hinjawadi, MH, Pune – 411057, India

Polyisocyanurate Insulation Market Outlook for 2023 to 2033

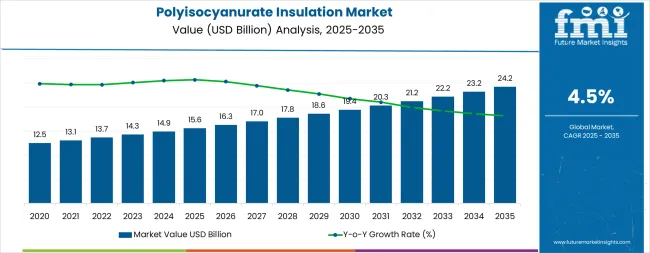
The global polyisocyanurate insulation market is projected to surpass a valuation of US$ 25,551.57 million by 2033. The global polyisocyanurate insulation market is expected to grow at a CAGR of 6.10% through 2033. The current valuation of the market is US$ 14,133.90 million in 2023.

Attributes Details
Polyisocyanurate Insulation Market Size, 2022 US$ 13,295.20 million
Polyisocyanurate Insulation Market Size, 2023 US$ 14,133.90 million
Polyisocyanurate Insulation Market Size, 2033 US$ 25,551.57 million
Value CAGR (2023 to 2033) 6.10%

Key Market Highlights

Rise of Passive House Construction Propels Demand for Ultra-energy-efficient Buildings

Net-zero and passive house buildings are rising in response to the worldwide push for energy efficiency and lower carbon emissions. These building standards strive to achieve low energy usage by utilizing super-insulated building envelopes. Polyisocyanurate insulation has high thermal resistance (R-value) and is widely used in these projects. Manufacturers aiming for this specialized market are tailoring their product lines to meet net-zero and passive home certifications' unique needs. This strategic alignment positions them as providers of insulation solutions critical to meeting these stringent energy efficiency criteria.

Nanotechnology and Advanced Coatings Gain Prominence in the Industry

Advanced coatings for insulating materials, such as polyisocyanurate, are being developed using nanotechnology. These nanocoatings improve insulation performance by resisting moisture, UV radiation, and other environmental conditions. Manufacturers who invest in nanotechnology-driven coatings present their polyisocyanurate insulation products as cutting-edge materials with prolonged lifespans and greater resistance to external factors. This advancement is in line with the market's desire for high-performance insulating products.

Increasing Use of Digital Tools and BIM Integration

Integrating digital technologies, particularly Building Information Modeling (BIM), is becoming increasingly important in this age of digital transformation. Manufacturers respond by providing BIM-ready models and digital technologies that ease polyisocyanurate insulation's design, standards, and deployment processes. This trend ensures their solutions integrate smoothly into building projects' digital procedures. Manufacturers improve cooperation, productivity, and project success by attracting tech-savvy individuals and streamlining the process.

Don't pay for what you don't need

Customize your report by selecting specific countries or regions and save 30%!

Historical Performance of the Polyisocyanurate Insulation Market (2018 to 2022) Vs. Forecast Outlook (2023 to 2033)

Attributes Details
Polyisocyanurate Insulation Market Size (2022) US$ 13,295.50 million

In recent years, producers' continuous innovation has resulted in a new generation of polyisocyanurate insulating products with better characteristics. These benefits include better thermal efficiency, fire resistance, and moisture resistance. Polyisocyanurate's market presence has grown as a result of such product advancements. The construction industry is experiencing steady expansion, notably in the residential and commercial sectors. Polyisocyanurate insulation reaps benefits from this boom in building projects due to its applicability for many construction applications, correlating with the rise of the construction sector.

Building rules and regulations have evolved, particularly emphasizing energy efficiency and sustainability. Polyisocyanurate insulation, known for its high heat resistance, has emerged as a favored alternative for satisfying these stringent requirements. It positions manufacturers as compliance and energy-saving facilitators, critical in an increasingly regulated construction sector. The demand to improve the energy efficiency of existing structures has grown in recent years. Many older buildings are under-insulated, and polyisocyanurate insulation is a popular alternative for boosting energy performance. This trend takes advantage of the expanding market for energy-efficient retrofits, opening up prospects for enterprises in the field.

In the future, sustainability is anticipated to be an essential catalyst in the building sector. As a result, the need for environmentally friendly insulating materials, such as polyisocyanurate with enhanced environmental profiles, is likely to increase. Manufacturers who use sustainable processes and provide recyclable or low-impact insulating materials are expected to gain an advantage in the market. Technological advancements for improved coatings and composite insulation systems fuel market growth prospects. Manufacturers who spend in research and development to produce high-performance, multi-functional insulating solutions are expected to be well-positioned in the market.

Polyisocyanurate Insulation Market Trends

Trends
  • The move toward bespoke and prefabricated polyisocyanurate insulation solutions decreases total project costs and expedites building procedures.
  • Manufacturers are combining polyisocyanurate insulation with other materials to create composite insulation solutions with improved thermal and fire-resistant capabilities to meet the demands of a wide range of customers.
  • Manufacturers of polyisocyanurate insulation are creating materials that can survive harsh weather conditions, increasing the resistance of structures to environmental stresses.
  • Manufacturers use recyclable and eco-friendly packaging for polyisocyanurate insulation materials, demonstrating their commitment to sustainability and environmental stewardship.
  • Manufacturers are concentrating on recyclability and sustainable manufacturing processes to decrease waste and environmental effects.
Opportunities
  • With the rising use of renewable energy systems, polyisocyanurate insulation applications in producing thermal energy storage materials for absorbing and releasing heat or cold add to the efficiency of HVAC systems.
  • Manufacturers experimenting with novel materials, such as transparent aerogel insulating material, can differentiate themselves by providing unique solutions that give higher thermal performance while allowing natural light to pass through.
  • Sustainable and ecologically friendly building materials are higher in demand. Manufacturers can take advantage of the chance to produce and market more environmentally friendly polyisocyanurate insulating materials.
  • The construction industry's move toward customization and prefabrication allows manufacturers to deliver personalized polyisocyanurate insulation solutions.
  • Polyisocyanurate insulation has substantial development potential in the maintenance and retrofit sector for energy efficiency improvements in older structures.
Challenges
  • Other high-performance insulation materials, including spray foam, mineral wool, and expanded polystyrene (EPS), compete in the market.
  • Raw material price fluctuations can impact production costs and, possibly, pricing for polyisocyanurate insulation.
  • Strict health and safety standards in the manufacture and use of insulating materials can create compliance issues and raise costs for producers.
Nikhil Kaitwade
Nikhil Kaitwade

Principal Consultant

Talk to Analyst

Find your sweet spots for generating winning opportunities in this market.

Comparative View of Adjacent Polyisocyanurate Insulation Market

The section provides a comparative analysis of two other markets: the thermal insulation material market, the high-performance insulation market, and the polyisocyanurate insulation market. As per the analysis, the growing emphasis on sustainability and reduced carbon footprint in construction and building materials is predicted to influence development across the mentioned markets. The rising need to upgrade existing buildings for energy efficiency is expected to drive market demand. The increasing construction activity, particularly in the residential and commercial sectors, is likely to lead to higher revenues in the mentioned markets.

Polyisocyanurate Insulation Market:

Attributes Polyisocyanurate Insulation Market
CAGR (2023 to 2033) 6.10%
Market Value (2023) US$ 14,133.90 million
Growth Factors
  • Increasing energy efficiency regulations.
  • Growing awareness of insulation benefits.
Future Opportunities Increased building renovation and retrofitting projects.
Market Trends Growing sustainability and environmental concerns.

Thermal Insulation Material Market:

Attributes Thermal Insulation Material Market
CAGR (2023 to 2033) 5.6%
Market Value (2023) US$ 70.74 billion
Growth Factors
  • Rising emphasis on reducing energy consumption and sustainability.
  • Surging green construction endeavors globally.
Future Opportunities Increased use of sustainable thermal insulation materials.
Market Trends Rising R&D in product development.

High-performance Insulation Material Market:

Attributes High-performance Insulation Materials Market
CAGR (2023 to 2033) 11%
Market Value (2023) US$ 14.91 billion
Growth Factors
  • Growing awareness for energy saving and greenhouse emissions.
  • Increasing adoption of less harmful materials due to environmental concerns.
Future Opportunities Increasing investments in developing nations.
Market Trends Rising skilled labor.

Category-wise Insights

Rising Demand for Advanced Insulation Materials Elevates Sales of Rigid Foam

Top Type Rigid Foam
Value Share (2023) 80%

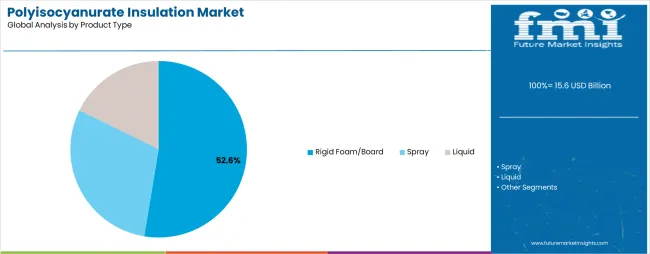
The increased demand for advanced insulation materials, particularly rigid foam, can be ascribed to the need to comply with more strict building codes and energy efficiency requirements to ensure compliance and adherence to regulatory frameworks. Manufacturers' effort to produce ecologically sustainable rigid foam insulation correlates with the construction industry's increasing emphasis on sustainability and decreased carbon emissions, demonstrating a commitment to eco-friendly techniques and materials. Continuous research and development efforts to refine rigid foam insulation formulations lead to constant advancements in thermal efficiency and performance. This drives the demand from industry professionals looking for cutting-edge and efficient insulation solutions for their construction projects.

Increasing Innovations in Thermal Insulation Technologies Boosting Industry Development

Top Application Thermal
Value Share (2023) 73.1%

Increasing public awareness of thermal insulation's environmental and financial benefits has produced a discriminating market sector that actively seeks energy-efficient and sustainable building solutions to accommodate changing consumer preferences. Continuous breakthroughs in insulation technology have resulted in complex and high-performance thermal insulation materials, enabling organizations to keep on top of technical changes and integrate cutting-edge solutions to preserve competitiveness and market relevance.

Get the data you need at a Fraction of the cost

Personalize your report by choosing insights you need
and save 40%!

Country-wise Insights

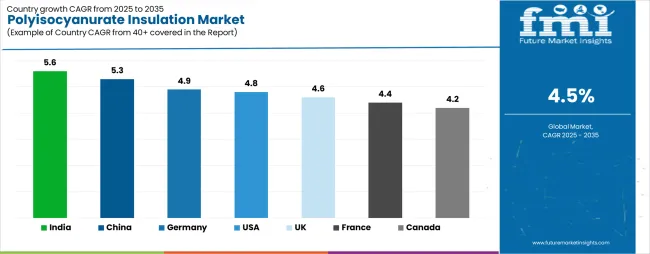
Countries Value CAGR (2023 to 2033)
Canada 5.20%
United Kingdom 5.50%
Germany 4.30%
India 7.40%
China 7.70%

Rising Infrastructural Development Initiatives Boosting Market in Canada

The polyisocyanurate insulation market in Canada is expected to rise at a 5.20% CAGR through 2033. Ongoing infrastructure development initiatives, such as government-funded infrastructure projects, renovations, and commercial and residential construction projects, have sparked the need for high-quality insulation materials. This has created a favorable business environment for product diversification and market expansion. Key Canadian cities are experiencing rapid urbanization and population growth, increasing the demand for residential and commercial real estate. This drives the demand for insulation materials to meet the needs of the expanding real estate and construction industries, spurring market expansion and revenue growth.

Energy Performance Certificates (EPCs) Mandates Foster Market Growth in the United Kingdom

The polyisocyanurate insulation market size in the United Kingdom is projected to surge at a 5.50% CAGR through 2033. High-performance insulation materials are becoming increasingly prevalent due to the requirement for Energy Performance Certificates for residential and commercial properties. Businesses are incorporating cutting-edge insulation solutions to meet EPC standards and improve property ratings. They are also encouraging market growth and compliance adherence. Government-sponsored retrofit and renovation programs, like the Energy Company Obligation (ECO) and the Green Homes Grant, have encouraged property owners to upgrade to more energy-efficient insulation. This support fuels market growth and creates profitable opportunities for companies in the construction and insulation industries.

Green Bonds and Sustainable Investment Initiatives Stimulate Growth in Germany

The polyisocyanurate insulation market in Germany is expected to expand at a 4.30% CAGR through 2033. The increased availability of green financing options and investment opportunities in Germany's financial markets has facilitated increased funding and capital flow into sustainable building projects, including the adoption of energy-efficient insulation solutions, fostering market expansion and stimulating industry growth. Furthermore, the incorporation of Industry 4.0 principles and smart building technologies within Germany's construction and building sector has spurred demand for innovative and digitally integrated insulation materials. This is fostering market expansion while offering opportunities for businesses to develop sophisticated insulation solutions that support data-driven construction oversight and energy optimization.

Smart City Mission and Urban Infrastructure Development Spurs Growth in India

The polyisocyanurate insulation market in India is projected to rise at a 7.40% CAGR through 2033. India's Smart City Mission and rising emphasis on urban infrastructure development have catalyzed demand for environmentally friendly insulation solutions. The market is also fueled by the need for sustainable and cutting-edge building materials that promote the development of smart and resilient cities. This helps foster market expansion and provides businesses with opportunities to participate in large-scale urban development projects. Furthermore, the focus on rural electrification and energy access programs in India has increased the demand for energy-efficient insulation materials that support off-grid and decentralized energy solutions. This development fosters market expansion, providing prospects for businesses to engage in rural electrification projects while contributing to developing sustainable and energy-independent rural communities.

Digital Transformation and Smart Building Technologies Proliferate Product Demand in China

The polyisocyanurate insulation market size in China is likely to accelerate at a 7.70% CAGR through 2033. The integration of digital transformation and smart building technologies in China's real estate and construction industries has led to an increasing demand for high-tech insulation materials that facilitate data-driven building management and energy optimization. This provides companies the chance to take part in the creation of connected and smart buildings and infrastructure. China's efforts to improve insulation standards and quality control in the construction industry have led to the development of certified and high-quality insulation materials. This has positioned companies that offer dependable and compliant insulation solutions as key players in the market, encouraging growth and an industry-wide dedication to standards adherence and quality.

Competitive Landscape

The market for polyisocyanurate insulation offers a competitive environment with well-established market leaders, local firms, and innovative startups. Sustainability, innovation, variations in regulations, and consumer preferences all influence competition. To be competitive in this changing market, the industry players need to create cutting-edge, environmentally friendly insulation products to reach a wider audience and provide exceptional customer service and customized solutions.

Recent Developments

  • In June 2023, Bitec debuted DuraPlanTM EcoSet Green adhesive, which is said to be the roofing industry's first ultra-low-solvent adhesive built exclusively for cold-process APP-modified bitumen roof systems with slopes up to 3:12. According to the announcement, the eco-friendly formulation has a very low odor with less than 25 g/L VOCs and may be used to create single or multiple plies of Bitec-approved base sheets and cap sheets, as well as a flood coat in cold-process applications.
  • GAF, located in New Jersey, is one of North America's leading roofing and waterproofing manufacturers. The firm has announced plans to build its fifth polyisocyanurate (polyiso) insulation production plant in Peru, Illinois, in July 2022. GAF has allegedly agreed to buy more than 100 acres of property in Bureau County, Illinois, for the eventual location of a 450,000-square-foot factory that would produce the company's EnergyGuard range of products.

Key Players in the Polyisocyanurate Insulation Market

  • BASF SE
  • DowDuPont Inc.
  • Owens Corning Insulating Systems LLC
  • SAINT-GOBAIN
  • Kingspan Group plc
  • Honeywell International Inc.
  • Johns Manville Corporation
  • Stepan Company
  • IKO Industries Ltd.
  • Soprema Group
  • Knauf Insulation
  • Atlas Roofing Corporation
  • Rmax Operating LLC
  • GAF Materials Corporation
  • Carlisle SynTec
  • Systems Hunter Panels

Polyisocyanurate Insulation Market Segmentation

By Product Type:

  • Liquid
  • Spray
  • Rigid Foam/Board

By Application:

  • Acoustic
  • Thermal
  • Hybrid

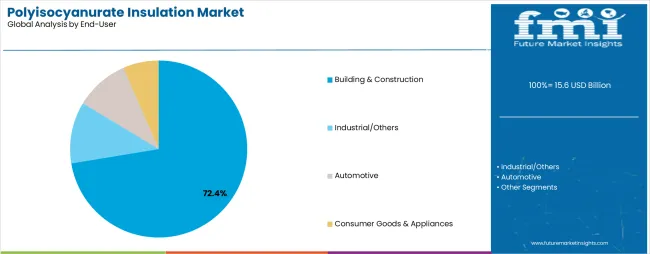
By End-user:

  • Building & Construction
    • Residential
    • Commercial
    • Industrial
    • Infrastructure
  • Automotive
    • Passenger Vehicles (PVs)
    • Light Commercial Vehicles (LCVs)
    • Heavy Commercial Vehicles (HCVs)
  • Consumer Goods
  • Others

By Region:

  • North America
  • Latin America
  • Western Europe
  • Eastern Europe
  • Asia Pacific (APAC)
  • Middle East & Africa (MEA)
  • Japan

Frequently Asked Questions

How Big is the Polyisocyanurate Insulation Market?

The polyisocyanurate insulation market size is US$ 14,133.90 million in 2023.

What is the Projected CAGR of the Polyisocyanurate Insulation Market?

The polyisocyanurate insulation market size is expected to increase at a CAGR of 6.10% through 2033.

How Big Will the Polyisocyanurate Insulation Market Be by 2033?

The polyisocyanurate insulation market will be worth US$ 25,551.47 million by 2033.

Which is the Preferred Product Type in the Polyisocyanurate Insulation Market?

Rigid foam is the highly preferred product in the polyisocyanurate insulation market.

Which Country is Expected to Rise Rapidly in the Polyisocyanurate Insulation Market?

The polyisocyanurate insulation market in China is expected to rise rapidly at a 7.70% CAGR through 2033.

Table of Content

1. Executive Summary

    1.1. Global Market Outlook

    1.2. Demand-side Trends

    1.3. Supply-side Trends

    1.4. Technology Roadmap Analysis

    1.5. Analysis and Recommendations

2. Market Overview

    2.1. Market Coverage / Taxonomy

    2.2. Market Definition / Scope / Limitations

3. Market Background

    3.1. Market Dynamics

        3.1.1. Drivers

        3.1.2. Restraints

        3.1.3. Opportunity

        3.1.4. Trends

    3.2. Scenario Forecast

        3.2.1. Demand in Optimistic Scenario

        3.2.2. Demand in Likely Scenario

        3.2.3. Demand in Conservative Scenario

    3.3. Opportunity Map Analysis

    3.4. Product Life Cycle Analysis

    3.5. Supply Chain Analysis

        3.5.1. Supply Side Participants and their Roles

            3.5.1.1. Producers

            3.5.1.2. Mid-Level Participants (Traders/ Agents/ Brokers)

            3.5.1.3. Wholesalers and Distributors

        3.5.2. Value Added and Value Created at Node in the Supply Chain

        3.5.3. List of Raw Material Suppliers

        3.5.4. List of Existing and Potential Buyer’s

    3.6. Investment Feasibility Matrix

    3.7. Value Chain Analysis

        3.7.1. Profit Margin Analysis

        3.7.2. Wholesalers and Distributors

        3.7.3. Retailers

    3.8. PESTLE and Porter’s Analysis

    3.9. Regulatory Landscape

        3.9.1. By Key Regions

        3.9.2. By Key Countries

    3.10. Regional Parent Market Outlook

    3.11. Production and Consumption Statistics

    3.12. Import and Export Statistics

4. Global Market Analysis 2018 to 2022 and Forecast, 2023 to 2033

    4.1. Historical Market Size Value (US$ Million) & Volume (Sq. Feet) Analysis, 2018 to 2022

    4.2. Current and Future Market Size Value (US$ Million) & Volume (Sq. Feet) Projections, 2023 to 2033

        4.2.1. Y-o-Y Growth Trend Analysis

        4.2.2. Absolute $ Opportunity Analysis

5. Global Market Analysis 2018 to 2022 and Forecast 2023 to 2033, By Application

    5.1. Introduction / Key Findings

    5.2. Historical Market Size Value (US$ Million) & Volume (Sq. Feet) Analysis By Application, 2018 to 2022

    5.3. Current and Future Market Size Value (US$ Million) & Volume (Sq. Feet) Analysis and Forecast By Application, 2023 to 2033

        5.3.1. Acoustic

        5.3.2. Thermal

        5.3.3. Hybrid

    5.4. Y-o-Y Growth Trend Analysis By Application, 2018 to 2022

    5.5. Absolute $ Opportunity Analysis By Application, 2023 to 2033

6. Global Market Analysis 2018 to 2022 and Forecast 2023 to 2033, By End User

    6.1. Introduction / Key Findings

    6.2. Historical Market Size Value (US$ Million) & Volume (Sq. Feet) Analysis By End User, 2018 to 2022

    6.3. Current and Future Market Size Value (US$ Million) & Volume (Sq. Feet) Analysis and Forecast By End User, 2023 to 2033

        6.3.1. Building & Construction

            6.3.1.1. Roofs

            6.3.1.2. walls

        6.3.2. Transport

        6.3.3. Consumer Appliances

        6.3.4. Others

    6.4. Y-o-Y Growth Trend Analysis By End User, 2018 to 2022

    6.5. Absolute $ Opportunity Analysis By End User, 2023 to 2033

7. Global Market Analysis 2018 to 2022 and Forecast 2023 to 2033, By Region

    7.1. Introduction

    7.2. Historical Market Size Value (US$ Million) & Volume (Sq. Feet) Analysis By Region, 2018 to 2022

    7.3. Current Market Size Value (US$ Million) & Volume (Sq. Feet) Analysis and Forecast By Region, 2023 to 2033

        7.3.1. North America

        7.3.2. Latin America

        7.3.3. Western Europe

        7.3.4. Eastern Europe

        7.3.5. South Asia and Pacific

        7.3.6. East Asia

        7.3.7. Middle East and Africa

    7.4. Market Attractiveness Analysis By Region

8. North America Market Analysis 2018 to 2022 and Forecast 2023 to 2033, By Country

    8.1. Historical Market Size Value (US$ Million) & Volume (Sq. Feet) Trend Analysis By Market Taxonomy, 2018 to 2022

    8.2. Market Size Value (US$ Million) & Volume (Sq. Feet) Forecast By Market Taxonomy, 2023 to 2033

        8.2.1. By Country

            8.2.1.1. USA

            8.2.1.2. Canada

        8.2.2. By Application

        8.2.3. By End User

    8.3. Market Attractiveness Analysis

        8.3.1. By Country

        8.3.2. By Application

        8.3.3. By End User

    8.4. Key Takeaways

9. Latin America Market Analysis 2018 to 2022 and Forecast 2023 to 2033, By Country

    9.1. Historical Market Size Value (US$ Million) & Volume (Sq. Feet) Trend Analysis By Market Taxonomy, 2018 to 2022

    9.2. Market Size Value (US$ Million) & Volume (Sq. Feet) Forecast By Market Taxonomy, 2023 to 2033

        9.2.1. By Country

            9.2.1.1. Brazil

            9.2.1.2. Mexico

            9.2.1.3. Rest of Latin America

        9.2.2. By Application

        9.2.3. By End User

    9.3. Market Attractiveness Analysis

        9.3.1. By Country

        9.3.2. By Application

        9.3.3. By End User

    9.4. Key Takeaways

10. Western Europe Market Analysis 2018 to 2022 and Forecast 2023 to 2033, By Country

    10.1. Historical Market Size Value (US$ Million) & Volume (Sq. Feet) Trend Analysis By Market Taxonomy, 2018 to 2022

    10.2. Market Size Value (US$ Million) & Volume (Sq. Feet) Forecast By Market Taxonomy, 2023 to 2033

        10.2.1. By Country

            10.2.1.1. Germany

            10.2.1.2. UK

            10.2.1.3. France

            10.2.1.4. Spain

            10.2.1.5. Italy

            10.2.1.6. Rest of Western Europe

        10.2.2. By Application

        10.2.3. By End User

    10.3. Market Attractiveness Analysis

        10.3.1. By Country

        10.3.2. By Application

        10.3.3. By End User

    10.4. Key Takeaways

11. Eastern Europe Market Analysis 2018 to 2022 and Forecast 2023 to 2033, By Country

    11.1. Historical Market Size Value (US$ Million) & Volume (Sq. Feet) Trend Analysis By Market Taxonomy, 2018 to 2022

    11.2. Market Size Value (US$ Million) & Volume (Sq. Feet) Forecast By Market Taxonomy, 2023 to 2033

        11.2.1. By Country

            11.2.1.1. Poland

            11.2.1.2. Russia

            11.2.1.3. Czech Republic

            11.2.1.4. Romania

            11.2.1.5. Rest of Eastern Europe

        11.2.2. By Application

        11.2.3. By End User

    11.3. Market Attractiveness Analysis

        11.3.1. By Country

        11.3.2. By Application

        11.3.3. By End User

    11.4. Key Takeaways

12. South Asia and Pacific Market Analysis 2018 to 2022 and Forecast 2023 to 2033, By Country

    12.1. Historical Market Size Value (US$ Million) & Volume (Sq. Feet) Trend Analysis By Market Taxonomy, 2018 to 2022

    12.2. Market Size Value (US$ Million) & Volume (Sq. Feet) Forecast By Market Taxonomy, 2023 to 2033

        12.2.1. By Country

            12.2.1.1. India

            12.2.1.2. Bangladesh

            12.2.1.3. Australia

            12.2.1.4. New Zealand

            12.2.1.5. Rest of South Asia and Pacific

        12.2.2. By Application

        12.2.3. By End User

    12.3. Market Attractiveness Analysis

        12.3.1. By Country

        12.3.2. By Application

        12.3.3. By End User

    12.4. Key Takeaways

13. East Asia Market Analysis 2018 to 2022 and Forecast 2023 to 2033, By Country

    13.1. Historical Market Size Value (US$ Million) & Volume (Sq. Feet) Trend Analysis By Market Taxonomy, 2018 to 2022

    13.2. Market Size Value (US$ Million) & Volume (Sq. Feet) Forecast By Market Taxonomy, 2023 to 2033

        13.2.1. By Country

            13.2.1.1. China

            13.2.1.2. Japan

            13.2.1.3. South Korea

        13.2.2. By Application

        13.2.3. By End User

    13.3. Market Attractiveness Analysis

        13.3.1. By Country

        13.3.2. By Application

        13.3.3. By End User

    13.4. Key Takeaways

14. Middle East and Africa Market Analysis 2018 to 2022 and Forecast 2023 to 2033, By Country

    14.1. Historical Market Size Value (US$ Million) & Volume (Sq. Feet) Trend Analysis By Market Taxonomy, 2018 to 2022

    14.2. Market Size Value (US$ Million) & Volume (Sq. Feet) Forecast By Market Taxonomy, 2023 to 2033

        14.2.1. By Country

            14.2.1.1. GCC Countries

            14.2.1.2. South Africa

            14.2.1.3. Israel

            14.2.1.4. Rest of MEA

        14.2.2. By Application

        14.2.3. By End User

    14.3. Market Attractiveness Analysis

        14.3.1. By Country

        14.3.2. By Application

        14.3.3. By End User

    14.4. Key Takeaways

15. Key Countries Market Analysis

    15.1. USA

        15.1.1. Pricing Analysis

        15.1.2. Market Share Analysis, 2022

            15.1.2.1. By Application

            15.1.2.2. By End User

    15.2. Canada

        15.2.1. Pricing Analysis

        15.2.2. Market Share Analysis, 2022

            15.2.2.1. By Application

            15.2.2.2. By End User

    15.3. Brazil

        15.3.1. Pricing Analysis

        15.3.2. Market Share Analysis, 2022

            15.3.2.1. By Application

            15.3.2.2. By End User

    15.4. Mexico

        15.4.1. Pricing Analysis

        15.4.2. Market Share Analysis, 2022

            15.4.2.1. By Application

            15.4.2.2. By End User

    15.5. Germany

        15.5.1. Pricing Analysis

        15.5.2. Market Share Analysis, 2022

            15.5.2.1. By Application

            15.5.2.2. By End User

    15.6. UK

        15.6.1. Pricing Analysis

        15.6.2. Market Share Analysis, 2022

            15.6.2.1. By Application

            15.6.2.2. By End User

    15.7. France

        15.7.1. Pricing Analysis

        15.7.2. Market Share Analysis, 2022

            15.7.2.1. By Application

            15.7.2.2. By End User

    15.8. Spain

        15.8.1. Pricing Analysis

        15.8.2. Market Share Analysis, 2022

            15.8.2.1. By Application

            15.8.2.2. By End User

    15.9. Italy

        15.9.1. Pricing Analysis

        15.9.2. Market Share Analysis, 2022

            15.9.2.1. By Application

            15.9.2.2. By End User

    15.10. Poland

        15.10.1. Pricing Analysis

        15.10.2. Market Share Analysis, 2022

            15.10.2.1. By Application

            15.10.2.2. By End User

    15.11. Russia

        15.11.1. Pricing Analysis

        15.11.2. Market Share Analysis, 2022

            15.11.2.1. By Application

            15.11.2.2. By End User

    15.12. Czech Republic

        15.12.1. Pricing Analysis

        15.12.2. Market Share Analysis, 2022

            15.12.2.1. By Application

            15.12.2.2. By End User

    15.13. Romania

        15.13.1. Pricing Analysis

        15.13.2. Market Share Analysis, 2022

            15.13.2.1. By Application

            15.13.2.2. By End User

    15.14. India

        15.14.1. Pricing Analysis

        15.14.2. Market Share Analysis, 2022

            15.14.2.1. By Application

            15.14.2.2. By End User

    15.15. Bangladesh

        15.15.1. Pricing Analysis

        15.15.2. Market Share Analysis, 2022

            15.15.2.1. By Application

            15.15.2.2. By End User

    15.16. Australia

        15.16.1. Pricing Analysis

        15.16.2. Market Share Analysis, 2022

            15.16.2.1. By Application

            15.16.2.2. By End User

    15.17. New Zealand

        15.17.1. Pricing Analysis

        15.17.2. Market Share Analysis, 2022

            15.17.2.1. By Application

            15.17.2.2. By End User

    15.18. China

        15.18.1. Pricing Analysis

        15.18.2. Market Share Analysis, 2022

            15.18.2.1. By Application

            15.18.2.2. By End User

    15.19. Japan

        15.19.1. Pricing Analysis

        15.19.2. Market Share Analysis, 2022

            15.19.2.1. By Application

            15.19.2.2. By End User

    15.20. South Korea

        15.20.1. Pricing Analysis

        15.20.2. Market Share Analysis, 2022

            15.20.2.1. By Application

            15.20.2.2. By End User

    15.21. GCC Countries

        15.21.1. Pricing Analysis

        15.21.2. Market Share Analysis, 2022

            15.21.2.1. By Application

            15.21.2.2. By End User

    15.22. South Africa

        15.22.1. Pricing Analysis

        15.22.2. Market Share Analysis, 2022

            15.22.2.1. By Application

            15.22.2.2. By End User

    15.23. Israel

        15.23.1. Pricing Analysis

        15.23.2. Market Share Analysis, 2022

            15.23.2.1. By Application

            15.23.2.2. By End User

16. Market Structure Analysis

    16.1. Competition Dashboard

    16.2. Competition Benchmarking

    16.3. Market Share Analysis of Top Players

        16.3.1. By Regional

        16.3.2. By Application

        16.3.3. By End User

17. Competition Analysis

    17.1. Competition Deep Dive

        17.1.1. BASF SE

            17.1.1.1. Overview

            17.1.1.2. Product Portfolio

            17.1.1.3. Profitability by Market Segments

            17.1.1.4. Sales Footprint

            17.1.1.5. Strategy Overview

                17.1.1.5.1. Marketing Strategy

                17.1.1.5.2. Product Strategy

                17.1.1.5.3. Channel Strategy

        17.1.2. DowDuPont Inc.

            17.1.2.1. Overview

            17.1.2.2. Product Portfolio

            17.1.2.3. Profitability by Market Segments

            17.1.2.4. Sales Footprint

            17.1.2.5. Strategy Overview

                17.1.2.5.1. Marketing Strategy

                17.1.2.5.2. Product Strategy

                17.1.2.5.3. Channel Strategy

        17.1.3. Owens Corning Insulating Systems, LLC

            17.1.3.1. Overview

            17.1.3.2. Product Portfolio

            17.1.3.3. Profitability by Market Segments

            17.1.3.4. Sales Footprint

            17.1.3.5. Strategy Overview

                17.1.3.5.1. Marketing Strategy

                17.1.3.5.2. Product Strategy

                17.1.3.5.3. Channel Strategy

        17.1.4. SAINT-GOBAIN

            17.1.4.1. Overview

            17.1.4.2. Product Portfolio

            17.1.4.3. Profitability by Market Segments

            17.1.4.4. Sales Footprint

            17.1.4.5. Strategy Overview

                17.1.4.5.1. Marketing Strategy

                17.1.4.5.2. Product Strategy

                17.1.4.5.3. Channel Strategy

        17.1.5. Honeywell International Inc.

            17.1.5.1. Overview

            17.1.5.2. Product Portfolio

            17.1.5.3. Profitability by Market Segments

            17.1.5.4. Sales Footprint

            17.1.5.5. Strategy Overview

                17.1.5.5.1. Marketing Strategy

                17.1.5.5.2. Product Strategy

                17.1.5.5.3. Channel Strategy

        17.1.6. Kingspan Group plc

            17.1.6.1. Overview

            17.1.6.2. Product Portfolio

            17.1.6.3. Profitability by Market Segments

            17.1.6.4. Sales Footprint

            17.1.6.5. Strategy Overview

                17.1.6.5.1. Marketing Strategy

                17.1.6.5.2. Product Strategy

                17.1.6.5.3. Channel Strategy

        17.1.7. Johns Manville Corporation

            17.1.7.1. Overview

            17.1.7.2. Product Portfolio

            17.1.7.3. Profitability by Market Segments

            17.1.7.4. Sales Footprint

            17.1.7.5. Strategy Overview

                17.1.7.5.1. Marketing Strategy

                17.1.7.5.2. Product Strategy

                17.1.7.5.3. Channel Strategy

        17.1.8. Stepan Company

            17.1.8.1. Overview

            17.1.8.2. Product Portfolio

            17.1.8.3. Profitability by Market Segments

            17.1.8.4. Sales Footprint

            17.1.8.5. Strategy Overview

                17.1.8.5.1. Marketing Strategy

                17.1.8.5.2. Product Strategy

                17.1.8.5.3. Channel Strategy

        17.1.9. IKO Industries Ltd.

            17.1.9.1. Overview

            17.1.9.2. Product Portfolio

            17.1.9.3. Profitability by Market Segments

            17.1.9.4. Sales Footprint

            17.1.9.5. Strategy Overview

                17.1.9.5.1. Marketing Strategy

                17.1.9.5.2. Product Strategy

                17.1.9.5.3. Channel Strategy

        17.1.10. Soprema Group

            17.1.10.1. Overview

            17.1.10.2. Product Portfolio

            17.1.10.3. Profitability by Market Segments

            17.1.10.4. Sales Footprint

            17.1.10.5. Strategy Overview

                17.1.10.5.1. Marketing Strategy

                17.1.10.5.2. Product Strategy

                17.1.10.5.3. Channel Strategy

        17.1.11. Knauf Insulation

            17.1.11.1. Overview

            17.1.11.2. Product Portfolio

            17.1.11.3. Profitability by Market Segments

            17.1.11.4. Sales Footprint

            17.1.11.5. Strategy Overview

                17.1.11.5.1. Marketing Strategy

                17.1.11.5.2. Product Strategy

                17.1.11.5.3. Channel Strategy

18. Assumptions & Acronyms Used

19. Research Methodology

Don't pay for what you don't need

Customize your report by selecting specific countries or regions and save 30%!

List of Tables

Table 1: Global Market Value (US$ Million) Forecast by Region, 2018 to 2033

Table 2: Global Market Volume (Sq. Feet) Forecast by Region, 2018 to 2033

Table 3: Global Market Value (US$ Million) Forecast by Application, 2018 to 2033

Table 4: Global Market Volume (Sq. Feet) Forecast by Application, 2018 to 2033

Table 5: Global Market Value (US$ Million) Forecast by End User, 2018 to 2033

Table 6: Global Market Volume (Sq. Feet) Forecast by End User, 2018 to 2033

Table 7: North America Market Value (US$ Million) Forecast by Country, 2018 to 2033

Table 8: North America Market Volume (Sq. Feet) Forecast by Country, 2018 to 2033

Table 9: North America Market Value (US$ Million) Forecast by Application, 2018 to 2033

Table 10: North America Market Volume (Sq. Feet) Forecast by Application, 2018 to 2033

Table 11: North America Market Value (US$ Million) Forecast by End User, 2018 to 2033

Table 12: North America Market Volume (Sq. Feet) Forecast by End User, 2018 to 2033

Table 13: Latin America Market Value (US$ Million) Forecast by Country, 2018 to 2033

Table 14: Latin America Market Volume (Sq. Feet) Forecast by Country, 2018 to 2033

Table 15: Latin America Market Value (US$ Million) Forecast by Application, 2018 to 2033

Table 16: Latin America Market Volume (Sq. Feet) Forecast by Application, 2018 to 2033

Table 17: Latin America Market Value (US$ Million) Forecast by End User, 2018 to 2033

Table 18: Latin America Market Volume (Sq. Feet) Forecast by End User, 2018 to 2033

Table 19: Western Europe Market Value (US$ Million) Forecast by Country, 2018 to 2033

Table 20: Western Europe Market Volume (Sq. Feet) Forecast by Country, 2018 to 2033

Table 21: Western Europe Market Value (US$ Million) Forecast by Application, 2018 to 2033

Table 22: Western Europe Market Volume (Sq. Feet) Forecast by Application, 2018 to 2033

Table 23: Western Europe Market Value (US$ Million) Forecast by End User, 2018 to 2033

Table 24: Western Europe Market Volume (Sq. Feet) Forecast by End User, 2018 to 2033

Table 25: Eastern Europe Market Value (US$ Million) Forecast by Country, 2018 to 2033

Table 26: Eastern Europe Market Volume (Sq. Feet) Forecast by Country, 2018 to 2033

Table 27: Eastern Europe Market Value (US$ Million) Forecast by Application, 2018 to 2033

Table 28: Eastern Europe Market Volume (Sq. Feet) Forecast by Application, 2018 to 2033

Table 29: Eastern Europe Market Value (US$ Million) Forecast by End User, 2018 to 2033

Table 30: Eastern Europe Market Volume (Sq. Feet) Forecast by End User, 2018 to 2033

Table 31: South Asia and Pacific Market Value (US$ Million) Forecast by Country, 2018 to 2033

Table 32: South Asia and Pacific Market Volume (Sq. Feet) Forecast by Country, 2018 to 2033

Table 33: South Asia and Pacific Market Value (US$ Million) Forecast by Application, 2018 to 2033

Table 34: South Asia and Pacific Market Volume (Sq. Feet) Forecast by Application, 2018 to 2033

Table 35: South Asia and Pacific Market Value (US$ Million) Forecast by End User, 2018 to 2033

Table 36: South Asia and Pacific Market Volume (Sq. Feet) Forecast by End User, 2018 to 2033

Table 37: East Asia Market Value (US$ Million) Forecast by Country, 2018 to 2033

Table 38: East Asia Market Volume (Sq. Feet) Forecast by Country, 2018 to 2033

Table 39: East Asia Market Value (US$ Million) Forecast by Application, 2018 to 2033

Table 40: East Asia Market Volume (Sq. Feet) Forecast by Application, 2018 to 2033

Table 41: East Asia Market Value (US$ Million) Forecast by End User, 2018 to 2033

Table 42: East Asia Market Volume (Sq. Feet) Forecast by End User, 2018 to 2033

Table 43: Middle East and Africa Market Value (US$ Million) Forecast by Country, 2018 to 2033

Table 44: Middle East and Africa Market Volume (Sq. Feet) Forecast by Country, 2018 to 2033

Table 45: Middle East and Africa Market Value (US$ Million) Forecast by Application, 2018 to 2033

Table 46: Middle East and Africa Market Volume (Sq. Feet) Forecast by Application, 2018 to 2033

Table 47: Middle East and Africa Market Value (US$ Million) Forecast by End User, 2018 to 2033

Table 48: Middle East and Africa Market Volume (Sq. Feet) Forecast by End User, 2018 to 2033
Nikhil Kaitwade
Nikhil Kaitwade

Principal Consultant

Talk to Analyst

Find your sweet spots for generating winning opportunities in this market.

List of Charts

Figure 1: Global Market Value (US$ Million) by Application, 2023 to 2033

Figure 2: Global Market Value (US$ Million) by End User, 2023 to 2033

Figure 3: Global Market Value (US$ Million) by Region, 2023 to 2033

Figure 4: Global Market Value (US$ Million) Analysis by Region, 2018 to 2033

Figure 5: Global Market Volume (Sq. Feet) Analysis by Region, 2018 to 2033

Figure 6: Global Market Value Share (%) and BPS Analysis by Region, 2023 to 2033

Figure 7: Global Market Y-o-Y Growth (%) Projections by Region, 2023 to 2033

Figure 8: Global Market Value (US$ Million) Analysis by Application, 2018 to 2033

Figure 9: Global Market Volume (Sq. Feet) Analysis by Application, 2018 to 2033

Figure 10: Global Market Value Share (%) and BPS Analysis by Application, 2023 to 2033

Figure 11: Global Market Y-o-Y Growth (%) Projections by Application, 2023 to 2033

Figure 12: Global Market Value (US$ Million) Analysis by End User, 2018 to 2033

Figure 13: Global Market Volume (Sq. Feet) Analysis by End User, 2018 to 2033

Figure 14: Global Market Value Share (%) and BPS Analysis by End User, 2023 to 2033

Figure 15: Global Market Y-o-Y Growth (%) Projections by End User, 2023 to 2033

Figure 16: Global Market Attractiveness by Application, 2023 to 2033

Figure 17: Global Market Attractiveness by End User, 2023 to 2033

Figure 18: Global Market Attractiveness by Region, 2023 to 2033

Figure 19: North America Market Value (US$ Million) by Application, 2023 to 2033

Figure 20: North America Market Value (US$ Million) by End User, 2023 to 2033

Figure 21: North America Market Value (US$ Million) by Country, 2023 to 2033

Figure 22: North America Market Value (US$ Million) Analysis by Country, 2018 to 2033

Figure 23: North America Market Volume (Sq. Feet) Analysis by Country, 2018 to 2033

Figure 24: North America Market Value Share (%) and BPS Analysis by Country, 2023 to 2033

Figure 25: North America Market Y-o-Y Growth (%) Projections by Country, 2023 to 2033

Figure 26: North America Market Value (US$ Million) Analysis by Application, 2018 to 2033

Figure 27: North America Market Volume (Sq. Feet) Analysis by Application, 2018 to 2033

Figure 28: North America Market Value Share (%) and BPS Analysis by Application, 2023 to 2033

Figure 29: North America Market Y-o-Y Growth (%) Projections by Application, 2023 to 2033

Figure 30: North America Market Value (US$ Million) Analysis by End User, 2018 to 2033

Figure 31: North America Market Volume (Sq. Feet) Analysis by End User, 2018 to 2033

Figure 32: North America Market Value Share (%) and BPS Analysis by End User, 2023 to 2033

Figure 33: North America Market Y-o-Y Growth (%) Projections by End User, 2023 to 2033

Figure 34: North America Market Attractiveness by Application, 2023 to 2033

Figure 35: North America Market Attractiveness by End User, 2023 to 2033

Figure 36: North America Market Attractiveness by Country, 2023 to 2033

Figure 37: Latin America Market Value (US$ Million) by Application, 2023 to 2033

Figure 38: Latin America Market Value (US$ Million) by End User, 2023 to 2033

Figure 39: Latin America Market Value (US$ Million) by Country, 2023 to 2033

Figure 40: Latin America Market Value (US$ Million) Analysis by Country, 2018 to 2033

Figure 41: Latin America Market Volume (Sq. Feet) Analysis by Country, 2018 to 2033

Figure 42: Latin America Market Value Share (%) and BPS Analysis by Country, 2023 to 2033

Figure 43: Latin America Market Y-o-Y Growth (%) Projections by Country, 2023 to 2033

Figure 44: Latin America Market Value (US$ Million) Analysis by Application, 2018 to 2033

Figure 45: Latin America Market Volume (Sq. Feet) Analysis by Application, 2018 to 2033

Figure 46: Latin America Market Value Share (%) and BPS Analysis by Application, 2023 to 2033

Figure 47: Latin America Market Y-o-Y Growth (%) Projections by Application, 2023 to 2033

Figure 48: Latin America Market Value (US$ Million) Analysis by End User, 2018 to 2033

Figure 49: Latin America Market Volume (Sq. Feet) Analysis by End User, 2018 to 2033

Figure 50: Latin America Market Value Share (%) and BPS Analysis by End User, 2023 to 2033

Figure 51: Latin America Market Y-o-Y Growth (%) Projections by End User, 2023 to 2033

Figure 52: Latin America Market Attractiveness by Application, 2023 to 2033

Figure 53: Latin America Market Attractiveness by End User, 2023 to 2033

Figure 54: Latin America Market Attractiveness by Country, 2023 to 2033

Figure 55: Western Europe Market Value (US$ Million) by Application, 2023 to 2033

Figure 56: Western Europe Market Value (US$ Million) by End User, 2023 to 2033

Figure 57: Western Europe Market Value (US$ Million) by Country, 2023 to 2033

Figure 58: Western Europe Market Value (US$ Million) Analysis by Country, 2018 to 2033

Figure 59: Western Europe Market Volume (Sq. Feet) Analysis by Country, 2018 to 2033

Figure 60: Western Europe Market Value Share (%) and BPS Analysis by Country, 2023 to 2033

Figure 61: Western Europe Market Y-o-Y Growth (%) Projections by Country, 2023 to 2033

Figure 62: Western Europe Market Value (US$ Million) Analysis by Application, 2018 to 2033

Figure 63: Western Europe Market Volume (Sq. Feet) Analysis by Application, 2018 to 2033

Figure 64: Western Europe Market Value Share (%) and BPS Analysis by Application, 2023 to 2033

Figure 65: Western Europe Market Y-o-Y Growth (%) Projections by Application, 2023 to 2033

Figure 66: Western Europe Market Value (US$ Million) Analysis by End User, 2018 to 2033

Figure 67: Western Europe Market Volume (Sq. Feet) Analysis by End User, 2018 to 2033

Figure 68: Western Europe Market Value Share (%) and BPS Analysis by End User, 2023 to 2033

Figure 69: Western Europe Market Y-o-Y Growth (%) Projections by End User, 2023 to 2033

Figure 70: Western Europe Market Attractiveness by Application, 2023 to 2033

Figure 71: Western Europe Market Attractiveness by End User, 2023 to 2033

Figure 72: Western Europe Market Attractiveness by Country, 2023 to 2033

Figure 73: Eastern Europe Market Value (US$ Million) by Application, 2023 to 2033

Figure 74: Eastern Europe Market Value (US$ Million) by End User, 2023 to 2033

Figure 75: Eastern Europe Market Value (US$ Million) by Country, 2023 to 2033

Figure 76: Eastern Europe Market Value (US$ Million) Analysis by Country, 2018 to 2033

Figure 77: Eastern Europe Market Volume (Sq. Feet) Analysis by Country, 2018 to 2033

Figure 78: Eastern Europe Market Value Share (%) and BPS Analysis by Country, 2023 to 2033

Figure 79: Eastern Europe Market Y-o-Y Growth (%) Projections by Country, 2023 to 2033

Figure 80: Eastern Europe Market Value (US$ Million) Analysis by Application, 2018 to 2033

Figure 81: Eastern Europe Market Volume (Sq. Feet) Analysis by Application, 2018 to 2033

Figure 82: Eastern Europe Market Value Share (%) and BPS Analysis by Application, 2023 to 2033

Figure 83: Eastern Europe Market Y-o-Y Growth (%) Projections by Application, 2023 to 2033

Figure 84: Eastern Europe Market Value (US$ Million) Analysis by End User, 2018 to 2033

Figure 85: Eastern Europe Market Volume (Sq. Feet) Analysis by End User, 2018 to 2033

Figure 86: Eastern Europe Market Value Share (%) and BPS Analysis by End User, 2023 to 2033

Figure 87: Eastern Europe Market Y-o-Y Growth (%) Projections by End User, 2023 to 2033

Figure 88: Eastern Europe Market Attractiveness by Application, 2023 to 2033

Figure 89: Eastern Europe Market Attractiveness by End User, 2023 to 2033

Figure 90: Eastern Europe Market Attractiveness by Country, 2023 to 2033

Figure 91: South Asia and Pacific Market Value (US$ Million) by Application, 2023 to 2033

Figure 92: South Asia and Pacific Market Value (US$ Million) by End User, 2023 to 2033

Figure 93: South Asia and Pacific Market Value (US$ Million) by Country, 2023 to 2033

Figure 94: South Asia and Pacific Market Value (US$ Million) Analysis by Country, 2018 to 2033

Figure 95: South Asia and Pacific Market Volume (Sq. Feet) Analysis by Country, 2018 to 2033

Figure 96: South Asia and Pacific Market Value Share (%) and BPS Analysis by Country, 2023 to 2033

Figure 97: South Asia and Pacific Market Y-o-Y Growth (%) Projections by Country, 2023 to 2033

Figure 98: South Asia and Pacific Market Value (US$ Million) Analysis by Application, 2018 to 2033

Figure 99: South Asia and Pacific Market Volume (Sq. Feet) Analysis by Application, 2018 to 2033

Figure 100: South Asia and Pacific Market Value Share (%) and BPS Analysis by Application, 2023 to 2033

Figure 101: South Asia and Pacific Market Y-o-Y Growth (%) Projections by Application, 2023 to 2033

Figure 102: South Asia and Pacific Market Value (US$ Million) Analysis by End User, 2018 to 2033

Figure 103: South Asia and Pacific Market Volume (Sq. Feet) Analysis by End User, 2018 to 2033

Figure 104: South Asia and Pacific Market Value Share (%) and BPS Analysis by End User, 2023 to 2033

Figure 105: South Asia and Pacific Market Y-o-Y Growth (%) Projections by End User, 2023 to 2033

Figure 106: South Asia and Pacific Market Attractiveness by Application, 2023 to 2033

Figure 107: South Asia and Pacific Market Attractiveness by End User, 2023 to 2033

Figure 108: South Asia and Pacific Market Attractiveness by Country, 2023 to 2033

Figure 109: East Asia Market Value (US$ Million) by Application, 2023 to 2033

Figure 110: East Asia Market Value (US$ Million) by End User, 2023 to 2033

Figure 111: East Asia Market Value (US$ Million) by Country, 2023 to 2033

Figure 112: East Asia Market Value (US$ Million) Analysis by Country, 2018 to 2033

Figure 113: East Asia Market Volume (Sq. Feet) Analysis by Country, 2018 to 2033

Figure 114: East Asia Market Value Share (%) and BPS Analysis by Country, 2023 to 2033

Figure 115: East Asia Market Y-o-Y Growth (%) Projections by Country, 2023 to 2033

Figure 116: East Asia Market Value (US$ Million) Analysis by Application, 2018 to 2033

Figure 117: East Asia Market Volume (Sq. Feet) Analysis by Application, 2018 to 2033

Figure 118: East Asia Market Value Share (%) and BPS Analysis by Application, 2023 to 2033

Figure 119: East Asia Market Y-o-Y Growth (%) Projections by Application, 2023 to 2033

Figure 120: East Asia Market Value (US$ Million) Analysis by End User, 2018 to 2033

Figure 121: East Asia Market Volume (Sq. Feet) Analysis by End User, 2018 to 2033

Figure 122: East Asia Market Value Share (%) and BPS Analysis by End User, 2023 to 2033

Figure 123: East Asia Market Y-o-Y Growth (%) Projections by End User, 2023 to 2033

Figure 124: East Asia Market Attractiveness by Application, 2023 to 2033

Figure 125: East Asia Market Attractiveness by End User, 2023 to 2033

Figure 126: East Asia Market Attractiveness by Country, 2023 to 2033

Figure 127: Middle East and Africa Market Value (US$ Million) by Application, 2023 to 2033

Figure 128: Middle East and Africa Market Value (US$ Million) by End User, 2023 to 2033

Figure 129: Middle East and Africa Market Value (US$ Million) by Country, 2023 to 2033

Figure 130: Middle East and Africa Market Value (US$ Million) Analysis by Country, 2018 to 2033

Figure 131: Middle East and Africa Market Volume (Sq. Feet) Analysis by Country, 2018 to 2033

Figure 132: Middle East and Africa Market Value Share (%) and BPS Analysis by Country, 2023 to 2033

Figure 133: Middle East and Africa Market Y-o-Y Growth (%) Projections by Country, 2023 to 2033

Figure 134: Middle East and Africa Market Value (US$ Million) Analysis by Application, 2018 to 2033

Figure 135: Middle East and Africa Market Volume (Sq. Feet) Analysis by Application, 2018 to 2033

Figure 136: Middle East and Africa Market Value Share (%) and BPS Analysis by Application, 2023 to 2033

Figure 137: Middle East and Africa Market Y-o-Y Growth (%) Projections by Application, 2023 to 2033

Figure 138: Middle East and Africa Market Value (US$ Million) Analysis by End User, 2018 to 2033

Figure 139: Middle East and Africa Market Volume (Sq. Feet) Analysis by End User, 2018 to 2033

Figure 140: Middle East and Africa Market Value Share (%) and BPS Analysis by End User, 2023 to 2033

Figure 141: Middle East and Africa Market Y-o-Y Growth (%) Projections by End User, 2023 to 2033

Figure 142: Middle East and Africa Market Attractiveness by Application, 2023 to 2033

Figure 143: Middle East and Africa Market Attractiveness by End User, 2023 to 2033

Figure 144: Middle East and Africa Market Attractiveness by Country, 2023 to 2033

Recommendations

Chemicals & Materials

Electrical Insulation Materials Market

Published : April 2023

Chemicals & Materials

Building Thermal Insulation Market

Published : October 2022

Explore Chemicals & Materials Insights

View Reports

Polyisocyanurate Insulation Market