

- Market Size (2026)
- USD 640.7 Mn
- Forecast (2036)
- USD 1409.1 Mn
- CAGR (2026 to 2036)
- 8.2%
How big is the Portable Cooling Shelters Market in 2026?
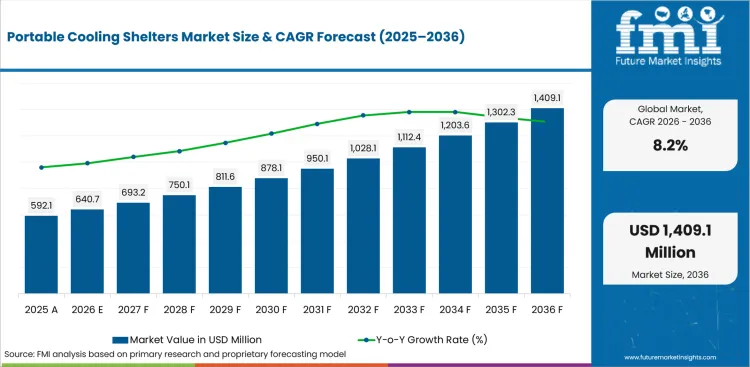
USD 640.7 million in 2026 and USD 1,409.1 million by 2036 at an 8.2% CAGR.
Sales in the portable cooling shelters market are projected to grow at 8.2% CAGR through 2036, driving valuation to USD 1,409.1 million by 2036 from USD 640.7 million in 2026. Heat exposure has moved from a seasonal comfort issue into a site-control problem for outdoor crews and temporary facilities. OSHA stated in August 2024 that its proposed heat rule would help protect about 36 million workers. The rulemaking pressure raises the practical value of cooling tower rentals for sites needing rest areas and cooling zones.
India and China are likely to record stronger adoption as heatwave planning and outdoor workforce exposure increase demand for deployable cooling zones. The United States, Germany and Japan are projected to expand through formal heat plans, worker-safety documentation and service-backed rental coverage. Construction contractors are expected to use portable cooling shelters where heat stress disrupts crew rotation and daily work sequencing.
Construction contractors and site safety managers are expected to adopt portable cooling shelters where heat stress interrupts crew rotation and work sequencing. OSHA's July 2025 heat rulemaking page said the public hearing concluded on July 2, 2025. The concluded hearing keeps formal heat plans inside sourcing reviews for contractors and rental providers. Rental providers that package shelters with industrial cooling systems are expected to reduce setup uncertainty. Practical value comes from giving site teams a cooler recovery space without permanent HVAC work.
| Metric | Value |
|---|---|
| 2025 Market Size | USD 592.1 million |
| 2026 Market Size | USD 640.7 million |
| 2036 Market Size | USD 1,409.1 million |
| Forecast CAGR (2026-2036) | 8.2% |
| Sales Channel Focus | Direct OEM |
| Direct OEM Share (2026) | 45.3% |
| Shelter Type Focus | Inflatable Cooling Shelters |
| Inflatable Cooling Shelters Share (2026) | 38.0% |
| Cooling Method Focus | Evaporative Cooling |
| Evaporative Cooling Share (2026) | 38.0% |
| Fastest-growing Country | India |
| India CAGR by 2036 | 10.5% |
Summary of the Portable Cooling Shelters Market
| Market Signal | Commercial Impact |
|---|---|
| Demand and Growth Drivers | Heat exposure and schedule loss are expected to push spending toward portable cooling shelters. Documentation needs are projected to make contractors verify shelter capacity before repeat rental use.
|
| Product and Segment View | Direct OEM, inflatable cooling shelters and evaporative cooling are expected to lead their parent categories in 2026. The mix reflects a channel need for service control and fast site setup.
|
| Geography and Growth Outlook | India and China are projected to form the higher-growth tier due to heat exposure and large worksite populations. Established markets are expected to expand under documentation-led purchasing cycles.
|
| Competitive Landscape | Competition is moderately concentrated around rental access and temporary structure know-how. Source validation are expected to center on setup speed, climate equipment fit and service continuity.
|
| Analyst Perspective | Portable cooling shelters are shifting from comfort equipment into work-continuity infrastructure for exposed crews. Buyers will separate vendors by how well each package fits recovery routines, utility limits and urgent field mobilization.
|
Source: FMI's proprietary forecasting model and primary research
How is the Portable Cooling Shelters Market segmented?
The portable cooling shelters industry is segmented by shelter type, cooling method, application, end use, sales channel, and region.
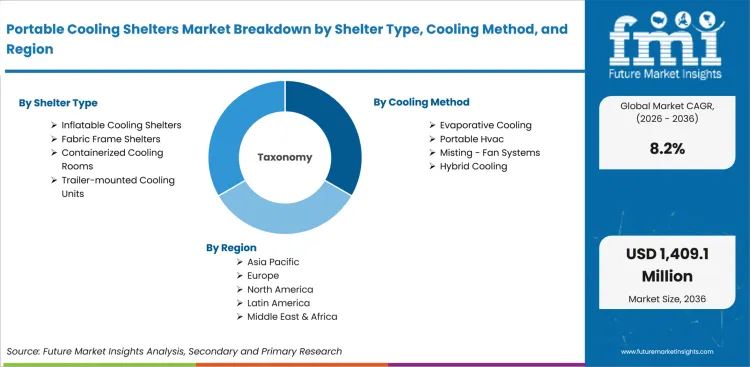
The portable cooling shelters market is segmented by shelter type, cooling method, application, end use, sales channel, and region. By shelter type, the market covers inflatable cooling shelters, fabric frame shelters, containerized cooling rooms, and trailer-mounted cooling units. By cooling method, it covers evaporative cooling, portable HVAC, misting and fan systems, and hybrid cooling. By application, it covers heat stress management, emergency response, construction sites, and military or field operations. By end use, it covers construction, oil and gas or mining, events or sports, and disaster response. By sales channel, it covers rental providers and direct OEM routes that support planned site programs. Safety equipment distributors complete the channel scope for contractor-led sourcing in remote project sites. Regional coverage links this scope to adjacent equipment rental services demand across temporary infrastructure programs.
How does direct OEM shape purchasing within the sales channel category?
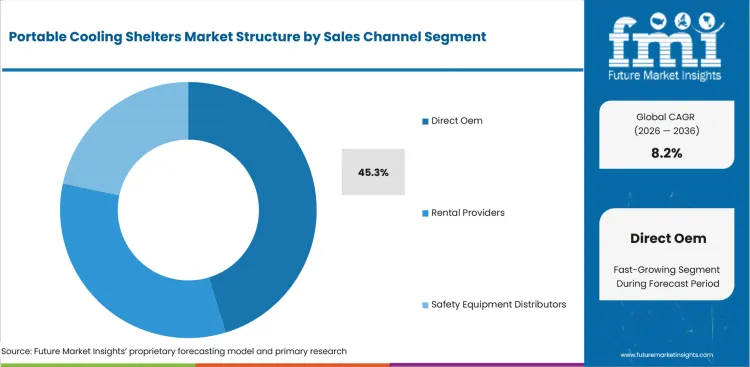
Large field programs need accountable channel control before shelters are used across multiple work areas. United Rentals states that its climate solutions include delivery and installation support for HVAC equipment. The same page also describes setup and commissioning, which makes service ownership visible before field use. Direct OEM routes are valuable for operations teams that need one responsible party for specification, delivery and support.
- By sales channel, direct OEM is projected to account for 45.3% share in 2026 driven by specification control and service escalation. United Rentals identifies 24/7 climate support on its official climate solutions page, which supports direct-channel selection for emergency cooling and planned shutdown projects.
- Direct OEM demand is expected to grow among construction contractors attributable to approval routines that require one named party for delivery and commissioning. Contractors comparing construction equipment planning need fewer handoffs before a shelter enters site safety plans.
What supports inflatable cooling shelters within the shelter type category?
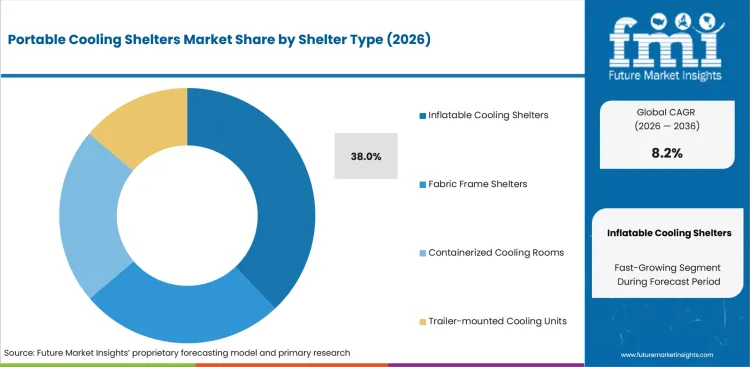
Temporary work zones often lack permanent pads and fixed utility connections during early project stages. Inflatable cooling shelters answer that problem by reducing transport bulk and setup time compared with heavier frame systems. OSHA heat rulemaking remains visible in 2025, so safety managers need cooling spaces that match changing work fronts.
- The shelter type category is estimated to be led by inflatable cooling shelters at 38.0% share in 2026 owing to fast staging and compact storage. OSHA noted in July 2025 that heat rulemaking hearings had concluded, which keeps portable recovery infrastructure inside contractor planning files.
- Inflatable shelter demand is expected to rise in temporary construction zones supported by quick relocation and lower installation burden. Project owners prefer formats that move alongside crews and avoid permanent HVAC work during phased site development.
How is evaporative cooling positioned within the cooling method category?
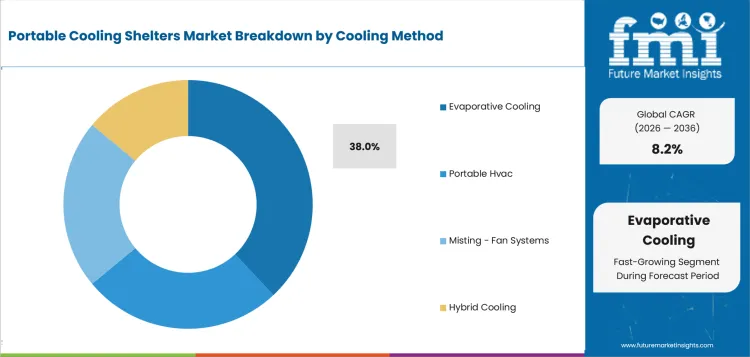
Dry and semi-dry worksites often need cooling that avoids high electrical loads during temporary operation. Evaporative systems fit those conditions by moving air across wetted media and lowering heat stress in open or ventilated zones. United Rentals lists evaporative coolers alongside portable air conditioners and spot coolers in climate-control rentals. The equipment mix allows rental providers to size shelters by humidity and power access before crews enter exposed areas.
- By cooling method, evaporative cooling is forecast to represent 38.0% share in 2026 supported by lower power demand and dry-climate suitability. United Rentals lists evaporative coolers in its climate-control fleet, which reinforces the method in rapid rental packages for hot field sites.
- Purchase activity for evaporative cooling is anticipated to rise driven by rental accounts that need lower power draw and easier water-based cooling. Site managers linking evaporative cooling demand to shelter programs still review humidity limits before buying approval.
What drives heat stress management within the application category?
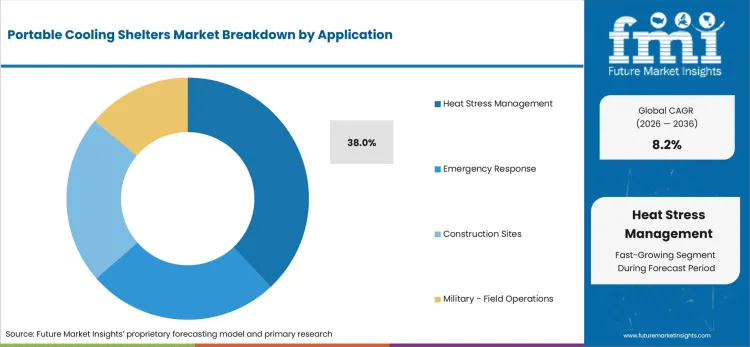
Heat stress management is moving into formal site planning due to worker safety expectations and schedule risk. OSHA identifies heavy physical activity, hot environments and limited acclimatization as occupational heat illness risk factors. Portable shelters help safety managers add shaded or cooled recovery zones near exposed crews. The application has practical value in outdoor work due to the influence of rest-space location on heat-control use.
- The application category is likely to be led by heat stress management at 38.0% share in 2026 due to worker recovery needs. OSHA identifies heavy physical activity and hot environments as occupational heat risk factors, which raises the need for shelters near exposed crews.
- Heat stress management shelters are drawing attention from site safety managers shaped by rest-break design and proximity to work fronts. Sourcing teams use heat plans to decide whether cooling shelters reduce site disruption during peak-temperature periods.
How do contractors evaluate construction within the end use category?
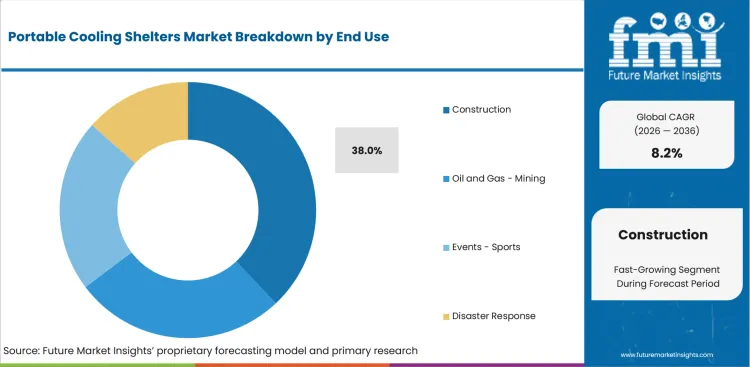
Construction sites concentrate outdoor labor, temporary utilities and shifting work areas inside one operating environment. HSE reported in July 2025 that 35 fatal injuries occurred in Great Britain construction during 2024 to 2025, which keeps safety management visible in contractor reviews. Portable cooling shelters help contractors address heat exposure without waiting for permanent building systems. The end-use case depends on setup speed, moving access and field service reach during exposed work shifts.
- Based on end use, construction is set to lead demand with 38.0% share in 2026 attributable to outdoor crew exposure and schedule protection. HSE reported 35 construction worker fatalities during 2024 to 2025, which keeps safety controls inside contractor planning and site review processes.
- Construction contractors are expected to favor portable shelters over fixed cooling alternatives due to work-front movement and temporary power limits. Site teams connected to construction power rental also compare generator access before shelter installation.
What are the drivers, restraints, and opportunities in the Portable Cooling Shelters Market?
Near-term purchases are being shaped by heat-safety planning and service ownership limits. Rental-led deployment routes form the access path outlined below.
- Driver: Heat-safety planning is expected to push contractors toward shelters that place cooled recovery zones near exposed crews.
- Restraint: Adoption is anticipated to slow where projects lack power access, water access or a clear service owner.
- Opportunity: Rental-led bundles are projected to open access where shelters need cooling equipment, power and field support together.
Outdoor work programs are expected to raise shelter demand where heat plans need visible controls near crews. OSHA reported in July 2025 that the heat rulemaking public hearing had concluded. The completed hearing keeps heat-control documentation visible before contractors add cooling shelters to site plans. Shelter packages become easier to approve when they reduce travel time between work fronts and recovery zones.
Implementation gaps are likely to slow purchases where temporary utilities and project responsibility remain unclear. BLS reported in February 2026 that 5,070 fatal work injuries occurred in the United States in 2024. Safety managers interpret that risk environment carefully before adding new field equipment to worksite recovery plans. Portable cooling shelters need defined ownership for delivery, anchoring and maintenance before project teams place them into repeat rental schedules.
Rental providers are forecast to convert service gaps into bundled cooling opportunities for contractors and emergency agencies. Aggreko highlighted water-saving temporary cooling technologies in March 2025, which points to equipment packages designed for constrained sites. These bundles align with power equipment rental programs that pair temporary climate control with field power.
Which country CAGRs are profiled in the Portable Cooling Shelters Market?
.webp "Top Country Growth Comparison Portable Cooling Shelters Market Cagr (2026 2036)")
| Country | CAGR |
|---|---|
| United States | 7.3% |
| China | 9.5% |
| India | 10.5% |
| Germany | 6.9% |
| United Kingdom | 7.1% |
| Japan | 6.7% |
| South Korea | 8.0% |
Source: FMI's proprietary forecasting model and primary research
How do country-level CAGRs compare in the Portable Cooling Shelters Market?
Country growth is expected to split between heat-exposed workforces and documentation-led procurement systems across major construction economies. India is projected at 10.5% CAGR and China at 9.5% CAGR due to larger outdoor workforces and faster site deployment needs. Rest of World is estimated at 8.5% CAGR while South Korea records 8.0% CAGR. The United States is forecast at 7.3% CAGR and the United Kingdom at 7.1% CAGR due to safety governance. Germany and Japan are anticipated to remain steadier at 6.9% and 6.7% CAGR due to qualification discipline.
- OSHA heat rulemaking has placed portable cooling shelters closer to formal jobsite safety planning. United States demand is anticipated to advance at 7.3% CAGR over the assessment period, driven by employer attention to rest areas and heat controls. The Bureau of Labor Statistics reported in November 2025 that private industry employers recorded 2.5 million nonfatal workplace injuries and illnesses in 2024. Injury exposure keeps contractor safety teams focused on rest areas and recovery points near crews. Rental providers with national service lines are expected to receive closer review before summer work peaks.
- Construction scale remains the core adoption signal for portable cooling shelters in China during multi-site contractor planning. Portable cooling shelter demand in China is forecast to rise at 9.5% CAGR over the forecast period, supported by fast worksite mobilization and broad contractor networks. The National Bureau of Statistics reported in February 2025 that construction value added reached 8,994.9 billion yuan in 2024. Large project exposure supports demand for movable cooling zones near temporary work fronts and staging areas. Local distributors with fast delivery are expected to draw attention where construction schedules compress.
- Heat advisories now remain directly inside worker protection discussions across Indian states and union territories. Adoption of portable cooling shelters in India is estimated to expand at 10.5% CAGR through 2036, owing to heatwave planning and outdoor labor exposure. The Press Information Bureau reported in April 2026 that the Labour Ministry issued advisories to all States/UTs. The advisory scope creates a practical route for site rest areas across public and private worksites. Contractors are expected to favor vendors that offer low-maintenance shelters before peak summer work cycles.
- Germany combines tighter safety review with cautious project spending in construction and industrial maintenance. The German portable cooling shelters sector is projected to record 6.9% CAGR during the assessment period, shaped by specification review and careful rental approval. Destatis reported in February 2026 that construction production declined by 1.7% in 2025. The construction slowdown keeps procurement focused on rental flexibility and verified field value before wider supplier approval. Vendors with documented installation records are expected to receive stronger consideration in contractor accounts.
- United Kingdom contractors are weighing temporary cooling shelters against broader construction safety and site continuity expectations. Portable cooling shelter sales in the United Kingdom are forecast to expand at 7.1% CAGR by 2036, led by safety governance and event-site planning. HSE reported in July 2025 that construction recorded 35 worker fatal injuries during 2024 to 2025. The fatality evidence keeps temporary site controls inside contractor reviews during summer project planning. Rental providers are expected to concentrate offers around service access before summer outdoor programs.
- Japan has turned workplace heatstroke prevention into a more formal employer duty after severe summer outcomes. Japan is estimated to post 6.7% CAGR over the forecast period, influenced by workplace heatstroke controls and cautious vendor screening. Japan's labour ministry reported in May 2026 that workplace heatstroke casualties reached 1,803 in 2025. The workplace record creates demand for cooling shelters near outdoor work and contractor rest areas. Shelter providers with clear alert procedures and field setup support are expected to receive closer review.
- South Korea combines humid summers with compact jobsite networks that expose vendors to fast performance feedback. In South Korea, portable cooling shelter demand is predicted to advance at 8.0% CAGR through 2036. Heat illness surveillance and industrial safety outreach support the outlook for contractor and event-site adoption. KDCA reported in November 2024 that summer heat-related illness cases reached 3,704 during surveillance. The heat illness burden supports cooling zones for outdoor crews and public events during hot-weather operations. Providers with rapid response teams are expected to fit accounts that require short-notice deployment.
Who are the notable companies in the Portable Cooling Shelters Market?
United Rentals, Sunbelt Rentals, Aggreko, Alaska Structures, Losberger De Boer, HDT Global, Mahaffey USA, Portacool, and Polar King are the notable companies shaping this market.
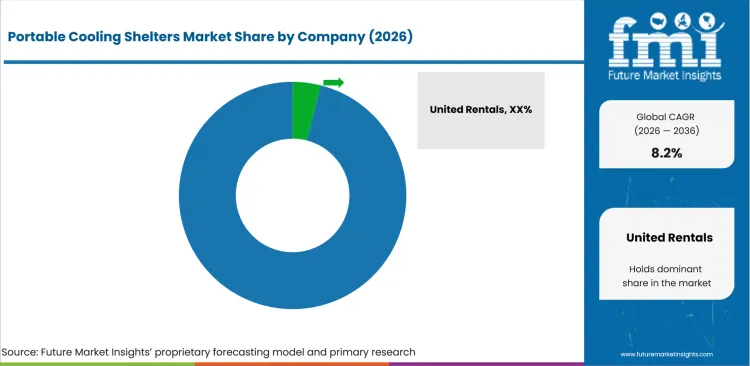
Competition is moderately concentrated around rental access, engineered shelter supply and cooling-equipment fit across temporary infrastructure accounts. Large rental providers hold account access through branch coverage and field service teams that support short-notice deployment. Structure specialists compete where project owners need shelter durability, anchoring knowledge and rapid staging. Equipment makers compete on evaporative cooling familiarity and insulated temporary units for narrower field applications. Competition centers on setup speed and load sizing inside critical power and cooling planning.
- Branch density shapes the first competitive role in this market during emergency cooling and seasonal site programs. United Rentals and Sunbelt Rentals serve contractors that need cooling equipment and rental support across multiple jobsites. Their advantage is the ability to combine delivery, setup and emergency response under one account relationship. Procurement teams use those networks to reduce coordination work during heat events and planned shutdowns.
- Temporary power and cooling integration creates a separate role for Aggreko in industrial maintenance settings. Industrial shutdown managers need cooling shelters that operate beside generators, chillers and temporary electrical service. Aggreko competes where a shelter program is part of a larger continuity plan for field operations. Plant engineers value fewer handoffs during planned maintenance and emergency recovery that require temporary cooling.
- Engineered shelter knowledge separates Alaska Structures and Losberger De Boer from basic equipment rental options. HDT Global and Mahaffey USA support field programs that need fabric strength and deployment guidance. Emergency agencies and military field teams often compare shelter durability before adding cooling equipment. The choice depends on mission length and site exposure during military or emergency field deployments.
- Evaporative and insulated equipment familiarity gives Portacool and Polar King a role in narrower specification decisions. Portacool supports accounts that need spot cooling in ventilated spaces near exposed crews. Polar King fits accounts that need insulated portable rooms for controlled storage or worker relief. These providers are practical where cooling performance is the central procurement question for a narrow application.
Competitive Benchmarking: Portable Cooling Shelters Market
| Company | Cooling Shelter Relevance | Service Capability | Project Support | Footprint |
|---|---|---|---|---|
| United Rentals | High | High | Strong | Global |
| Sunbelt Rentals | High | High | Strong | Global |
| Aggreko | Strong | High | Strong | Global |
| Alaska Structures | High | Medium | Strong | Regional |
| Losberger De Boer | Strong | Medium | Strong | Global |
| HDT Global | High | High | Strong | Global |
| Mahaffey USA | High | Medium | Strong | Regional |
| Portacool | Medium | High | Medium | Global |
| Polar King | Medium | Medium | Medium | Regional |
Source: Future Market Insights competitive analysis, 2026. Ratings reflect relative portfolio relevance and workflow fit. Service capability and geographic reach shape the remaining comparison.
Key Developments in the Portable Cooling Shelters Market
- March 2026 - Sunbelt Rentals presented climate control as part of its specialty rental portfolio during its Investor Day. The presentation listed air conditioners and chillers inside the climate control category. It also referenced cooling towers and boilers for broader temperature-control programs. The development is expected to sharpen account access for portable cooling shelters that need rental support during seasonal peaks. Procurement teams are expected to compare shelter access against climate fleet depth before approving repeat rentals.
- March 2025 - Aggreko highlighted water-saving technologies and temporary cooling solutions for data center operators. The company framed temporary cooling as a way to manage constrained water access during utility-limited projects. The theme connects industrial projects to industrial water cooling systems that face similar utility limits.
- September 2024 - Aggreko launched mid-sized battery energy storage units across the Asia-Pacific region for temporary site operations. The 500 kW and 250 kWh systems were described as integrated plug-and-play units for demanding situations. The development supports portable cooling shelters where temporary power stability affects cooling reliability in remote projects. Project teams are expected to value paired power and cooling support in remote sites.
Key Players in the Portable Cooling Shelters Market
Rental and temporary infrastructure suppliers
- United Rentals
- Sunbelt Rentals
- Aggreko
Shelter and structure providers
- Alaska Structures
- Losberger De Boer
- HDT Global
- Mahaffey USA
Cooling equipment suppliers
- Portacool
- Polar King
Portable Cooling Shelters Market - Report Scope
| Coverage field | Report scope |
|---|---|
| Market breakdown | Portable Cooling Shelters Market Breakdown By Shelter Type, Cooling Method, Application, End Use, Sales Channel, and Region |
| Market Definition | Portable cooling shelters are temporary field structures fitted with cooling equipment to provide heat relief and controlled rest areas for contractors, event operators and emergency teams. |
| Regions Covered | North America, Latin America, Europe, East Asia, South Asia and Pacific, and Middle East and Africa |
| Countries Covered | United States, China, India, Germany, United Kingdom, Japan, South Korea, and 30+ countries |
| Key Companies Profiled | United Rentals, Sunbelt Rentals, Aggreko, Alaska Structures, Losberger De Boer, HDT Global, Mahaffey USA, Portacool, and Polar King |
| Forecast Period | 2026 to 2036 |
| Approach | Hybrid bottom-up and top-down methodology using shelter deployment rates, heat-stress use cases, rental channel depth and cooling equipment mix. |
Source: Future Market Insights - analysis driven by proprietary forecasting models and primary research
Portable Cooling Shelters Market - Research Methodology
| Method | Approach |
|---|---|
| Primary Research | Primary interviews covered construction safety managers, rental fleet managers and plant maintenance engineers using temporary cooling shelters. Event operators and emergency response planners were interviewed to test setup timing, cooling capacity and service ownership. Discussions focused on heat-plan documentation and site utility limits. Delivery expectations and repeat rental approval were also reviewed across seasonal work programs. Interview notes also tested safety-manager expectations for crew rest zones and delivery escalation. |
| Desk Research | Desk research reviewed OSHA heat rulemaking, national injury statistics and official worker heat guidance. Company pages were checked for climate-control equipment, temporary structures and field support claims. Government and standards sources were screened for post-2024 worker safety or construction evidence. Product relevance was verified against cooling function, setup route and target field use. Official heat advisories were matched to shelter use cases and end-use environments. |
| Market Sizing and Forecasting | Market sizing used a hybrid bottom-up and top-down model across shelter formats and cooling methods. Rental penetration, direct OEM access and end-use exposure were tested against country heat conditions and construction activity. Forecast assumptions were adjusted for inflatable shelter share, evaporative cooling fit and service availability. Country outputs were reconciled against total 2026 and 2036 values. Sensitivity checks tested humidity limits and short-notice deployment needs across regions. |
| Data Validation | Data validation compared forecasts against official heat-safety actions, worker injury indicators and construction activity signals in profiled countries. Supplier portfolios were reviewed to avoid counting adjacent tents, HVAC rentals or cold rooms without direct shelter relevance. Segment totals were cross-checked against parent shares, channel logic and vendor capability before final calibration. Manual checks reviewed whether evidence linked directly to heat-relief shelter deployment. |
Source: Future Market Insights (FMI) analysis, based on proprietary forecasting model and primary research
Portable Cooling Shelters Market by Segments
Portable Cooling Shelters Market segmented by Shelter Type:
- Inflatable Cooling Shelters
- Fabric Frame Shelters
- Containerized Cooling Rooms
- Trailer-mounted Cooling Units
Portable Cooling Shelters Market segmented by Cooling Method:
- Evaporative Cooling
- Portable HVAC
- Misting / Fan Systems
- Hybrid Cooling
Portable Cooling Shelters Market segmented by Application:
- Heat Stress Management
- Emergency Response
- Construction Sites
- Military / Field Operations
Portable Cooling Shelters Market segmented by End Use:
- Construction
- Oil and Gas / Mining
- Events / Sports
- Disaster Response
Portable Cooling Shelters Market segmented by Sales Channel:
- Rental Providers
- Direct OEM
- Safety Equipment Distributors
Portable Cooling Shelters Market by Region:
- North America
- United States
- Canada
- Latin America
- Brazil
- Mexico
- Rest of Latin America
- Europe
- Germany
- United Kingdom
- France
- Italy
- Spain
- Rest of Europe
- East Asia
- China
- Japan
- South Korea
- South Asia and Pacific
- India
- ASEAN
- Australia and New Zealand
- Rest of South Asia and Pacific
- Middle East and Africa
- GCC Countries
- South Africa
- Rest of Middle East and Africa
Research Sources and Bibliography
- USA Department of Labor. (2024, August). Biden-Harris administration’s proposed rule to protect indoor, outdoor workers from extreme heat. Occupational Safety and Health Administration.
- Occupational Safety and Health Administration. (2025, July). Heat Injury and Illness Prevention in Outdoor and Indoor Work Settings. USA Department of Labor.
- USA Bureau of Labor Statistics. (2025, November). Employer-Reported Workplace Injuries and Illnesses, 2024. USA Bureau of Labor Statistics.
- USA Bureau of Labor Statistics. (2026, February). Census of Fatal Occupational Injuries Summary, 2024. USA Bureau of Labor Statistics.
- World Health Organization and World Meteorological Organization. (2025, August). WHO, WMO issue new report and guidance to protect workers from increasing heat stress. World Health Organization.
- Press Information Bureau. (2026, April). Ministry of Labour & Employment Issues Nationwide Heatwave Advisory to Protect Workers and Labourers. Government of India.
- India Meteorological Department. (2026, March). India Meteorological Department (IMD) Annual Report 2025. Ministry of Earth Sciences.
- National Bureau of Statistics of China. (2025, February). Statistical Communiqué of the People’s Republic of China on the 2024 National Economic and Social Development. National Bureau of Statistics of China.
- Destatis. (2026, February). Production in December 2025: -1.9% on the previous month. German Federal Statistical Office.
- Health and Safety Executive. (2025, July). Construction: July 2025 news and updates. Health and Safety Executive.
- Health and Safety Executive. (2025, November). Key figures for Great Britain 2024 to 2025. Health and Safety Executive.
- Ministry of Health, Labour and Welfare. (2026, May). STOP! Heatstroke Cool Work Campaign. Government of Japan.
- Korea Disease Control and Prevention Agency. (2024, November). The ER visits for heat-related illness (HRI) increased by 31.4% from last year. KDCA.
- Korea Occupational Safety and Health Agency. (2025, June). KOSHA News Vol. 135. KOSHA.
- United Rentals. (2026, accessed July). Temporary Climate Control & Commercial HVAC Solutions. United Rentals.
- Sunbelt Rentals. (2026, March). Investor Day 2026. Sunbelt Rentals.
- Ashtead Group. (2025, July). Ashtead Annual Report & Accounts 2025. Ashtead Group.
- Aggreko. (2025, March). Aggreko highlights water saving technologies amid concerns of shortages. Aggreko.
- Aggreko. (2024, September). New model BESS now available in Asia-Pacific Region. Aggreko.
- Alaska Structures. (2026, accessed July). Official product and shelter portfolio information. Alaska Structures.
- Losberger De Boer. (2026, accessed July). Official product and structure portfolio information. Losberger De Boer.
- HDT Global. (2026, accessed July). Official shelter and expeditionary systems portfolio information. HDT Global.
- Mahaffey USA. (2026, accessed July). Official temporary structure portfolio information. Mahaffey USA.
- Portacool. (2026, accessed July). Official evaporative cooling product portfolio information. Portacool.
- Polar King. (2026, accessed July). Official portable walk-in and cooling product portfolio information. Polar King.
The bibliography is provided for reader reference and uses primary government sources. It also uses standards-body, official trade body and company sources.
This Report Answers
- What value is forecast for the Portable Cooling Shelters Market in 2026 and by 2036?
- What CAGR is forecast for the Portable Cooling Shelters Market during the 2026 to 2036 ?
- Which segment positions shape demand across shelter type and cooling method alongside application end use and sales channel?
- Which site safety and deployment pressures support adoption or purchase activity?
- How do country CAGRs differ across the profiled markets?
- Which companies compete across rental access, shelter engineering and cooling equipment fit?
- How does FMI validate forecasts using hybrid bottom-up and top-down methodology?
- What factors should procurement teams address before broader account expansion or sourcing commitment?
- How do heat-safety rules, documentation and service ownership affect vendor selection?
Frequently Asked Questions
What is driving growth in the Portable Cooling Shelters Market?
Growth is being driven by heat-safety planning and the need for cooled recovery zones near exposed crews. Construction, maintenance and emergency response users need deployable shelter options.
Who are the key players in the Portable Cooling Shelters Market?
Key players include United Rentals and Sunbelt Rentals; Aggreko; Alaska Structures and Losberger De Boer; HDT Global; Portacool and Polar King. Competition centers on setup speed, climate fit and service continuity.
What is a significant restraint in the Portable Cooling Shelters Market?
A significant restraint is limited site readiness for temporary cooling deployment. Projects may delay adoption when power, water or service ownership is unclear.
Why should executives track the Portable Cooling Shelters Market?
Executives should track this category due to heat exposure now affecting worker safety plans and project continuity. Shelter access influences how contractors manage rest breaks, schedule protection and temporary climate control.
What business problem does the Portable Cooling Shelters Market address?
The market addresses heat exposure in sites that lack permanent cooling infrastructure. Portable shelters give crews or responders a nearby recovery zone during outdoor work and emergency staging.
What should procurement leaders evaluate before selecting suppliers?
Procurement leaders should assess shelter setup time and anchoring method before supplier approval. Cooling capacity and field service coverage should guide broader rollout. Rental terms and power or water access should be checked before contract expansion.
What limits return on investment for buyers?
Return on investment is often limited by poor site planning and unclear service ownership. Cooling performance also suffers if humidity, shelter placement or power access is not tested first.
How do suppliers build long-term account confidence?
Suppliers should provide sizing guidance, installation records and responsive service contacts before peak heat periods. Documented field support helps procurement teams approve repeat rental or OEM orders.
Preview the report firsthand - request a free sample
Get SampleGet the brochure for pricing and purchase details.
Get PDFTable of Content
- Key Takeaways
- Market Size and CAGR
- Top Growth Driver
- Fastest Growing Segment
- Leading Region
- Key Companies
- Emerging Opportunities
- Executive Summary
- Global Market Outlook
- Demand-side Trends
- Supply-side Trends
- Technology Roadmap Analysis
- Analysis and Recommendations
- Analyst Perspective (What is happening? Why now? What should investors know?)
- Key Questions Answered
- How large is the market?
- What is the CAGR?
- What are key trends?
- Which region dominates?
- Who are the leaders?
- Market Overview
- Market Coverage / Taxonomy
- Market Definition / Scope / Limitations
- Research Methodology
- Chapter Orientation
- Analytical Lens and Working Hypotheses
- Market Structure, Signals, and Trend Drivers
- Benchmarking and Cross-market Comparability
- Market Sizing, Forecasting, and Opportunity Mapping
- Research Design and Evidence Framework
- Desk Research Programme (Secondary Evidence)
- Expert Input and Fieldwork (Primary Evidence)
- Tooling, Models, and Reference Databases
- Data Engineering and Model Build
- Quality Assurance and Audit Trail
- Market Background
- Market Dynamics (Drivers, Restraints, Opportunity, Trends)
- Scenario Forecast (Optimistic, Likely, Conservative)
- Impact Analysis
- AI Impact
- Sustainability Impact
- Regulatory Impact
- Technology Impact
- Consumer / Buyer Analysis
- Purchase Drivers
- Adoption Barriers
- Buyer Journey
- Opportunity Map Analysis
- Product Life Cycle Analysis
- Supply Chain Analysis
- Investment Feasibility Matrix
- Value Chain Analysis
- PESTLE and Porter's Analysis
- Regulatory Landscape
- Regional Parent Market Outlook
- Production and Consumption Statistics
- Import and Export Statistics
- Global Market Analysis and Forecast, 2021 to 2036
- Historical Market Size Value (USD Million) & Volume (Unit) Analysis, 2021 to 2025
- Current and Future Market Size Value (USD Million) & Volume (Unit) Projections, 2026 to 2036
- Y-o-Y Growth Trend Analysis
- Absolute $ Opportunity Analysis
- Global Market Pricing Analysis, 2021 to 2036
- Global Market Analysis and Forecast, By Shelter Type, 2021 to 2036
- Introduction / Key Findings
- Historical Market Size Value (USD Million) & Volume (Unit) Analysis By Shelter Type, 2021 to 2025
- Current and Future Market Size Value (USD Million) & Volume (Unit) Analysis and Forecast By Shelter Type, 2026 to 2036
- Inflatable Cooling Shelters
- Fabric Frame Shelters
- Containerized Cooling Rooms
- Trailer-mounted Cooling Value (USD Million) & Volume (Unit)s
- Inflatable Cooling Shelters
- Y-o-Y Growth Trend Analysis By Shelter Type, 2021 to 2025
- Absolute $ Opportunity Analysis By Shelter Type, 2026 to 2036
- Global Market Analysis and Forecast, By Cooling Method, 2021 to 2036
- Introduction / Key Findings
- Historical Market Size Value (USD Million) & Volume (Unit) Analysis By Cooling Method, 2021 to 2025
- Current and Future Market Size Value (USD Million) & Volume (Unit) Analysis and Forecast By Cooling Method, 2026 to 2036
- Evaporative Cooling
- Portable Hvac
- Misting - Fan Systems
- Hybrid Cooling
- Evaporative Cooling
- Y-o-Y Growth Trend Analysis By Cooling Method, 2021 to 2025
- Absolute $ Opportunity Analysis By Cooling Method, 2026 to 2036
- Global Market Analysis and Forecast, By Application, 2021 to 2036
- Introduction / Key Findings
- Historical Market Size Value (USD Million) & Volume (Unit) Analysis By Application, 2021 to 2025
- Current and Future Market Size Value (USD Million) & Volume (Unit) Analysis and Forecast By Application, 2026 to 2036
- Heat Stress Management
- Emergency Response
- Construction Sites
- Military - Field Operations
- Heat Stress Management
- Y-o-Y Growth Trend Analysis By Application, 2021 to 2025
- Absolute $ Opportunity Analysis By Application, 2026 to 2036
- Global Market Analysis and Forecast, By End Use, 2021 to 2036
- Introduction / Key Findings
- Historical Market Size Value (USD Million) & Volume (Unit) Analysis By End Use, 2021 to 2025
- Current and Future Market Size Value (USD Million) & Volume (Unit) Analysis and Forecast By End Use, 2026 to 2036
- Construction
- Oil and Gas - Mining
- Events - Sports
- Disaster Response
- Construction
- Y-o-Y Growth Trend Analysis By End Use, 2021 to 2025
- Absolute $ Opportunity Analysis By End Use, 2026 to 2036
- Global Market Analysis and Forecast, By Sales Channel, 2021 to 2036
- Introduction / Key Findings
- Historical Market Size Value (USD Million) & Volume (Unit) Analysis By Sales Channel, 2021 to 2025
- Current and Future Market Size Value (USD Million) & Volume (Unit) Analysis and Forecast By Sales Channel, 2026 to 2036
- Direct Oem
- Rental Providers
- Safety Equipment Distributors
- Direct Oem
- Y-o-Y Growth Trend Analysis By Sales Channel, 2021 to 2025
- Absolute $ Opportunity Analysis By Sales Channel, 2026 to 2036
- Global Market Analysis and Forecast, By Region, 2021 to 2036
- Introduction
- Historical Market Size Value (USD Million) & Volume (Unit) Analysis By Region, 2021 to 2025
- Current Market Size Value (USD Million) & Volume (Unit) Analysis and Forecast By Region, 2026 to 2036
- North America
- Latin America
- Western Europe
- Eastern Europe
- East Asia
- South Asia and Pacific
- Middle East & Africa
- Market Attractiveness Analysis By Region
- North America Market Analysis and Forecast, By Country, 2021 to 2036
- Historical Market Size Value (USD Million) & Volume (Unit) Trend Analysis By Market Taxonomy, 2021 to 2025
- Market Size Value (USD Million) & Volume (Unit) Forecast By Market Taxonomy, 2026 to 2036
- By Country
- USA
- Canada
- Mexico
- By Shelter Type
- By Cooling Method
- By Application
- By End Use
- By Sales Channel
- By Country
- Market Attractiveness Analysis
- By Country
- By Shelter Type
- By Cooling Method
- By Application
- By End Use
- By Sales Channel
- Key Takeaways
- Latin America Market Analysis and Forecast, By Country
- Historical Market Size Value (USD Million) & Volume (Unit) Trend Analysis By Market Taxonomy, 2021 to 2025
- Market Size Value (USD Million) & Volume (Unit) Forecast By Market Taxonomy, 2026 to 2036
- By Country
- Brazil
- Chile
- Rest of Latin America
- By Shelter Type
- By Cooling Method
- By Application
- By End Use
- By Sales Channel
- By Country
- Market Attractiveness Analysis
- By Country
- By Shelter Type
- By Cooling Method
- By Application
- By End Use
- By Sales Channel
- Key Takeaways
- Western Europe Market Analysis and Forecast, By Country
- Historical Market Size Value (USD Million) & Volume (Unit) Trend Analysis By Market Taxonomy, 2021 to 2025
- Market Size Value (USD Million) & Volume (Unit) Forecast By Market Taxonomy, 2026 to 2036
- By Country
- Germany
- UK
- Italy
- Spain
- France
- Nordic
- BENELUX
- Rest of Western Europe
- By Shelter Type
- By Cooling Method
- By Application
- By End Use
- By Sales Channel
- By Country
- Market Attractiveness Analysis
- By Country
- By Shelter Type
- By Cooling Method
- By Application
- By End Use
- By Sales Channel
- Key Takeaways
- Eastern Europe Market Analysis and Forecast, By Country
- Historical Market Size Value (USD Million) & Volume (Unit) Trend Analysis By Market Taxonomy, 2021 to 2025
- Market Size Value (USD Million) & Volume (Unit) Forecast By Market Taxonomy, 2026 to 2036
- By Country
- Russia
- Poland
- Hungary
- Balkan & Baltic
- Rest of Eastern Europe
- By Shelter Type
- By Cooling Method
- By Application
- By End Use
- By Sales Channel
- By Country
- Market Attractiveness Analysis
- By Country
- By Shelter Type
- By Cooling Method
- By Application
- By End Use
- By Sales Channel
- Key Takeaways
- East Asia Market Analysis and Forecast, By Country
- Historical Market Size Value (USD Million) & Volume (Unit) Trend Analysis By Market Taxonomy, 2021 to 2025
- Market Size Value (USD Million) & Volume (Unit) Forecast By Market Taxonomy, 2026 to 2036
- By Country
- China
- Japan
- South Korea
- By Shelter Type
- By Cooling Method
- By Application
- By End Use
- By Sales Channel
- By Country
- Market Attractiveness Analysis
- By Country
- By Shelter Type
- By Cooling Method
- By Application
- By End Use
- By Sales Channel
- Key Takeaways
- South Asia and Pacific Market Analysis and Forecast, By Country
- Historical Market Size Value (USD Million) & Volume (Unit) Trend Analysis By Market Taxonomy, 2021 to 2025
- Market Size Value (USD Million) & Volume (Unit) Forecast By Market Taxonomy, 2026 to 2036
- By Country
- India
- ASEAN
- Australia & New Zealand
- Rest of South Asia and Pacific
- By Shelter Type
- By Cooling Method
- By Application
- By End Use
- By Sales Channel
- By Country
- Market Attractiveness Analysis
- By Country
- By Shelter Type
- By Cooling Method
- By Application
- By End Use
- By Sales Channel
- Key Takeaways
- Middle East & Africa Market Analysis and Forecast, By Country
- Historical Market Size Value (USD Million) & Volume (Unit) Trend Analysis By Market Taxonomy, 2021 to 2025
- Market Size Value (USD Million) & Volume (Unit) Forecast By Market Taxonomy, 2026 to 2036
- By Country
- Kingdom of Saudi Arabia
- Other GCC Countries
- Türkiye
- South Africa
- Other African Union
- Rest of Middle East & Africa
- By Shelter Type
- By Cooling Method
- By Application
- By End Use
- By Sales Channel
- By Country
- Market Attractiveness Analysis
- By Country
- By Shelter Type
- By Cooling Method
- By Application
- By End Use
- By Sales Channel
- Key Takeaways
- Key Countries Market Analysis
- USA
- Pricing Analysis
- Market Share Analysis, 2025
- By Shelter Type
- By Cooling Method
- By Application
- By End Use
- By Sales Channel
- Canada
- Pricing Analysis
- Market Share Analysis, 2025
- By Shelter Type
- By Cooling Method
- By Application
- By End Use
- By Sales Channel
- Mexico
- Pricing Analysis
- Market Share Analysis, 2025
- By Shelter Type
- By Cooling Method
- By Application
- By End Use
- By Sales Channel
- Brazil
- Pricing Analysis
- Market Share Analysis, 2025
- By Shelter Type
- By Cooling Method
- By Application
- By End Use
- By Sales Channel
- Chile
- Pricing Analysis
- Market Share Analysis, 2025
- By Shelter Type
- By Cooling Method
- By Application
- By End Use
- By Sales Channel
- Germany
- Pricing Analysis
- Market Share Analysis, 2025
- By Shelter Type
- By Cooling Method
- By Application
- By End Use
- By Sales Channel
- UK
- Pricing Analysis
- Market Share Analysis, 2025
- By Shelter Type
- By Cooling Method
- By Application
- By End Use
- By Sales Channel
- Italy
- Pricing Analysis
- Market Share Analysis, 2025
- By Shelter Type
- By Cooling Method
- By Application
- By End Use
- By Sales Channel
- Spain
- Pricing Analysis
- Market Share Analysis, 2025
- By Shelter Type
- By Cooling Method
- By Application
- By End Use
- By Sales Channel
- France
- Pricing Analysis
- Market Share Analysis, 2025
- By Shelter Type
- By Cooling Method
- By Application
- By End Use
- By Sales Channel
- India
- Pricing Analysis
- Market Share Analysis, 2025
- By Shelter Type
- By Cooling Method
- By Application
- By End Use
- By Sales Channel
- ASEAN
- Pricing Analysis
- Market Share Analysis, 2025
- By Shelter Type
- By Cooling Method
- By Application
- By End Use
- By Sales Channel
- Australia & New Zealand
- Pricing Analysis
- Market Share Analysis, 2025
- By Shelter Type
- By Cooling Method
- By Application
- By End Use
- By Sales Channel
- China
- Pricing Analysis
- Market Share Analysis, 2025
- By Shelter Type
- By Cooling Method
- By Application
- By End Use
- By Sales Channel
- Japan
- Pricing Analysis
- Market Share Analysis, 2025
- By Shelter Type
- By Cooling Method
- By Application
- By End Use
- By Sales Channel
- South Korea
- Pricing Analysis
- Market Share Analysis, 2025
- By Shelter Type
- By Cooling Method
- By Application
- By End Use
- By Sales Channel
- Russia
- Pricing Analysis
- Market Share Analysis, 2025
- By Shelter Type
- By Cooling Method
- By Application
- By End Use
- By Sales Channel
- Poland
- Pricing Analysis
- Market Share Analysis, 2025
- By Shelter Type
- By Cooling Method
- By Application
- By End Use
- By Sales Channel
- Hungary
- Pricing Analysis
- Market Share Analysis, 2025
- By Shelter Type
- By Cooling Method
- By Application
- By End Use
- By Sales Channel
- Kingdom of Saudi Arabia
- Pricing Analysis
- Market Share Analysis, 2025
- By Shelter Type
- By Cooling Method
- By Application
- By End Use
- By Sales Channel
- Türkiye
- Pricing Analysis
- Market Share Analysis, 2025
- By Shelter Type
- By Cooling Method
- By Application
- By End Use
- By Sales Channel
- South Africa
- Pricing Analysis
- Market Share Analysis, 2025
- By Shelter Type
- By Cooling Method
- By Application
- By End Use
- By Sales Channel
- USA
- Market Structure Analysis
- Competition Dashboard
- Competition Benchmarking
- Market Share Analysis of Top Players
- By Regional
- By Shelter Type
- By Cooling Method
- By Application
- By End Use
- By Sales Channel
- Emerging Startups
- Innovation Benchmarking
- Competition Analysis
- Competition Deep Dive
- Value (USD Million) & Volume United Rentals
- Overview
- Product Portfolio
- Profitability by Market Segments (Product/Region/Sales Channel)
- Sales Footprint
- Strategy Overview
- Marketing Strategy
- Product Strategy
- Channel Strategy
- Sunbelt Rentals
- Aggreko
- Alaska Structures
- Losberger De Boer
- HDT Global
- Mahaffey USA
- Portacool
- and Polar King
- Value (USD Million) & Volume United Rentals
- Case Studies
- Success Stories
- Recent Developments
- Competition Deep Dive
- Assumptions & Acronyms Used


