

- Market Size (2026)
- USD 860.7 Mn
- Forecast (2036)
- USD 1790.5 Mn
- CAGR (2026 to 2036)
- 7.6%
How big is the Positive Pressurized Containers Market in 2026?
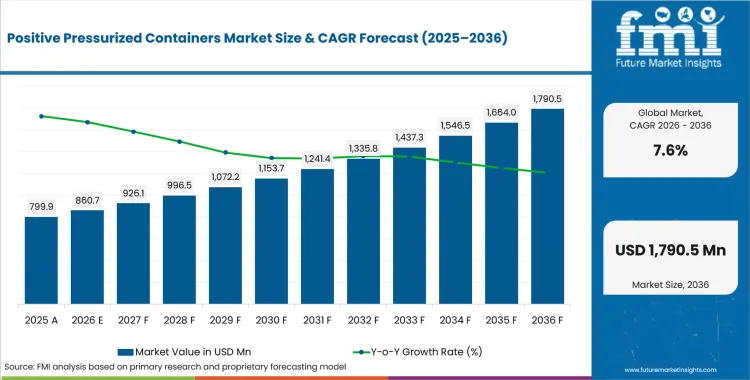
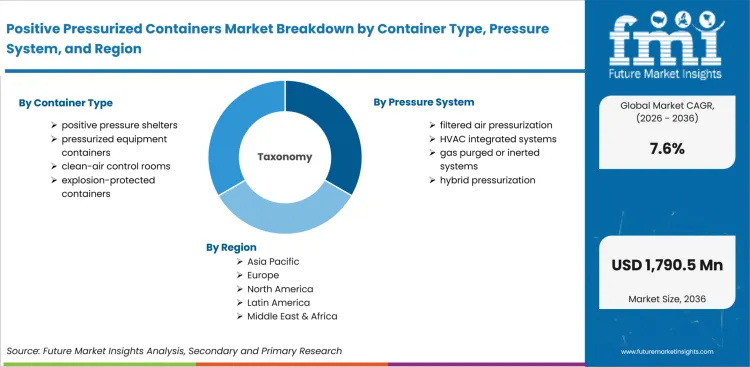
USD 860.7 million in 2026 and USD 1,790.5 million by 2036 at a 7.6% CAGR.
Demand for positive pressurized containers is projected to rise at a CAGR of 7.6% by 2036, driving industry valuation from USD 860.7 million in 2026 to USD 1,790.5 million during the forecast period. Industrial sites are buying positive pressurized containers due to dust exposure rules and the cost of clean shutdowns. MSHA’s April 2024 final rule lowered respirable crystalline silica exposure to 50 micrograms per cubic meter of air. That rule makes filtered shelters more useful near mining and fabrication work. Controlled-air procurement also rises when temporary work zones must protect instruments and clean operations.
India is expected to grow through pharmaceutical capacity and modular clean-work requirements, while China and South Korea are projected to move faster through electronics and semiconductor investment. The United States and Germany are anticipated to expand through pressure documentation, filter-service proof and validation records before repeat deployment. Plant engineers and EPC integrators are likely to use positive pressurized containers to protect control rooms, analyzer shelters and temporary clean work zones from dust or vapor intrusion.
Plant engineers and EPC integrators are the main purchasers for pressurized container systems in exposure-sensitive projects. They use the category to protect control rooms, temporary clean work zones and analyzer shelters from dust or vapor intrusion. EPA updated its Air Sensor Toolbox in May 2026 and describes collocation shelters for monitoring work, which links enclosure choice to instrument reliability. Project teams comparing cleanroom construction options test pressure control, filter access and local service ownership before approving repeat orders.
Summary of the Positive Pressurized Containers Market
| Market Signal | Commercial Impact |
|---|---|
| Demand and Growth Drivers | Pressurized container spending is expected to be driven by contamination control and site uptime risk. Documentation needs are projected to make plant teams check pressure behavior before repeat purchasing.
|
| Product and Segment View | Direct OEM, positive pressure shelters and filtered air pressurization are expected to lead their parent categories in 2026. Channel control is forecast to carry weight in service response and documentation ownership.
|
| Geography and Growth Outlook | India and China are expected to form the higher-growth tier due to industrial expansion and clean production investment. The United States and Europe are projected to move under documentation-heavy replacement cycles.
|
| Competitive Landscape | Competition is moderately concentrated around cleanroom module specialists and enclosure manufacturers. Procurement screens are expected to center on pressure documentation, installation support and service reach.
|
| Analyst Perspective | Positive pressurized containers should be evaluated as controlled-air assets rather than temporary cabins. Their commercial value rises when pressure records, filter access and commissioning evidence reduce risk for dust-sensitive and contamination-sensitive work.
|
How is the Positive Pressurized Containers Market segmented?
The positive pressurized containers industry is segmented by container type, pressure system, application, end use, sales channel and region.
The positive pressurized containers market is segmented by container type, pressure system, application, end use, sales channel and region. By container type, the scope covers positive pressure shelters, pressurized equipment containers, clean-air control rooms and explosion-protected containers. By pressure system, it covers filtered air pressurization, HVAC integrated systems, gas purged or inerted systems and hybrid pressurization. By application, it covers hazardous area protection, dust exclusion, clean operations and emergency field control. By end use, it covers oil and gas, mining, pharmaceutical cleanrooms and defense emergency uses. Regional coverage spans North America, Latin America, Europe, East Asia, South Asia and Pacific and Middle East and Africa, aligned to industrial safety products demand.
How does direct OEM shape purchasing within the sales channel category?
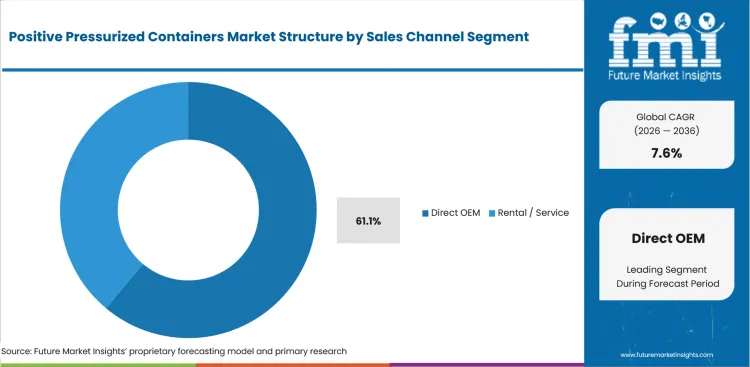
Direct OEM ordering is attractive to project teams that need one accountable route for engineered containers and field support. EPA guidance on air sensor work was updated in May 2026 and references collocation shelters at monitoring sites, which ties enclosure quality to instrument reliability. Direct routes reduce handoff risk between design teams and service crews before commissioning begins. Project leads use direct OEM documentation to confirm pressure behavior before site acceptance.
- By sales channel, direct OEM is projected to account for 61.1% of demand in 2026 driven by bundled engineering records and post-installation support. USA Census Bureau construction data placed manufacturing construction at USD 184.5 billion in April 2026, which keeps engineered enclosure sourcing visible in facility projects that need accountable site handover.
- Direct OEM purchasing is witnessing demand from EPC integrators owing to clearer warranty ownership and faster acceptance testing. Project managers comparing machine safety systems use direct routes to keep design responsibility close to control-room performance, analyzer-shelter airflow and commissioning evidence that maintenance teams review before repeat orders during early-stage package approval and safety review.
What supports demand for positive pressure shelters within the container type category?
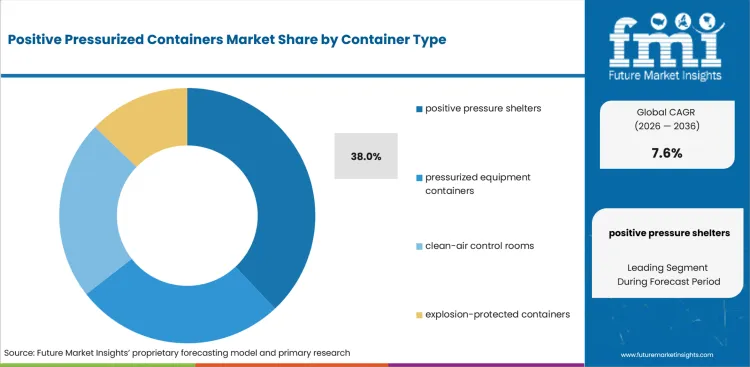
Hazardous work sites need shelter designs that keep dust and airborne contaminants away from operators and sensitive controls. MSHA finalized a respirable crystalline silica rule in April 2024 that set a 50 µg/m³ exposure limit, which raises the value of pressure-controlled shelter options near mining and cutting work. Shelter qualification depends on airflow proof and maintenance access during contractor package approval.
- Positive pressure shelters are estimated to hold 38.0% of container type demand in 2026 owing to broad use near dust and vapor exposure zones. MSHA also set a 25 µg/m³ action level in April 2024, which pushes site teams to document engineering controls earlier during exposure reviews and contractor qualification.
- Demand for positive pressure shelters is expected to grow among mining and energy operators attributable to exposure-control planning. These operators compare shelter pressure records beside industrial workplace safety programs before adding units to contractor safety packs, temporary work permits and maintenance routes that require clean entry behavior during high-risk site mobilization.
How do plant engineers evaluate filtered air pressurization within the pressure system category?
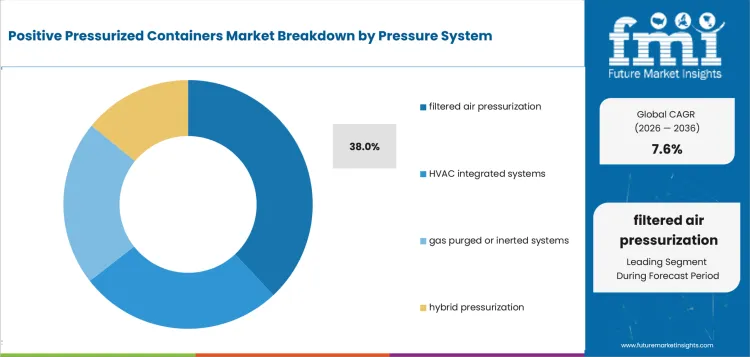
Filtered air pressurization is evaluated around filter change access and pressure stability under dusty operating cycles. The EPA Air Sensor Toolbox was updated in May 2026 and describes sensor performance evaluation resources, which makes pressure and particle data more useful during enclosure acceptance. Engineering teams request maintenance records before approving repeated shelter use across plant projects. Service crews also check whether filters remain reachable in cramped plant layouts during routine maintenance.
- By pressure system, filtered air pressurization is forecast to represent 38.0% of demand in 2026 supported by particulate exclusion and serviceable filtration.
- Filtered air pressurization is drawing attention in containerized control rooms supported by dust exclusion and electronics protection. Maintenance teams comparing HVAC systems service routines examine filter access, pressure alarms and replacement intervals before treating the package as repeatable plant equipment across outage-sensitive production areas. Plant engineers also check alarm behavior before linking the package to routine maintenance schedules.
What drives hazardous area protection within the application category?
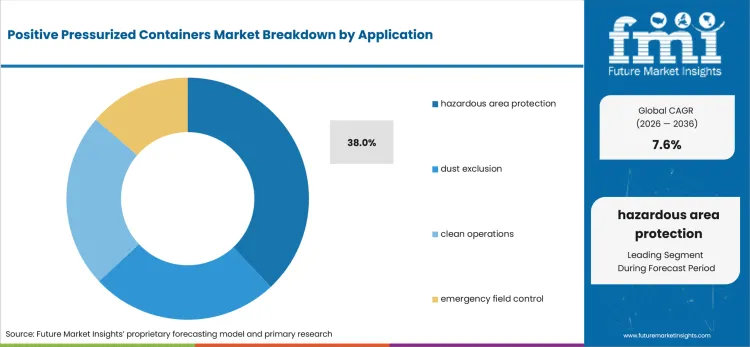
Hazardous area protection requires containers that separate personnel and controls from airborne risks during field operations. HSE reported in November 2025 that 680,000 working people sustained workplace injury in Great Britain. The injury burden keeps safer site layouts inside sourcing discussions where contractors need documented protection steps. Project owners want containers that combine pressure control and clear operating instructions before field mobilization.
- Hazardous area protection is anticipated to lead application demand at 38.0% share in 2026 due to dust-control and vapor-separation needs. Health and Safety Executive recorded 59,219 employee injuries reported under RIDDOR in 2024/25. The reporting burden supports closer screening of field shelter access, alarm routines and worker-entry design before contractors approve site packages.
- Purchase activity for hazardous area protection is anticipated to rise driven by contractor safety planning and control-room continuity. Site teams comparing functional safety requirements want shelters that keep panels accessible without weakening the protected work zone. Maintenance leads also review protected access routes before approving inspection routines in active facilities.
How is oil and gas positioned within the end use category?
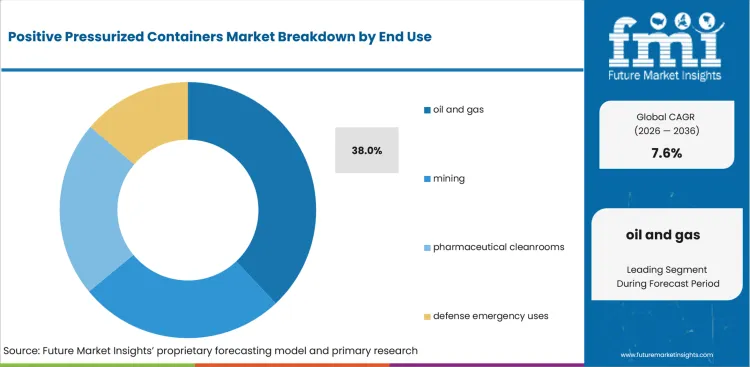
Oil and gas sites use positive pressurized containers to protect analyzer cabins and field control rooms from outdoor contaminants. The IEA Global Methane Tracker 2025 stated that the energy sector accounts for more than 35% of human-related methane emissions, which keeps monitoring and enclosure integrity visible in operating plans. Operators test pressure systems beside emissions and safety workflows during field enclosure selection.
- Oil and gas is likely to capture 38.0% of end-use demand in 2026 attributable to outdoor process control and monitoring needs. IEA estimated that only around 5.0% of global oil and gas production meets a near-zero emissions standard in 2025, which raises the value of reliable monitoring shelters.
- Oil and gas operators are expected to favor pressure-controlled containers over basic cabins due to instrument uptime and hazardous-site documentation. Regional teams compare clean-entry practices and pressure alarms before planning temporary controlled spaces for analyzer cabins. Field managers also review maintenance access near active process areas before approving contractor work zones.
What are the drivers, restraints, and opportunities in the Positive Pressurized Containers Market?
Near-term purchases are being shaped by exposure-control requirements, qualification burden and direct OEM service routes outlined below.
- Driver: Dust exposure rules and clean-operation requirements are expected to push plant teams toward pressure-controlled container packages.
- Restraint: Adoption is anticipated to slow when project teams lack pressure data and local service ownership during qualification.
- Opportunity: Direct OEM programs are projected to open account access for sites that need one accountable enclosure package.
Mining and industrial operators are expected to raise interest in containers that make airborne exposure control easier to document. MSHA lowered the respirable crystalline silica permissible exposure limit to 50 µg/m³ in April 2024. The rule makes ventilation proof and dust-control records more visible in supply chain reviews. Container providers that supply pressure logs and filter-change guidance are better aligned with site acceptance routines. Field crews use those records to keep shutdown planning closer to documented exposure controls.
Project teams often delay approval when installation responsibility is split between panel builders and service contractors. EPA updated the Air Sensor Toolbox in May 2026 and points users toward performance evaluation resources for air-monitoring systems. Operating context makes weak sensor protection and unclear enclosure testing harder to defend during technical review and purchase approval. Supply chain teams look for one technical owner before shifting from pilot units to larger project packages.
Direct OEM account routes are forecast to convert qualification friction into a repeat-order path. G-CON announced Optimized by Design in October 2024 to combine PODular and modular cleanroom approaches for controlled-environment projects. The development points to purchasing preference for integrated packages that reduce handoffs during cleanroom planning. Field service teams also receive clearer instructions before maintaining filter and pressure packages during project ramp-up. OEMs that pair container design with field documentation are expected to receive closer review beside clean room panels planning.
Which country CAGRs are profiled in the Positive Pressurized Containers Market?
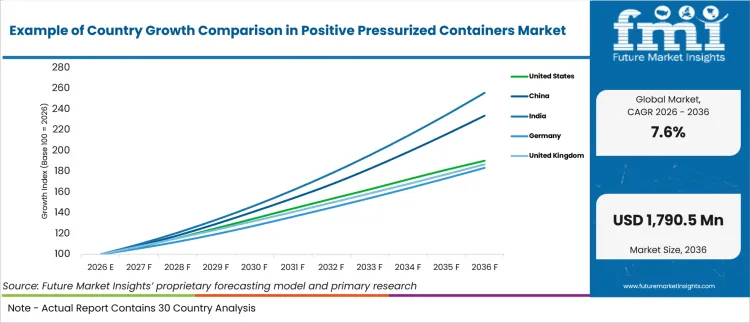
| Country | CAGR |
|---|---|
| United States | 6.65% |
| China | 8.85% |
| India | 9.85% |
| Germany | 6.25% |
| United Kingdom | 6.45% |
| Japan | 6.05% |
| South Korea | 7.45% |
| Rest of World | 7.85% |
Source: FMI's proprietary forecasting model and primary research
How do country-level CAGRs compare in the Positive Pressurized Containers Market?
India is projected to post 9.85% CAGR and China is forecast to advance at 8.85% during the assessment period. South Korea is anticipated to record 7.45% CAGR through 2036. The United States is projected at 6.65% and the United Kingdom is forecast at 6.45%. Germany is estimated at 6.25% and Japan is predicted at 6.05% during the same forecast period. Growth variation reflects industrial buildout, cleanroom qualification and field service availability across project pipelines.
- United States manufacturing construction remains the clearest local hook for containerized clean spaces and protected control rooms. The United States is projected to grow at 6.65% CAGR through 2036 driven by facility spending and plant modernization. The USA Census Bureau reported private manufacturing construction at USD 184.5 billion in April 2026. Facility spending keeps engineered enclosure sourcing visible in production expansions that need clean temporary work areas.
- China is scaling high-tech production that needs cleaner temporary rooms and controlled outdoor cabinets. Positive pressurized container demand in China is forecast to rise at 8.85% CAGR over the forecast period supported by electronics and equipment manufacturing. National Bureau of Statistics of China reported high-tech manufacturing value-added growth of 9.4% in 2025. The high-tech production base widens the addressable base for filtered containers in factory projects.
- India links the category to pharmaceutical manufacturing and modular utility rooms for regulated production. India’s positive pressurized containers outlook is anticipated to advance at 9.85% CAGR over the assessment period attributable to clean manufacturing capacity. Press Information Bureau reported pharmaceutical annual turnover of ₹4.72 lakh crore in FY2024/25. The manufacturing scale increases demand for controlled-air modules that shorten validation work in pharmaceutical expansions. GMP-focused site teams use pressurized containers to manage temporary clean spaces during upgrades and batch changeovers.
- Germany shows a replacement-led pattern centered on manufacturing order books and technical documentation. Adoption of positive pressurized containers in Germany is estimated to expand at 6.25% CAGR through 2036 owing to factory order visibility. Destatis reported that manufacturing order stock was up 8.4% year over year in April 2026. The backlog sustains selective demand for protected equipment rooms in industrial facilities and retrofit projects.
- United Kingdom sourcing is shaped by safety governance and the cost of workplace incidents. The United Kingdom positive pressurized containers sector is projected to record 6.45% CAGR during the assessment period reinforced by safety documentation. Health and Safety Executive reported 40.1 million working days lost due to work-related illness and workplace injury in 2024/25. Lost-workday pressure keeps safer site layouts and controlled shelters inside contractor reviews for major projects. EPC integrators are expected to receive stronger consideration when they bundle installation support and maintenance ownership.
- Japan links container demand to semiconductor investment and controlled environments around high-value tools. In Japan, positive pressurized container demand is predicted to advance at 6.05% CAGR through 2036 shaped by chip-fab support. METI stated in November 2025 that 100 billion yen was allocated in fiscal 2025 for Rapidus through IPA. The funding signal raises attention on clean utilities and modular support rooms around semiconductor projects. Japanese project teams are expected to favor providers that document pressure stability for semiconductor-adjacent spaces.
- South Korea’s semiconductor export base makes cleanroom-adjacent container use commercially visible for fab support work. South Korea is estimated to post 7.45% CAGR over the forecast period led by fabs and equipment-support zones. MOTIR announced that semiconductor exports reached USD 173.4 billion in 2025 across Korean trade channels. Export scale supports demand for controlled-air containers near tool installation and maintenance spaces. Cleanroom contractors are expected to prioritize providers that match pressure control with fast field service.
Who are the notable companies in the Positive Pressurized Containers Market?
G-CON Manufacturing, Germfree, Terra Universal, Clean Air Products, PortaFab, Mecart Cleanrooms, Panel Built, and AES Clean Technology are the notablecompanies shaping this market.
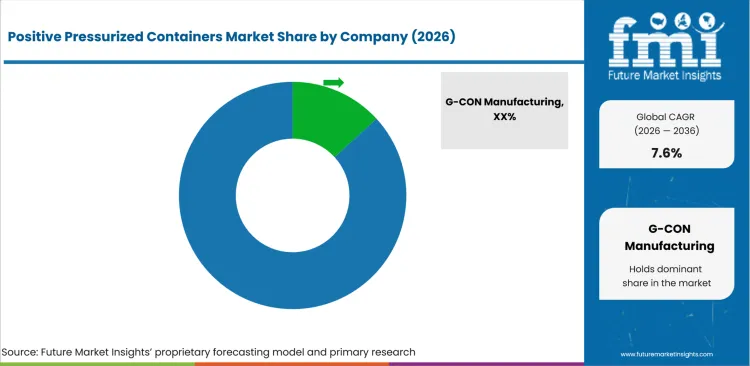
Competition is moderately concentrated around modular cleanroom builders and engineered enclosure specialists that support qualification work during project approval. Scale is controlled by project engineering depth, air-handling documentation and service reach across regulated facilities. Established global providers hold an advantage in pharmaceutical and semiconductor accounts that require repeatable pressure records.
- Prefabricated cleanroom capability separates G-CON Manufacturing in projects that need rapid validation and modular integration. The company competes on POD-style room delivery and documentation support for clean manufacturing accounts. Pharmaceutical site teams use that approach when containerized clean areas must connect to existing floors and utilities without a long shutdown.
- Mobile containment and laboratory experience give Germfree and Terra Universal a practical role in temporary controlled environments. Their appeal is clearest in accounts that need ready equipment access and airflow documentation before permanent rooms are available. Life-science contractors use these providers for interim clean spaces that need faster delivery and visible operating instructions.
- Panelized construction creates a different route for PortaFab, Mecart Cleanrooms and Panel Built in retrofit projects. These companies compete on enclosure layout and project fit where plant geometry limits standard container placement.
- Cleanroom engineering depth supports AES Clean Technology and Clean Air Products in contamination-control projects. AES offers modular cleanroom and entry-control design support for accounts that need documented personnel flow. Their position is clearest in projects that need airlock behavior and utility integration before supplier approval. Project teams use these providers when pressure zoning must be documented beside modular enclosure plans.
Competitive Benchmarking: Positive Pressurized Containers Market
| Company | Pressure Control Fit | Project Support | Service Reach | Cleanroom Relevance |
|---|---|---|---|---|
| G-CON Manufacturing | High | Strong | Global | High |
| Germfree | High | Strong | Global | Medium |
| Terra Universal | Strong | Medium | Global | High |
| Clean Air Products | Medium | Strong | Regional | High |
| PortaFab | Strong | Medium | Regional | Medium |
| Mecart Cleanrooms | High | Strong | Global | Medium |
| Panel Built | Strong | Medium | Regional | Medium |
| AES Clean Technology | High | Strong | Global | High |
Source: Future Market Insights competitive analysis, 2026. Ratings reflect relative portfolio relevance and workflow fit. Service capability and geographic reach shape the remaining comparison.
Key Developments in the Positive Pressurized Containers Market
- In April 2024, G-CON Manufacturing announced the launch of its new floorlessPOD at INTERPHEX 2024 for modular cleanroom applications. The free-standing unit was designed to integrate directly with an existing facility floor, reducing installation complexity and infrastructure modifications.
- In October 2024, G-CON Manufacturing announced its Optimized by Design initiative for PODular and modular cleanroom technologies. The program unified product offerings to help project teams align controlled-environment solutions with diverse facility and production requirements.
- In April 2024, AES Clean Technology launched the CleanLock Module for cleanroom entry control and modular project deployment. The airlock solution was developed to enhance cleanliness standards while improving project execution efficiency in controlled environments.
- In April 2025, AES Clean Technology introduced Omni ASCENT at INTERPHEX 2025 to support cleanroom utility integration. Built on the company’s Omni utility raceway platform, the solution was designed to relocate utility routing away from traditional wall and ceiling pathways.
Key Players in the Positive Pressurized Containers Market
Modular cleanroom and containerized environment providers
- G-CON Manufacturing
- Germfree
- Terra Universal
- AES Clean Technology
Panelized enclosure and controlled-room suppliers
- PortaFab
- Mecart Cleanrooms
- Panel Built
Air-control and transport-enclosure specialists
- Clean Air Products
Positive Pressurized Containers Market - Report Scope
| Coverage field | Report scope |
|---|---|
| Market breakdown | Positive Pressurized Containers Market Breakdown By Container Type, Pressure System, Application, End Use, Sales Channel, and Region |
| Market Definition | Positive pressurized containers are modular shelters, control rooms and clean-air enclosures that maintain internal positive pressure to protect personnel, instruments or processes from dust, vapor or contamination. |
| Regions Covered | North America, Latin America, Europe, East Asia, South Asia and Pacific, and Middle East and Africa |
| Countries Covered | United States, China, India, Germany, United Kingdom, Japan, South Korea and 30+ countries |
| Key Companies Profiled | G-CON Manufacturing, Germfree, Terra Universal, Clean Air Products, PortaFab, Mecart Cleanrooms, Panel Built, AES Clean Technology |
| Forecast Period | 2026 to 2036 |
| Approach | Hybrid bottom-up and top-down methodology using pressure-system adoption, hazardous-area use cases, direct OEM penetration and country-level industrial investment. |
Source: Future Market Insights - analysis driven by proprietary forecasting models and primary research
Positive Pressurized Containers Market - Research Methodology
| Method | Approach |
|---|---|
| Primary Research | FMI analysts gathered input from manufacturers, service providers, technology developers, distributors, end users, sourcing teams, and subject-matter experts. Interviews examined purchasing decisions, product or service evaluation, adoption barriers, approval requirements, pricing considerations, and expectations for technical or commercial support. Respondents were also asked what evidence is required before a trial, pilot, or initial order develops into regular purchasing. |
| Desk Research | Desk research covered government statistics, regulatory publications, trade data, industry associations, technical literature, standards, company filings, product information, and official corporate announcements. Sources were reviewed for relevance, publication date, geographic coverage, and consistency with the defined market scope. Claims relating to performance, applications, approvals, capacity, investment, and commercial activity were retained only when supported by credible public evidence. |
| Market Sizing and Forecasting | The market model combined the baseline value with historical performance, segment structure, pricing and volume indicators, adoption levels, company participation, and country-level demand conditions. Forecast assumptions considered economic activity, investment trends, regulatory developments, technology adoption, purchasing cycles, supply availability, and barriers to wider market use. Segment and regional estimates were reconciled before the final market total was calculated. |
| Data Validation | Estimates were checked against multiple independent indicators, including public data, company activity, trade patterns, industry developments, and findings from primary interviews. Validation also tested whether products, services, applications, and company revenues fell within the defined market boundaries. Adjacent categories, unsupported claims, overlapping revenues, and activities without direct market relevance were excluded to reduce double counting and maintain consistency across segments and countries. |
Positive Pressurized Containers Market by Segments
Positive Pressurized Containers Market segmented by Container Type:
- Positive Pressure Shelters
- Pressurized Equipment Containers
- Clean-Air Control Rooms
- Explosion-Protected Containers
Positive Pressurized Containers Market segmented by Pressure System:
- Filtered Air Pressurization
- HVAC Integrated
- Gas Purged / Inerted
- Hybrid Pressurization
Positive Pressurized Containers Market segmented by Application:
- Hazardous Area Protection
- Dust Exclusion
- Clean Operations
- Emergency / Field Control
Positive Pressurized Containers Market segmented by End Use:
- Oil and Gas
- Mining
- Pharmaceutical / Cleanroom
- Defense / Emergency
Positive Pressurized Containers Market segmented by Sales Channel:
- Direct OEM
- EPC / Integrators
- Rental / Service
Positive Pressurized Containers Market by Region:
- North America
- United States
- Canada
- Latin America
- Brazil
- Mexico
- Europe
- Germany
- United Kingdom
- France
- Italy
- Spain
- East Asia
- China
- Japan
- South Korea
- South Asia and Pacific
- India
- Australia
- ASEAN
- Middle East and Africa
- GCC
- South Africa
Research Sources and Bibliography
- USA Census Bureau. (2026, June). Monthly construction spending, April 2026. USA Census Bureau.
- National Bureau of Statistics of China. (2026, February). Statistical communiqué of the People’s Republic of China on the 2025 National Economic and Social Development. National Bureau of Statistics of China.
- Press Information Bureau. (2026, March). India’s pharmaceuticals in global healthcare. Government of India.
- Federal Statistical Office. (2026, June). Industry, manufacturing. Destatis.
- Health and Safety Executive. (2025, November). Health and safety statistics: 2024 to 2025 annual release. Health and Safety Executive.
- Ministry of Economy, Trade and Industry. (2025, November). Press conference by Minister Akazawa (Excerpt). METI.
- Ministry of Trade, Industry and Resources. (2026, January). Korea’s Annual Exports Reach New Highs in 2025. MOTIR.
- United Nations Industrial Development Organization. (2026, March). World Manufacturing Production and Trade - Quarterly Report. UNIDO Statistics Portal.
- Mine Safety and Health Administration. (2024, April). Respirable Crystalline Silica. MSHA.
- USA Environmental Protection Agency. (2026, May). Air Sensor Toolbox. USA EPA.
- International Energy Agency. (2025, May). Global Methane Tracker 2025. IEA.
- G-CON Manufacturing. (2024, April). G-CON Announces The Release Of New Floorless POD At INTERPHEX 2024. G-CON Manufacturing.
- G-CON Manufacturing. (2024, October). G-CON ANNOUNCES OPTIMIZED BY DESIGN, LEVERAGING PODULAR AND MODULAR TECHNOLOGIES. G-CON Manufacturing.
- AES Clean Technology. (2024, April). AES Clean Technology sets new standards for cleanliness and efficiency in cleanrooms with the launch of its CleanLock Module. AES Clean Technology.
- AES Clean Technology. (2025, April). AES Cleanroom Technology introduces Omni ASCENT: a breakthrough in cleanroom utility integration at INTERPHEX 2025. AES Clean Technology.
This bibliography is provided for reader reference and uses primary government sources for article evidence. Standards-body references and official company sources were included where they supported verified article evidence.
This Report Answers
- What value is forecast for the positive pressurized containers market in 2026 and by 2036?
- What CAGR is forecast for the positive pressurized containers market from 2026 to 2036?
- Which segments shape demand across container type and pressure system categories and across application, end use and sales channel?
- Which exposure-control and clean-operation pressures support purchase activity in positive pressurized container projects?
- How do country CAGRs differ across the profiled positive pressurized containers markets?
- Which companies compete across pressure control, project support and cleanroom relevance?
- How does FMI validate forecasts using hybrid bottom-up and top-down methodology?
- What factors should plant engineers address before broader account expansion or sourcing commitment?
- How do pressure documentation, service ownership and safety rules affect vendor selection?
Frequently Asked Questions
What is driving growth in the Positive Pressurized Containers Market?
Growth is being driven by dust exposure rules, contamination control and site uptime risk. Plant teams use pressurized containers to protect control rooms, clean work zones and analyzer shelters.
Who are the key players in the Positive Pressurized Containers Market?
Key players include G-CON Manufacturing; Germfree and Terra Universal; PortaFab and Mecart Cleanrooms; Panel Built; AES Clean Technology and Clean Air Products. Competition centers on pressure documentation, installation support and service reach.
What is a significant restraint in the Positive Pressurized Containers Market?
A significant restraint is weak qualification evidence during project review. Adoption slows when buyers lack pressure data, filter-service proof and local service ownership.
Why should executives track the Positive Pressurized Containers Market?
Executives should track the market due to its link with uptime, site safety and clean-operation continuity. The category influences capital planning where temporary controlled spaces reduce approval friction during plant upgrades.
What business problem does the Positive Pressurized Containers Market address?
The market addresses dust intrusion, vapor exposure and cleanroom contamination risk around sensitive work zones. Positive pressure keeps protected spaces usable when outdoor or plant conditions are difficult to control.
What should procurement leaders evaluate before selecting container providers?
Procurement leaders should evaluate pressure stability records and filter access before selecting a provider. Documentation quality and local service coverage also deserve review when one party must own installation and acceptance testing.
What limits return on investment for project teams?
Return on investment is expected to be limited by weak pressure data and unclear maintenance ownership. Field teams also lose value when replacement filters or service crews are unavailable near the project site.
How do container providers build long-term account confidence?
Container providers build confidence by sharing pressure-test records, filter replacement guidance and installation handover documents. Repeat orders are more likely when service response and documentation stay consistent after commissioning.
Preview the report firsthand - request a free sample
Get SampleGet the brochure for pricing and purchase details.
Get PDFTable of Content
- Key Takeaways
- Market Size and CAGR
- Top Growth Driver
- Fastest Growing Segment
- Leading Region
- Key Companies
- Emerging Opportunities
- Executive Summary
- Global Market Outlook
- Demand-side Trends
- Supply-side Trends
- Technology Roadmap Analysis
- Analysis and Recommendations
- Analyst Perspective (What is happening? Why now? What should investors know?)
- Key Questions Answered
- How large is the market?
- What is the CAGR?
- What are key trends?
- Which region dominates?
- Who are the leaders?
- Market Overview
- Market Coverage / Taxonomy
- Market Definition / Scope / Limitations
- Research Methodology
- Chapter Orientation
- Analytical Lens and Working Hypotheses
- Market Structure, Signals, and Trend Drivers
- Benchmarking and Cross-market Comparability
- Market Sizing, Forecasting, and Opportunity Mapping
- Research Design and Evidence Framework
- Desk Research Programme (Secondary Evidence)
- Expert Input and Fieldwork (Primary Evidence)
- Tooling, Models, and Reference Databases
- Data Engineering and Model Build
- Quality Assurance and Audit Trail
- Market Background
- Market Dynamics (Drivers, Restraints, Opportunity, Trends)
- Scenario Forecast (Optimistic, Likely, Conservative)
- Impact Analysis
- AI Impact
- Sustainability Impact
- Regulatory Impact
- Technology Impact
- Consumer / Buyer Analysis
- Purchase Drivers
- Adoption Barriers
- Buyer Journey
- Opportunity Map Analysis
- Product Life Cycle Analysis
- Supply Chain Analysis
- Investment Feasibility Matrix
- Value Chain Analysis
- PESTLE and Porter's Analysis
- Regulatory Landscape
- Regional Parent Market Outlook
- Production and Consumption Statistics
- Import and Export Statistics
- Global Market Analysis and Forecast, 2021 to 2036
- Historical Market Size Value (USD Mn) Analysis, 2021 to 2025
- Current and Future Market Size Value (USD Mn) Projections, 2026 to 2036
- Y-o-Y Growth Trend Analysis
- Absolute $ Opportunity Analysis
- Global Market Pricing Analysis, 2021 to 2036
- Global Market Analysis and Forecast, By Container Type, 2021 to 2036
- Introduction / Key Findings
- Historical Market Size Value (USD Mn) Analysis By Container Type, 2021 to 2025
- Current and Future Market Size Value (USD Mn) Analysis and Forecast By Container Type, 2026 to 2036
- positive pressure shelters
- pressurized equipment containers
- clean-air control rooms
- explosion-protected containers
- positive pressure shelters
- Y-o-Y Growth Trend Analysis By Container Type, 2021 to 2025
- Absolute $ Opportunity Analysis By Container Type, 2026 to 2036
- Global Market Analysis and Forecast, By Pressure System, 2021 to 2036
- Introduction / Key Findings
- Historical Market Size Value (USD Mn) Analysis By Pressure System, 2021 to 2025
- Current and Future Market Size Value (USD Mn) Analysis and Forecast By Pressure System, 2026 to 2036
- filtered air pressurization
- HVAC integrated systems
- gas purged or inerted systems
- hybrid pressurization
- filtered air pressurization
- Y-o-Y Growth Trend Analysis By Pressure System, 2021 to 2025
- Absolute $ Opportunity Analysis By Pressure System, 2026 to 2036
- Global Market Analysis and Forecast, By Application, 2021 to 2036
- Introduction / Key Findings
- Historical Market Size Value (USD Mn) Analysis By Application, 2021 to 2025
- Current and Future Market Size Value (USD Mn) Analysis and Forecast By Application, 2026 to 2036
- hazardous area protection
- dust exclusion
- clean operations
- emergency field control
- hazardous area protection
- Y-o-Y Growth Trend Analysis By Application, 2021 to 2025
- Absolute $ Opportunity Analysis By Application, 2026 to 2036
- Global Market Analysis and Forecast, By End Use, 2021 to 2036
- Introduction / Key Findings
- Historical Market Size Value (USD Mn) Analysis By End Use, 2021 to 2025
- Current and Future Market Size Value (USD Mn) Analysis and Forecast By End Use, 2026 to 2036
- oil and gas
- mining
- pharmaceutical cleanrooms
- defense emergency uses
- oil and gas
- Y-o-Y Growth Trend Analysis By End Use, 2021 to 2025
- Absolute $ Opportunity Analysis By End Use, 2026 to 2036
- Global Market Analysis and Forecast, By Sales Channel, 2021 to 2036
- Introduction / Key Findings
- Historical Market Size Value (USD Mn) Analysis By Sales Channel, 2021 to 2025
- Current and Future Market Size Value (USD Mn) Analysis and Forecast By Sales Channel, 2026 to 2036
- Direct OEM
- Rental / Service
- Direct OEM
- Y-o-Y Growth Trend Analysis By Sales Channel, 2021 to 2025
- Absolute $ Opportunity Analysis By Sales Channel, 2026 to 2036
- Global Market Analysis and Forecast, By Region, 2021 to 2036
- Introduction
- Historical Market Size Value (USD Mn) Analysis By Region, 2021 to 2025
- Current Market Size Value (USD Mn) Analysis and Forecast By Region, 2026 to 2036
- North America
- Latin America
- Western Europe
- Eastern Europe
- East Asia
- South Asia and Pacific
- Middle East & Africa
- Market Attractiveness Analysis By Region
- North America Market Analysis and Forecast, By Country, 2021 to 2036
- Historical Market Size Value (USD Mn) Trend Analysis By Market Taxonomy, 2021 to 2025
- Market Size Value (USD Mn) Forecast By Market Taxonomy, 2026 to 2036
- By Country
- USA
- Canada
- By Container Type
- By Pressure System
- By Application
- By End Use
- By Sales Channel
- By Country
- Market Attractiveness Analysis
- By Country
- By Container Type
- By Pressure System
- By Application
- By End Use
- By Sales Channel
- Key Takeaways
- Latin America Market Analysis and Forecast, By Country
- Historical Market Size Value (USD Mn) Trend Analysis By Market Taxonomy, 2021 to 2025
- Market Size Value (USD Mn) Forecast By Market Taxonomy, 2026 to 2036
- By Country
- Brazil
- Mexico
- Chile
- Rest of Latin America
- By Container Type
- By Pressure System
- By Application
- By End Use
- By Sales Channel
- By Country
- Market Attractiveness Analysis
- By Country
- By Container Type
- By Pressure System
- By Application
- By End Use
- By Sales Channel
- Key Takeaways
- Western Europe Market Analysis and Forecast, By Country
- Historical Market Size Value (USD Mn) Trend Analysis By Market Taxonomy, 2021 to 2025
- Market Size Value (USD Mn) Forecast By Market Taxonomy, 2026 to 2036
- By Country
- Germany
- UK
- Italy
- Spain
- France
- Nordic
- BENELUX
- Rest of Western Europe
- By Container Type
- By Pressure System
- By Application
- By End Use
- By Sales Channel
- By Country
- Market Attractiveness Analysis
- By Country
- By Container Type
- By Pressure System
- By Application
- By End Use
- By Sales Channel
- Key Takeaways
- Eastern Europe Market Analysis and Forecast, By Country
- Historical Market Size Value (USD Mn) Trend Analysis By Market Taxonomy, 2021 to 2025
- Market Size Value (USD Mn) Forecast By Market Taxonomy, 2026 to 2036
- By Country
- Russia
- Poland
- Hungary
- Balkan & Baltic
- Rest of Eastern Europe
- By Container Type
- By Pressure System
- By Application
- By End Use
- By Sales Channel
- By Country
- Market Attractiveness Analysis
- By Country
- By Container Type
- By Pressure System
- By Application
- By End Use
- By Sales Channel
- Key Takeaways
- East Asia Market Analysis and Forecast, By Country
- Historical Market Size Value (USD Mn) Trend Analysis By Market Taxonomy, 2021 to 2025
- Market Size Value (USD Mn) Forecast By Market Taxonomy, 2026 to 2036
- By Country
- China
- Japan
- South Korea
- By Container Type
- By Pressure System
- By Application
- By End Use
- By Sales Channel
- By Country
- Market Attractiveness Analysis
- By Country
- By Container Type
- By Pressure System
- By Application
- By End Use
- By Sales Channel
- Key Takeaways
- South Asia and Pacific Market Analysis and Forecast, By Country
- Historical Market Size Value (USD Mn) Trend Analysis By Market Taxonomy, 2021 to 2025
- Market Size Value (USD Mn) Forecast By Market Taxonomy, 2026 to 2036
- By Country
- India
- ASEAN
- Australia & New Zealand
- Rest of South Asia and Pacific
- By Container Type
- By Pressure System
- By Application
- By End Use
- By Sales Channel
- By Country
- Market Attractiveness Analysis
- By Country
- By Container Type
- By Pressure System
- By Application
- By End Use
- By Sales Channel
- Key Takeaways
- Middle East & Africa Market Analysis and Forecast, By Country
- Historical Market Size Value (USD Mn) Trend Analysis By Market Taxonomy, 2021 to 2025
- Market Size Value (USD Mn) Forecast By Market Taxonomy, 2026 to 2036
- By Country
- Kingdom of Saudi Arabia
- Other GCC Countries
- Türkiye
- South Africa
- Other African Union
- Rest of Middle East & Africa
- By Container Type
- By Pressure System
- By Application
- By End Use
- By Sales Channel
- By Country
- Market Attractiveness Analysis
- By Country
- By Container Type
- By Pressure System
- By Application
- By End Use
- By Sales Channel
- Key Takeaways
- Key Countries Market Analysis
- USA
- Pricing Analysis
- Market Share Analysis, 2025
- By Container Type
- By Pressure System
- By Application
- By End Use
- By Sales Channel
- Canada
- Pricing Analysis
- Market Share Analysis, 2025
- By Container Type
- By Pressure System
- By Application
- By End Use
- By Sales Channel
- Mexico
- Pricing Analysis
- Market Share Analysis, 2025
- By Container Type
- By Pressure System
- By Application
- By End Use
- By Sales Channel
- Brazil
- Pricing Analysis
- Market Share Analysis, 2025
- By Container Type
- By Pressure System
- By Application
- By End Use
- By Sales Channel
- Chile
- Pricing Analysis
- Market Share Analysis, 2025
- By Container Type
- By Pressure System
- By Application
- By End Use
- By Sales Channel
- Germany
- Pricing Analysis
- Market Share Analysis, 2025
- By Container Type
- By Pressure System
- By Application
- By End Use
- By Sales Channel
- UK
- Pricing Analysis
- Market Share Analysis, 2025
- By Container Type
- By Pressure System
- By Application
- By End Use
- By Sales Channel
- Italy
- Pricing Analysis
- Market Share Analysis, 2025
- By Container Type
- By Pressure System
- By Application
- By End Use
- By Sales Channel
- Spain
- Pricing Analysis
- Market Share Analysis, 2025
- By Container Type
- By Pressure System
- By Application
- By End Use
- By Sales Channel
- France
- Pricing Analysis
- Market Share Analysis, 2025
- By Container Type
- By Pressure System
- By Application
- By End Use
- By Sales Channel
- India
- Pricing Analysis
- Market Share Analysis, 2025
- By Container Type
- By Pressure System
- By Application
- By End Use
- By Sales Channel
- ASEAN
- Pricing Analysis
- Market Share Analysis, 2025
- By Container Type
- By Pressure System
- By Application
- By End Use
- By Sales Channel
- Australia & New Zealand
- Pricing Analysis
- Market Share Analysis, 2025
- By Container Type
- By Pressure System
- By Application
- By End Use
- By Sales Channel
- China
- Pricing Analysis
- Market Share Analysis, 2025
- By Container Type
- By Pressure System
- By Application
- By End Use
- By Sales Channel
- Japan
- Pricing Analysis
- Market Share Analysis, 2025
- By Container Type
- By Pressure System
- By Application
- By End Use
- By Sales Channel
- South Korea
- Pricing Analysis
- Market Share Analysis, 2025
- By Container Type
- By Pressure System
- By Application
- By End Use
- By Sales Channel
- Russia
- Pricing Analysis
- Market Share Analysis, 2025
- By Container Type
- By Pressure System
- By Application
- By End Use
- By Sales Channel
- Poland
- Pricing Analysis
- Market Share Analysis, 2025
- By Container Type
- By Pressure System
- By Application
- By End Use
- By Sales Channel
- Hungary
- Pricing Analysis
- Market Share Analysis, 2025
- By Container Type
- By Pressure System
- By Application
- By End Use
- By Sales Channel
- Kingdom of Saudi Arabia
- Pricing Analysis
- Market Share Analysis, 2025
- By Container Type
- By Pressure System
- By Application
- By End Use
- By Sales Channel
- Türkiye
- Pricing Analysis
- Market Share Analysis, 2025
- By Container Type
- By Pressure System
- By Application
- By End Use
- By Sales Channel
- South Africa
- Pricing Analysis
- Market Share Analysis, 2025
- By Container Type
- By Pressure System
- By Application
- By End Use
- By Sales Channel
- USA
- Market Structure Analysis
- Competition Dashboard
- Competition Benchmarking
- Market Share Analysis of Top Players
- By Regional
- By Container Type
- By Pressure System
- By Application
- By End Use
- By Sales Channel
- Emerging Startups
- Innovation Benchmarking
- Competition Analysis
- Competition Deep Dive
- G-CON Manufacturing
- Overview
- Product Portfolio
- Profitability by Market Segments
- Sales Footprint
- Strategy Overview
- Marketing Strategy
- Product Strategy
- Channel Strategy
- Germfree
- Terra Universal
- Clean Air Products
- PortaFab
- Mecart Cleanrooms
- Panel Built
- AES Clean Technology
- G-CON Manufacturing
- Case Studies
- Success Stories
- Recent Developments
- Competition Deep Dive
- Assumptions & Acronyms Used


