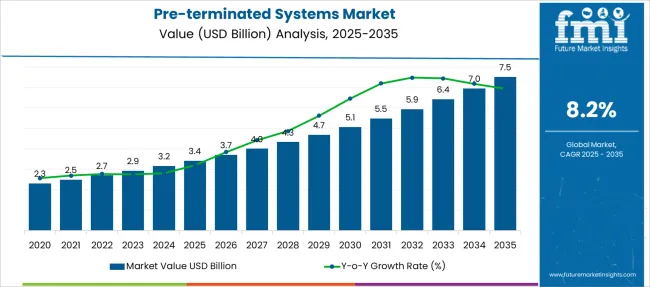
The Pre-terminated Systems Market is estimated to be valued at USD 3.4 billion in 2025 and is projected to reach USD 7.5 billion by 2035, registering a compound annual growth rate (CAGR) of 8.2% over the forecast period.
| Metric | Value |
|---|---|
| Pre-terminated Systems Market Estimated Value in (2025 E) | USD 3.4 billion |
| Pre-terminated Systems Market Forecast Value in (2035 F) | USD 7.5 billion |
| Forecast CAGR (2025 to 2035) | 8.2% |
The pre-terminated systems market is experiencing steady growth driven by the increasing need for faster and more reliable fiber optic network deployments. Advances in telecommunications infrastructure and the expansion of high-speed internet connectivity have accelerated demand for pre-terminated components that simplify installation and reduce downtime.
Industry developments have highlighted the advantages of these systems in minimizing field termination errors and improving overall network performance. The growth of data centers, cloud computing, and enterprise networks has also increased reliance on efficient cabling solutions.
Additionally, the rise of smart cities and 5G rollouts has created new opportunities for rapid fiber deployment. The market outlook remains positive as more organizations prioritize scalable and cost-effective network infrastructures. Segmental expansion is expected to be driven by the Component offering and the IT and Telecom vertical, reflecting the focus on network reliability and speed.
The market is segmented by Offering and Vertical and region. By Offering, the market is divided into Component and Services. In terms of Vertical, the market is classified into IT & Telecom, Government & Defence, Enterprises & Data Centers, Energy & Utilities, Manufacturing, Banking, Financial Services, & Insurance, Retail, Media & Entertainment, and Others. Regionally, the market is classified into North America, Latin America, Western Europe, Eastern Europe, Balkan & Baltic Countries, Russia & Belarus, Central Asia, East Asia, South Asia & Pacific, and the Middle East & Africa.
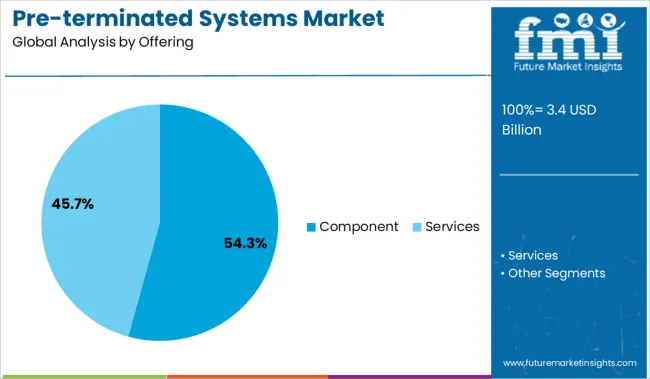
The Component segment is projected to hold 54.3% of the pre-terminated systems market revenue in 2025, maintaining its position as the leading offering. This growth is attributed to the versatility and flexibility of pre-terminated components, which allow network designers to customize and assemble fiber optic systems with reduced installation time.
Components such as connectors, adapters, and patch cords simplify network build-out and facilitate easier maintenance. The increasing complexity of modern network architectures demands modular and scalable cabling solutions, making pre-terminated components highly preferred.
Their use in data centers and enterprise environments has been especially prominent due to the need for rapid deployment and high-density connectivity. As network demands evolve, the Component segment is expected to retain its dominant role by enabling efficient fiber optic infrastructure expansion.
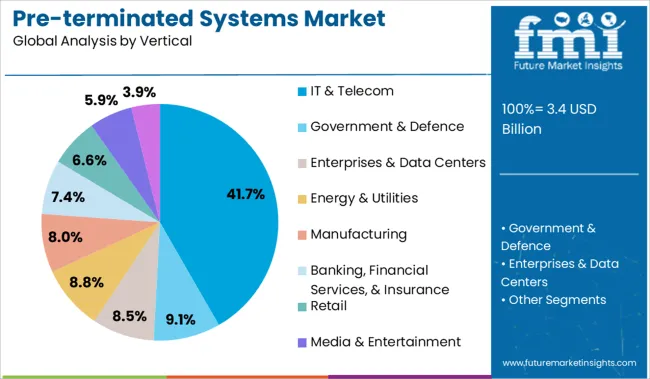
The IT and Telecom vertical is anticipated to contribute 41.7% of the pre-terminated systems market revenue in 2025, positioning it as the largest end-use sector. The surge in data consumption and the rollout of next-generation communication technologies have intensified the demand for high-performance fiber optic networks in this vertical.
Telecom operators and IT service providers are investing heavily in upgrading backbone and access networks to support bandwidth-intensive applications and cloud services. Pre-terminated systems offer these industries the advantage of faster deployment, improved signal integrity, and reduced labor costs.
Furthermore, the requirement for robust and scalable infrastructure to meet growing connectivity needs has driven widespread adoption within the IT and Telecom sector. As digital transformation continues, this vertical is expected to sustain its leading market position.
As per the Pre-terminated Systems Market research by Future Market Insights - a market research and competitive intelligence provider, historically, from 2020 to 2024, the market value of the Pre-terminated Systems Market increased at around 8.7% CAGR. However, the projected CAGR is expected to be slightly lower than the historical CAGR.
The use of voice-over-internet protocol, long-term evolution (LTE), and 5G networks are expected to provide considerable growth opportunities for organizations in the pre-terminated system market. Since 2G and 3G networks cannot meet expanding carrier capacity demands, the emerging trend of LTE and 5G networks will give opportunities for fiber optic cables, making them a vital component of data centers in the near future.
Several data centers and data-reliant enterprises are attempting to make more sustainable and ecologically sound decisions while planning and deploying their high-density networks. They requirement includes that their systems deliver great performance and stability for long-term network uptime, without incurring large expenditures for updates, system maintenance, and administration.
With an ever-increasing demand for more bandwidth and flexibility to support future expansion, they are increasingly seeing the network's physical media infrastructure and full life cycle as a capital expenditure critical to meeting business objectives.
The rising usage of pre-terminated structured systems is one emerging trend. The factory bundles and pre-terminated optical-fiber and copper cable systems eliminates the requirement for field termination on-site. They are ideally suited for long-term network configurations that include both present and future requirements.
Hellermann Tyton's pre-terminated RapidNet system has grown significantly in recent years to meet the needs of a diverse set of applications and cabling scenarios. While the pre-terminated cassette-to-cassette format is most typically used in cabinet-to-cabinet applications such as data centers or large communications rooms, the RapidNet solution provides versatility, allowing the pre-terminated solution to perform in any network architectural scenario.
Pre-terminated assemblies have a higher initial cost since they involve factory termination time, however the savings outweigh the cost. Security is always a key concern in data centers. A pre-terminated wiring system offers additional security benefits.
A pre-terminated solution necessitates less installation labour, making it easier to manage "contract personnel." While installing pre-terminated assemblies needs less specialized knowledge, organizations can also use their own employees to perform the operation.
A pre-terminated system's installation time and costs are significantly reduced, making it appealing to consumers. Network performance and reliability are ensured by the in-factory testing and validation of components, and material savings of 50% or more are usual when employing pre-terminated systems rather than traditional systems.
To guarantee mechanical integrity and to decrease mechanical stress during installation, certain pre-terminated cable designs employ a braided sleeve and pulling eyes for routing assemblies through overhead trays, elevated floors, cabinet poke-throughs, and cable-management devices.
Most of the top manufacturers provide long-term guarantees for pre-terminated systems, which may save certification and testing time and costs, positively affecting demand.
The physical layer's modular components are reusable. They may be dismantled and repurposed to allow for transfers, additions, and changes, providing more flexibility and mobility as well as a clear migration route to enable new technologies and applications as a business expands as demands change and adapt.
Demand for pre-terminated systems is driven by their more meticulous design, which results in a cleaner look as well as faster and easier cable management, maintenance, and troubleshooting.
North America is the most lucrative region with the highest Pre-terminated Systems Market Share. Several key North American manufacturers are focusing on the development of cutting-edge network cabling system technologies, which is likely to augment the region's pre-terminated systems market throughout the projected period. Because of the digital revolution of enterprises, data centers in this region are undergoing major transformation.
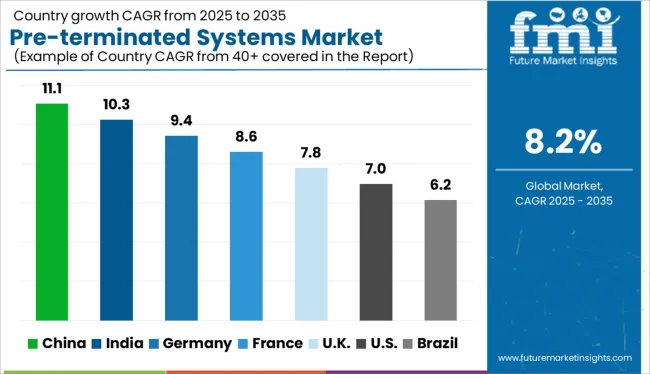
The United States is expected to have the highest market of USD 7.5 Billion by the end of 2035 with North America being the dominant player and accounting for over 36% of total sales. The pre-terminated systems industry in the USA is dominated by companies such as Optical Cable Corporation, Corning Incorporated, CommScope Holding Company, Inc., Amphenol Corporation, and Belden Inc. which are investing significantly on research and development in order to provide cost-effective and creative solutions.
Belden's REVConnect Pre-Terminated System, for example, is the first solution to let applications run outside of the data center. Due to its modest copper pre-term bundle diameter, it provides a rapid-deployment infrastructure solution for data centers and commercial LANs.
It removes the need for field termination, reducing time while also providing a more cost-effective, high-quality, and adaptable plug-and-play solution. Installers can subsequently connect to a jack, plug, or coupler by using a REVConnect universal core at either end. End users can terminate and test the new connector without having to contact the installer again.
Components segment is forecasted to grow at the highest CAGR of over 7.9% during 2025 to 2035. Pre-terminated systems provide advantages such as reduced labor costs and less congestion in cable pathways and spaces, as well as reduced on-site installation time and security risks.
Various factors are leading to the rising usage of pre-terminated systems, including the growing acceptance of solutions to reduce data center building costs and enhance return on investment.
Cable connectors, patch panels, patch cords, and fiber enclosures are all components that help the pre-terminated systems industry grow further.
As a result of the global digital transformation, the cable business is expanding. The key drivers of market growth are dependable connection, high performance, and efficiency. High-performance networks are critical for companies, industries, security, and the media.
Furthermore,USB Type-C and HDMI interfaces are frequently utilized. Wireless communication is a rapidly growing communication market. The market's ever-increasing need for LAN is moving the Pre-teminated fiber patch panel accessories market ahead.
Due to the increasing demand for data to support streaming video and the increased use of mobile broadband communications, network switching architecture has progressed substantially over the previous 10 years. In addition, demand is expected to remain at an all-time high.
The demand for higher density fiber optic enclosures is logical given the shift from copper to fiber as the standard for high-performance data communications and the number of fibers required to satisfy escalating standards, such as 100 GBit/s Ethernet, for individual connections.
The Enterprises and Data Centers segment is forecasted to grow at the highest CAGR of over 7.8% during 2025-2035. Since they allow for simple transfers, additions, and modifications within the work environment, pre-determined systems are widely employed in enterprise and data center applications. As a result, pre-terminated systems are vital to the ever-changing work environment as they enable fast reconfigurations inside the work arena.
As the number and scale of data centers increase, so does the need for more cabling to satisfy today's increasing data storage and application processing demand. Alternative methods for minimizing connection and installation time, as well as facilitating the deployment of modern, durable cable networks, have been developed in response to increased demand for improved or new data centers.
By connecting two separate user sites for data transmission, the network of cable systems facilitates the smooth and rapid flow of voice, data, and video signals from one site to another or from one system to another. Due to these factors, demand for pre-terminated systems forcorporate and data center applications is increasing, thus fuelling the worldwide pre-terminated systems market throughout the forecast period.
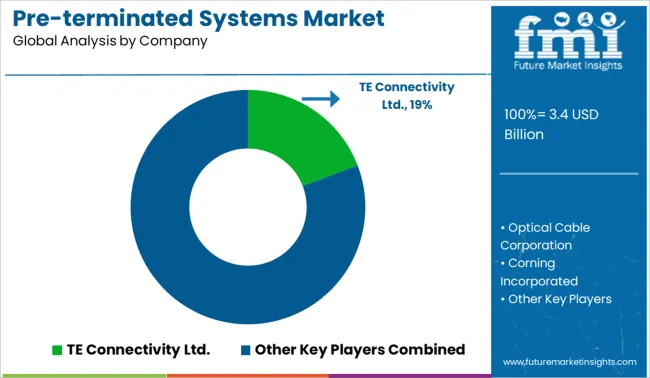
Among the leading global Pre-terminated Systems market players are TE Connectivity Ltd., Optical Cable Corporation (OCC), Corning Incorporated, Commscope, and Amphenol Corporation. To gain a competitive advantage in the industry, these market players are investing in product launches, partnerships, mergers and acquisitions, and expansions.
Due to the growing demand for the product around the world, many new companies are expected to enter the market. This is expected to increase competition on a worldwide scale. Additionally, market growth is expected to be fueled by collaborations among current players to improve quality throughout the research period. Over the projection period, established market players are expected to diversify their portfolios and offer one-stop solutions to combat fierce competition.
Some recent product development and mergers and acquisitions are as follows:
In April 2025, The Siemon Company, a global network infrastructure supplier announced the release of LightVerse High-Density Fiber Optic Cabling System, which increases fiber network performance, administration, scalability, and flexibility in data center and LAN environments. LightVerse will support up to 96 fiber terminations in a single rack unit for any type of termination, which includes pre-terminated, splice terminated, and field terminated fiber systems.
In April 2025, Belden, a global leader in specialised networking solutions, is pleased to announce that its Digital Electricity (DE) Cables are the industry's first UL Class 4 product. As buildings become increasingly complex, digital electricity cables can enable new digital power technologies that are both safe and efficient. Class 4 is a brand-new categorization standard for fault-managed power systems. Power over Ethernet (PoE) systems, which may provide up to 100W, provide the ease and security of low-voltage power.
In August 2024, Leviton recently acquired the well-known US cable manufacturer Berk-Tek. Berk-Tek branded copper and fiber cables, industrial ethernet solutions, and network extenders will complement Leviton's industry-leading pre-terminated systems offering. Customers can now choose from a broader range of products and services, all of which are manufactured in the United States, contributing to the success in North America’s Pre-terminated Systems market growth.
Similarly, recent developments related to companies in Pre-terminated Systems services have been tracked by the team at Future Market Insights, which are available in the full report.
The global pre-terminated systems market is estimated to be valued at USD 3.4 billion in 2025.
The market size for the pre-terminated systems market is projected to reach USD 7.5 billion by 2035.
The pre-terminated systems market is expected to grow at a 8.2% CAGR between 2025 and 2035.
The key product types in pre-terminated systems market are component, _cables, _connectors, _adapter plates, _patch panels, _patch cords, _cassette modules, _pigtails, _fiber enclosures, services, _design & engineering services, _installation services and _post installation services.
In terms of vertical, it & telecom segment to command 41.7% share in the pre-terminated systems market in 2025.


Full Research Suite comprises of:
Market outlook & trends analysis
Interviews & case studies
Strategic recommendations
Vendor profiles & capabilities analysis
5-year forecasts
8 regions and 60+ country-level data splits
Market segment data splits
12 months of continuous data updates
DELIVERED AS:
PDF EXCEL ONLINE
Systems Administration Management Tools Market Size and Share Forecast Outlook 2025 to 2035
VRF Systems Market Growth - Trends & Forecast 2025 to 2035
Cloud Systems Management Software Market Size and Share Forecast Outlook 2025 to 2035
Hi-Fi Systems Market Size and Share Forecast Outlook 2025 to 2035
Cough systems Market
Backpack Systems Market Size and Share Forecast Outlook 2025 to 2035
Unmanned Systems Market Analysis - Size, Share, & Forecast Outlook 2025 to 2035
DC Power Systems Market Trends - Growth, Demand & Forecast 2025 to 2035
Catheter Systems Market
Reporter Systems Market
Aerostat Systems Market
Cryogenic Systems Market Size and Share Forecast Outlook 2025 to 2035
Air Brake Systems Market Growth & Demand 2025 to 2035
Metrology Systems Market
Fluid Bed Systems Market
Cognitive Systems Spending Market Report – Growth & Forecast 2016-2026
Nurse Call Systems Market Insights - Size, Share & Forecast 2025 to 2035
Excitation Systems Market Analysis – Growth, Demand & Forecast 2025 to 2035
Fire Alarm Systems Market by Solution by Application & Region Forecast till 2035
Ultrasound Systems Market Growth – Trends & Forecast 2025-2035

Thank you!
You will receive an email from our Business Development Manager. Please be sure to check your SPAM/JUNK folder too.
Chat With
MaRIA