

- Market Size (2026)
- USD 16.2 Bn
- Forecast (2036)
- USD 55.0 Bn
- CAGR (2026 to 2036)
- 13.0%
How big is Process Mining Market in 2026?
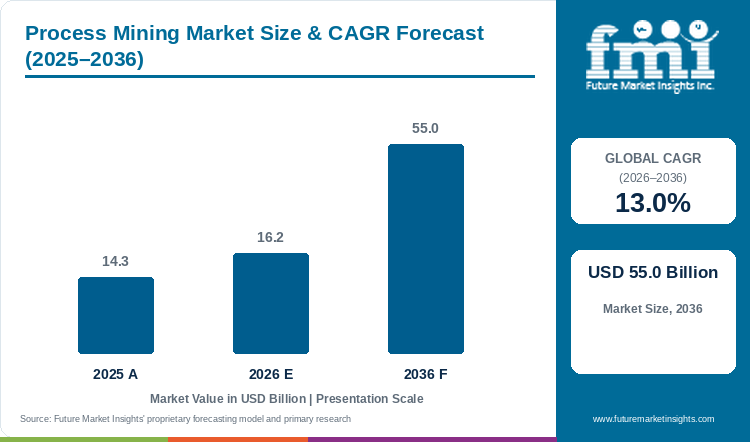
Sales in the process mining market are projected to grow at 13.0% CAGR, with the market size rising from USD 14.3 Billion in 2025 to USD 16.2 Billion in 2026 and reaching USD 55.0 Billion by 2036.
Accelerating enterprise complexity across multi-tiered software architectures has compelled operations leaders to deploy objective process intelligence tools. Modern business transactions frequently traverse multiple disparate systems including ERP, CRM, procurement platforms, and email workflows, obscuring the actual sequence of execution from administrative oversight. This operational fragmentation creates friction across order-to-cash and procure-to-pay lifecycles, causing hidden rework loops, compliance deviations, and delayed cycle times that traditional manual process audits fail to uncover. According to Future Market Insights analysis, the global process mining market stands at USD 14.3 Billion in 2025 and rises to USD 16.2 Billion in 2026. Industry valuation is projected to reach USD 55.0 Billion by 2036 at a 13.0% CAGR, generating USD 38.8 Billion in added revenue over the forecast period. The market expansion is supported by enterprise integration with robotic process automation systems, as organizations seek to reconstruct execution paths directly from system event logs [1]. Process mining software represents the leading component with a 44.2% share in 2026, driven by automated event-log ingestion, graph discovery, and conformance analytics. Across profiled economies, growth spans from 12.6% in Germany to 13.8% in Australia, though legacy data quality deficits, missing timestamps, and workforce monitoring privacy policies continue to limit implementation velocity.
Key Market Trends & Insights
- By component: Process mining software is projected to hold 44.2% share in 2026, as it forms the main layer used for event-log preparation, process discovery, conformance checking and performance analysis.
- By deployment: Cloud is estimated to account for 38.1% share in 2026. The model fits enterprises that need to refresh large event datasets without building separate infrastructure for every process.
- By application: Process discovery is expected to lead application with 45.4% share in 2026, since most companies first need to see the actual process before they can standardize or automate it.
- By end use: BFSI is forecast to represent 46.3% of end-use demand in 2026, supported by large transaction volumes, audit requirements and the need to trace exceptions in lending, payments, onboarding and claims.
Regional Highlights
- Fastest-growing evaluated country: Australia, at 13.8% CAGR from 2026 to 2036.
- By country: Canada at 13.7%, the USA at 13.4%, the UK at 13.0%, and Japan at 12.7% follow, while Germany records the lowest evaluated CAGR at 12.6%.
Market Size & Forecast
Table 1: Market Size and Forecast for the Process Mining Market (USD Billion and CAGR percentage), 2025 to 2036
| Metric | Value |
|---|---|
| 2025 Market Size | USD 14.3 Billion |
| Estimated Market Size in 2026 | USD 16.2 Billion |
| Projected Market Size by 2036 | USD 55.0 Billion |
| CAGR, 2026 to 2036 | 13.0% |
| Added Revenue, 2026 to 2036 | USD 38.8 Billion |
FMI analysis finds that corporate IT teams are spending more time on preparing data than drawing the process map itself. Event logs require consistent case identifiers, standardized activity descriptors, and granular timestamps before algorithms can reliably reconstruct execution sequences. In 2025, IEEE standards established strict requirements for event log validation across enterprise data pipelines [1]. When required data fields are overwritten or maintained under disparate naming conventions, process graphs misrepresent actual operational routes. Consequently, enterprises are combining process intelligence initiatives with cloud enterprise infrastructure and master data governance rather than treating process mining as a standalone analytics tool.
Event Log Ingestion Throughput and Process Graph Complexity Sizing
Table 2: Event Log Ingestion Throughput and Process Graph Complexity Sizing for the Process Mining Market (trillion events, variants, and minutes), 2025 to 2036
| Metric | 2025 | 2026 | 2036 |
|---|---|---|---|
| Market size (USD Billion) | 14.3 | 16.2 | 55.0 |
| Global enterprise event logs analyzed monthly (trillion events) | 18.5 to 24.0 | 22.0 to 28.5 | 95.0 to 130.0 |
| Average case variants identified per core business process | 120 to 350 | 140 to 420 | 280 to 850 |
| Automated process drift detection speed (minutes per million events) | 45 to 90 | 35 to 75 | 5 to 15 |
These sizing indicators show the direction of commercial workloads considered in the report and are not presented as an external technology benchmark. Higher event volumes are expected as more transactions move through connected ERP, CRM and supply chain systems. The rise in case variants is also important, because a process with hundreds of execution paths cannot be understood properly through interviews alone. Faster drift detection could support continuous monitoring, but the benefit will remain limited if the underlying activity names and timestamps are incomplete.
Enterprise System Connector Deployment & Licensing Sizing
Enterprise data pipelines pull transaction records from SAP, Oracle, Salesforce and other operational systems. These records are then aligned around a case ID, activity and timestamp so that the software can show where the process started, which steps were repeated, where it waited and how it ended. Sponsoring automated log integration with artificial intelligence platforms accelerates root-cause diagnosis. As per the analysis from FMI, connector engineering is one of the main reasons professional services remain part of market revenue, as the same business process is stored differently across operating units.
Table 3: Enterprise System Connector Deployment and Licensing Sizing for the Process Mining Market (tenants and USD), 2025 to 2036
| Metric | 2025 | 2026 | 2036 |
|---|---|---|---|
| Active enterprise process mining production tenants (thousand) | 12.80 | 14.60 | 44.50 |
| Average annual process intelligence spend per tenant (USD) | 1,117,190 | 1,109,590 | 1,235,950 |
| Standard enterprise platform subscription price band (USD/year) | 120,000 to 260,000 | 115,000 to 250,000 | 95,000 to 210,000 |
| High-throughput transactional data tier price band (USD/year) | 280,000 to 650,000 | 270,000 to 620,000 | 220,000 to 510,000 |
Table 4: Channel and Segment Revenue Indicators for the Process Mining Market (USD Billion and percentages), 2026
| Metric | Value | Basis |
|---|---|---|
| Market size, 2026 | USD 16.2 Billion | Report value |
| BFSI sector revenue, 2026 | USD 7.5 Billion | 46.3% share |
| Process discovery revenue, 2026 | USD 7.4 Billion | 45.4% share |
| Process mining software revenue, 2026 | USD 7.2 Billion | 44.2% share |
Analyst Perspective
“Process mining is moving from periodic diagnosis towards continuous process checking. The value will not only come from finding a bottleneck, but from connecting the finding with the team that can correct it and then checking whether the same deviation returns.”
- Sudip Saha, Principal Consultant, Future Market Insights.
How is the process mining market segmented?
The process mining market is segmented by component, deployment, application, and end use. In 2026, process mining software is projected at 44.2%, cloud at 38.1%, process discovery at 45.4%, and BFSI at 46.3%.
By component: process mining software, task mining software, process intelligence platforms, and professional services.
By deployment: cloud, on-premises, hybrid, and managed service.
By application: process discovery, conformance checking, enhancement & prediction, and automation identification.
By end use: BFSI, manufacturing, healthcare, and public sector.
Why does process mining software lead the component category?
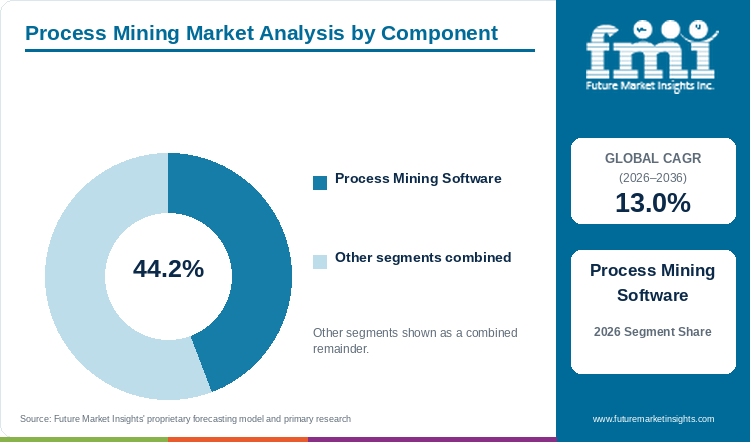
Process mining software is projected to capture 44.2% of component revenue in 2026, supported by core log reconstruction and performance visualization.
Table 5: Component Share for the Process Mining Market (percentage share), 2026
| Component | Share (2026) |
|---|---|
| Process Mining Software | 44.2% |
| Other Segments Combined | 55.8%* |
| Total | 100.0% |
*Calculated as the balance remaining after deducting the leading segment share from 100.0%.
Table 6: Component Leadership and Market Growth for the Process Mining Market (component and CAGR percentage), 2026 to 2036
| Metric | Value |
|---|---|
| Global CAGR (2026 to 2036) | 13.0% |
| Leading Segment | Process Mining Software |
The 44.2% share of process mining software is linked with the first problem buyers are trying to solve, which is seeing the process as it ran and not as it was described in a workshop. The software joins event records and makes repeated approval, skipped activity or long waiting time visible at case level. In 2025, NIST guidelines on system event logging highlighted the role of tamper-evident audit trails in automated compliance monitoring [2]. Deployments leveraging hybrid cloud architecture give process owners verifiable evidence before capital is placed into automation. Demand will remain stronger where connectors shorten event preparation, while products requiring heavy custom mapping face slower expansion.
- Process mining software is projected to hold 44.2% of component revenue in 2026, supported by core log reconstruction and performance visualization.
- In 2026, Microsoft detailed expanded algorithmic capabilities in Power Automate for process graph reconstruction across enterprise event logs [3]
What drives cloud to the forefront of the deployment segment?
Cloud deployment is estimated to represent 38.1% of deployment demand in 2026, reflecting centralized log processing and elastic computing power.
Cloud is estimated to capture 38.1% in 2026 because several teams can use the same analysis environment and refresh a large event base without building separate infrastructure for each process. Synergies with workflow management software enable continuous synchronization between process discovery and execution alerts. However, the share does not mean every workload is moving fully outside the enterprise. Transaction records still need correct field mapping and regulated information may have to remain under local control, keeping hybrid models relevant.
- Cloud deployment is estimated to account for 38.1% in 2026 as SaaS delivery streamlines multi-department analytics access.
- In 2026, ISO/IEC standards on information technology confirmed best practices for safeguarding transactional logs in multi-tenant environments [4]
How does process discovery maintain its 45.4% share in the application segment?
Process discovery is expected to hold 45.4% of application turnover in 2026, driven by enterprise necessity to visualize baseline workflows.
Process discovery is expected to hold 45.4% share because an enterprise normally cannot check conformance or select an automation point before it sees how the case is actually moving. This is critical in enterprise resource planning workflows where an exception returns work to an earlier team, creating routes absent from approved documentation. Discovery gives the first usable view of these variants. Its lead could narrow later as mature users move spending towards prediction, but new adopters will keep discovery dominant.
- Process discovery leads application demand with 45.4% share in 2026, providing the empirical baseline required for transformation.
- In 2026, UiPath documented that objective process discovery reduces automation failure rates by isolating broken process branches before bot deployment [5]
What positions BFSI as the leading end use category in 2026?
BFSI is forecast to account for 46.3% of end-use expenditure in 2026, owing to stringent compliance audits and massive transactional volumes.
BFSI is forecast to account for 46.3% in 2026 because a delayed approval or missing check in a regulated workflow creates severe audit liability. Integrating process mining with business process management suites provides banks and insurers with continuous compliance visibility across lending, claims, and KYC operations. Adoption progresses rapidly where institutions pseudonymize case records, while unconstrained desktop capture remains subject to protracted legal review.
- BFSI accounts for 46.3% of end-use demand in 2026, driven by high transaction volume and rigorous audit requirements.
- In 2025, European cybersecurity and banking guidelines mandated verifiable electronic audit trails across financial transaction handling [6]
What are the drivers, restraints, and opportunities in the process mining market?
Complex enterprise systems and fact-based compliance audits push adoption, while fragmented event logs and employee privacy concerns constrain rollouts, and predictive execution triggers create value.
- Driver: Multi-system enterprise operations create repeated approvals, rework and process blind spots, encouraging companies to reconstruct the actual flow from event records.
- Restraint: Legacy data gaps, inconsistent case identifiers and privacy concerns around desktop task capture restrict large-scale implementation.
- Opportunity: Process simulation, predictive monitoring and action triggers can move the market from finding problems towards correcting them earlier.
Growth Analysis and Future Potential: Enterprise Architecture Complexity and Conformance Drivers
Most large organizations operate one process through several applications. A purchase may begin in an e-procurement system, move into ERP, pass through email approval and end in a payment platform. Once this happens, the business can see the final payment but may not see why it took longer or why the invoice returned to the same team. Deploying reliable data integration pipelines allows organizations to bridge disparate system silos and construct end-to-end execution maps. As noted by FMI, operational visibility becomes critical when cross-system delays generate measurable financial penalties or customer churn. Process mining provides empirical evidence of structural friction, enabling executive leaders to justify targeted modernization investments based on verified execution data.
Risk Assessment and Operational Hurdles: Task Privacy and Log Ingestion Friction
The key hurdle is not always the algorithm. In many deployments, older applications use different names for the same activity or overwrite earlier timestamps, which makes the process appear cleaner or more broken than it actually is. Task mining can add another difficulty because it records desktop actions and may capture information outside the intended process. Companies need to define what will be collected, who can see it, how long it will remain stored and how personal details will be masked. If these controls are not built before the pilot, employee resistance and security review can delay wider adoption even when the business case is strong.
Commercial Opportunity Analysis: Simulation, Prediction and Action
The market opportunity is moving beyond a static process map. Vendors are adding simulation, predictive monitoring and workflow links so the user can test what may happen if an approval step is removed, capacity is shifted or an exception is routed earlier. Aligning process intelligence with wider digital transformation programs enables platforms to trigger automated corrective interventions when operational drift occurs, elevating process mining into an active operational control layer.
Process Mining Market by Country (2026 to 2036)
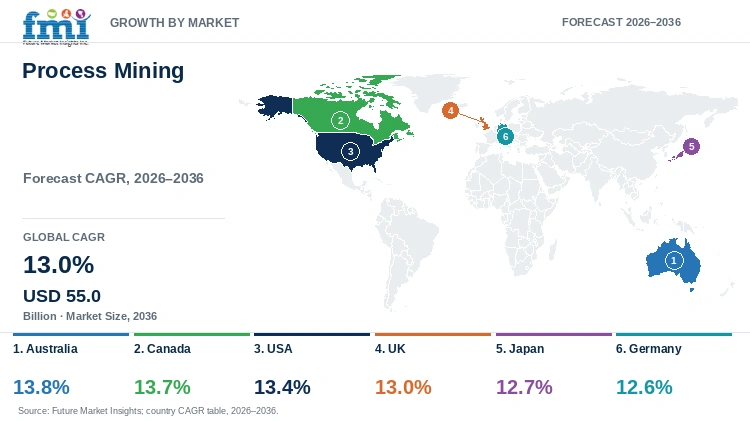
As per FMI, Australia is the fastest-growing process mining market among the six evaluated countries at 13.8% CAGR from 2026 to 2036, while Germany records 12.6% CAGR. The gap between the countries is not very wide, which indicates that adoption is spreading across mature enterprise software markets. What differs is the process being prioritized, the level of cloud acceptance, the structure of local industries and the privacy review needed before employee-level task data can be used.
Table 7: Country CAGR and Primary Growth Levers for the Process Mining Market (CAGR percentage and operational drivers), 2026 to 2036
| Country | CAGR (2026 to 2036) | Primary Growth Lever |
|---|---|---|
| Australia | 13.8% | Mining, banking and public-sector process visibility |
| Canada | 13.7% | Public-service modernization and financial workflow auditing |
| USA | 13.4% | Large enterprise cloud programs and shared-service optimization |
| UK | 13.0% | Financial compliance and public-service workflow improvement |
| Japan | 12.7% | Manufacturing standardization and workforce constraints |
| Germany | 12.6% | Industrial ERP harmonization and strict employee data governance |
Source: Future Market Insights analysis
Australia Process Mining Market Outlook (2026 to 2036)
Australia is expected to record 13.8% CAGR through 2036. The growth angle is different from a general office-automation market because a mining or utility case can begin at a remote site and finish inside a central procurement or maintenance system. Process mining becomes valuable when equipment work orders, contractor approvals, and inventory movements need to be read as one continuous case. Distance between remote operations elevates the requirement for enterprise data security and sovereign hosting. Suppliers possessing localized integration capability and connectors for asset-heavy operations convert enterprise pilots rapidly into long-term commercial subscriptions.
Key takeaway: In Australia, resource sector workflow complexity and localized data compliance drive robust demand for operational process intelligence.
Canada Process Mining Market Outlook (2026 to 2036)
Canada is projected to expand at 13.7% CAGR during the period. Public-service and healthcare administration create substantial demand, but the opportunity is not only coming from a need to automate digital forms. One case can move between federal, provincial and institutional systems, and the absence of a common identifier can make the complete route difficult to rebuild. Bilingual workflow design and public procurement cycles add implementation time. Growth is likely to improve where departments first select one high-volume service and agree the data-sharing rule, instead of attempting a broad cross-agency program from the start.
Key takeaway: In Canada, public sector digital transformation and inter-agency workflow harmonization provide primary expansion catalysts.
USA Process Mining Market Outlook (2026 to 2036)
The USA process mining market is forecast to grow at 13.4% CAGR through 2036. Large shared-service operations can generate enough event volume to show a business case quickly, which separates the country from smaller markets where a pilot may take longer to prove. The same scale can expose different approval habits across business units and create resistance once local workarounds become visible. Invoice rework, order delay or customer onboarding is likely to gain budget earlier than an enterprise-wide platform plan because the owner, cost and correction can be fixed to one process. Platforms providing continuous automated monitoring secure high renewal rates across multinational accounts.
Key takeaway: In the USA, shared services scale and rapid return-on-investment timelines reward platforms featuring automated workflow correction.
UK Process Mining Market Outlook (2026 to 2036)
The UK is estimated to progress at 13.0% CAGR during the forecast period. Financial services and public operations provide a strong base because evidence behind an exception is nearly as important as the exception itself. Process mining can support this requirement by keeping the route visible from the first event to the final outcome. Budget pressure may still stop a proof of concept from moving into production when savings are described broadly. Adoption is likely to move in favour of suppliers that connect one service-level failure with a measurable cost and keep employee and customer information under a clear access rule.
Key takeaway: In the UK, financial regulatory audit requirements and public sector efficiency mandates anchor recurring enterprise demand.
Japan Process Mining Market Outlook (2026 to 2036)
Japan is expected to register 12.7% CAGR from 2026 to 2036. Workforce constraint gives process visibility a direct operating value as manufacturers and back-office teams need to remove repeated work before fewer employees are asked to handle the same volume. The hurdle is that heavily customized ERP systems and local approval practices can make event extraction more difficult than the global software story suggests. Japanese-language use and local partner support can push adoption, but the deciding point will be whether the provider can map modified systems without forcing the company to replace the process before it can be understood.
Key takeaway: In Japan, severe demographic labor shortages compel corporations to eliminate administrative rework through process visibility.
Germany Process Mining Market Outlook (2026 to 2036)
Germany is forecast to advance at 12.6% CAGR through 2036. Its opportunity is closely tied with industrial ERP harmonization, especially where procurement and production cases cross several SAP environments. The market leans towards system-level event analysis rather than broad desktop capture because works-council review becomes central when employee activity is visible. Projects with a stated process purpose, pseudonymized case data and agreed access move steadily, while a technically strong pilot without this design remains under review for longer.
Key takeaway: In Germany, industrial ERP harmonization drives deployment, provided solutions adhere strictly to co-determination and privacy regulations.
Full report country coverage includes North America, Latin America, Western Europe, Eastern Europe, East Asia, South Asia and Pacific, and Middle East and Africa.
Who are the notable companies in the process mining market?
Celonis SE, UiPath Inc., SAP SE (Signavio), Software AG (ARIS), Microsoft Corporation, ABBYY Solutions Ltd., Apromore Pty Ltd, and IBM Corporation are significant market participants.
The competitive market includes dedicated process mining providers, business process management vendors, ERP companies and automation platforms. Customers compare data preparation, source-system connectors, conformance analysis, task mining, simulation, security and the ability to send an insight into a workflow. Microsoft, SAP and UiPath documentation shows that process mining products are built around event data, process visualization and performance analysis, though the depth and surrounding ecosystem differs by provider.
- Dedicated process intelligence platforms: Celonis SE and Apromore Pty Ltd focus on process discovery, conformance, analysis and process improvement use cases.
- Integrated ERP and business process suites: SAP Signavio and ARIS connect process intelligence with wider process management and enterprise architecture work.
- Cloud and automation ecosystems: Microsoft, UiPath and IBM place process mining close to workflow automation, task analysis and broader cloud services.
Competitive Benchmarking: Process Mining Market
Table 8: Competitive Benchmarking for the Process Mining Market (qualitative capability ratings), 2026
| Company | Process Analysis | Connector Breadth | Automation Link | Geographic Reach |
|---|---|---|---|---|
| Celonis SE | High | High | High | High |
| UiPath Inc. | High | High | High | High |
| SAP SE (Signavio) | High | High | Medium | High |
| Software AG (ARIS) | High | High | Medium | High |
| Microsoft Corporation | High | High | High | High |
| ABBYY Solutions Ltd. | Medium | Medium | Medium | High |
| Apromore Pty Ltd | High | Medium | Medium | Medium |
| IBM Corporation | High | High | High | High |
Scoring basis: High indicates broad public evidence across the named capability. Medium indicates narrower but established capability. Low indicates an early-stage or concentrated position.
Key Developments and Product Direction
- In 2026, Microsoft detailed expanded algorithmic capabilities in Power Automate for process graph reconstruction across enterprise event logs [3]
- In 2026, UiPath documented that objective process discovery reduces automation failure rates by isolating broken process branches before bot deployment [5]
- In 2026, SAP Signavio Process Intelligence expanded automated process flow analysis and continuous conformance metrics within its enterprise business transformation suite.
- In 2026, Apromore integrated advanced process simulation and predictive monitoring capabilities within its core process intelligence platform.
Key Players in the Process Mining Market
Dedicated Process Intelligence Platforms
- Celonis SE
- Apromore Pty Ltd
Integrated Enterprise and Cloud Software Suites
- Microsoft Corporation
- SAP SE (Signavio)
- UiPath Inc.
- IBM Corporation
- Software AG (ARIS)
- ABBYY Solutions Ltd.
Process Mining Market - Report Scope
Table 9: Report Scope for the Process Mining Market, 2026 to 2036
| Coverage field | Report scope |
|---|---|
| Market breakdown | Component; Deployment; Application; End Use |
| Quantitative Units | USD Billion |
| Market Definition | Software license, SaaS subscription and professional service revenue related to process mining, task mining and conformance checking. |
| Regions Covered | North America; Latin America; Western Europe; Eastern Europe; East Asia; South Asia and Pacific; Middle East and Africa |
| Countries Covered | Australia, Canada, USA, UK, Japan, Germany, and additional countries in the full report |
| Key Companies Covered | Celonis SE, UiPath Inc., SAP SE (Signavio), Software AG (ARIS), Microsoft Corporation, ABBYY Solutions Ltd., Apromore Pty Ltd, IBM Corporation |
| Forecast Period | 2026 to 2036 |
| Approach | Primary and secondary research with market triangulation. |
Process Mining Market - Research Methodology
Table 10: Research Methodology for the Process Mining Market, 2026 edition
| Method | Approach |
|---|---|
| Primary Research | Primary discussions cover enterprise architects, software implementation leads, IT procurement heads, operations directors, and technology development teams across the global ecosystem. |
| Secondary Research | Secondary sources include corporate financial filings, product documentation, standards publications, technical whitepapers, data protection regulatory guidance, and academic research. |
| Market Sizing and Forecasting | Top-down and bottom-up sizing models evaluate enterprise software expenditures, license categories, deployment configurations, and tenant subscription tiers for 2026 to 2036. |
| Data Triangulation and Validation | Estimates are verified against macroeconomic indicators, cloud adoption rates, IT investment trends, and competitive vendor revenue disclosures to prevent double counting. |
Process Mining Market by Segments
Process Mining Market segmented by Component:
- Process Mining Software
- Task Mining Software
- Process Intelligence Platforms
- Professional Services
Process Mining Market segmented by Deployment:
- Cloud
- On-Premises
- Hybrid
- Managed Service
Process Mining Market segmented by Application:
- Process Discovery
- Conformance Checking
- Enhancement & Prediction
- Automation Identification
Process Mining Market segmented by End Use:
- BFSI
- Manufacturing
- Healthcare
- Public Sector
Process Mining Market by Region
- North America
- United States
- Canada
- Latin America
- Brazil
- Mexico
- Argentina
- Chile
- Western Europe
- Germany
- France
- United Kingdom
- Italy
- Spain
- Benelux
- Nordics
- Eastern Europe
- Poland
- Czech Republic
- Romania
- Hungary
- East Asia
- China
- Japan
- South Korea
- South Asia and Pacific
- India
- ASEAN
- Australia and New Zealand
- Middle East and Africa
- GCC Countries
- South Africa
- Türkiye
- Israel
Research Sources and Bibliography
- [1] IEEE Task Force on Process Mining. (2025). Process mining manifesto and event data standards. IEEE Computational Intelligence Society.
- [2] National Institute of Standards and Technology. (2025). Guidelines on event logging, data integrity, and information security management. U.S. Department of Commerce.
- [3] Microsoft Corporation. (2026). Overview of process mining and task mining in Power Automate.
- [4] International Organization for Standardization. (2026). ISO/IEC 33001: Information technology — Process assessment — Concepts and terminology.
- [5] UiPath Inc. (2026). Enterprise process mining and continuous monitoring architecture.
- [6] European Union Agency for Cybersecurity (ENISA). (2025). Technical guidelines on security log analysis and audit trails in cloud environments.
This bibliography is provided for reader reference and is not exhaustive. The full report contains the complete source list and detailed citations.
This Report Answers
- How large is the process mining market in 2026 and what is forecast for 2036?
- Which operational factors support enterprise process mining deployment?
- Why does process mining software lead the component category?
- How does cloud deployment accelerate multi-department process analytics?
- How do evaluated growth rates differ across Australia, Canada, USA, UK, Japan, and Germany?
- Which companies compete across process discovery, conformance, and automation integration?
- What limits adoption or scaling in the process mining market?
- What architectural criteria should buyers evaluate before procuring process intelligence tools?
Frequently Asked Questions
How big is the process mining market in 2026, and what is forecast for 2036?
Future Market Insights estimates that the global process mining market will reach USD 16.2 Billion in 2026 and USD 55.0 Billion by 2036.
What is the CAGR for the process mining market from 2026 to 2036?
As per FMI, the market is projected to expand at 13.0% CAGR during the assessment period.
Which component segment leads the market?
Process mining software is projected to account for 44.2% share in 2026, owing to its use in data preparation, process discovery, conformance and performance analysis.
Which application segment leads the market?
Process discovery is expected to hold 45.4% share in 2026, as companies need an as-is view before standardization or automation.
Which country has the strongest evaluated growth outlook?
Australia is projected to register 13.8% CAGR from 2026 to 2036, supported by financial, mining and public-sector process visibility requirements.
Who are the key players?
Notable providers include Celonis, UiPath, SAP Signavio, ARIS, Microsoft, ABBYY, Apromore, and IBM.
Preview the report firsthand - request a free sample
Get SampleGet the brochure for pricing and purchase details.
Get PDFTable of Content
- Key Takeaways
- Market Size and CAGR
- Top Growth Driver
- Fastest Growing Segment
- Leading Region
- Key Companies
- Emerging Opportunities
- Executive Summary
- Global Market Outlook
- Demand-side Trends
- Supply-side Trends
- Technology Roadmap Analysis
- Analysis and Recommendations
- Analyst Perspective (What is happening? Why now? What should investors know?)
- Key Questions Answered
- How large is the market?
- What is the CAGR?
- What are key trends?
- Which region dominates?
- Who are the leaders?
- Market Overview
- Market Coverage / Taxonomy
- Market Definition / Scope / Limitations
- Research Methodology
- Chapter Orientation
- Analytical Lens and Working Hypotheses
- Market Structure, Signals, and Trend Drivers
- Benchmarking and Cross-market Comparability
- Market Sizing, Forecasting, and Opportunity Mapping
- Research Design and Evidence Framework
- Desk Research Programme (Secondary Evidence)
- Expert Input and Fieldwork (Primary Evidence)
- Tooling, Models, and Reference Databases
- Data Engineering and Model Build
- Quality Assurance and Audit Trail
- Market Background
- Market Dynamics (Drivers, Restraints, Opportunity, Trends)
- Scenario Forecast (Optimistic, Likely, Conservative)
- Impact Analysis
- AI Impact
- Sustainability Impact
- Regulatory Impact
- Technology Impact
- Consumer / Buyer Analysis
- Purchase Drivers
- Adoption Barriers
- Buyer Journey
- Opportunity Map Analysis
- Product Life Cycle Analysis
- Supply Chain Analysis
- Investment Feasibility Matrix
- Value Chain Analysis
- PESTLE and Porter's Analysis
- Regulatory Landscape
- Regional Parent Market Outlook
- Production and Consumption Statistics
- Import and Export Statistics
- Global Market Analysis and Forecast, 2021 to 2036
- Historical Market Size Value (USD Billion) Analysis, 2021 to 2025
- Current and Future Market Size Value (USD Billion) Projections, 2026 to 2036
- Y-o-Y Growth Trend Analysis
- Absolute $ Opportunity Analysis
- Global Market Pricing Analysis, 2021 to 2036
- Global Market Analysis and Forecast, By Component, 2021 to 2036
- Introduction / Key Findings
- Historical Market Size Value (USD Billion) Analysis By Component, 2021 to 2025
- Current and Future Market Size Value (USD Billion) Analysis and Forecast By Component, 2026 to 2036
- Process Mining Software
- Task Mining Software
- Process Intelligence Platforms
- Professional Services
- Y-o-Y Growth Trend Analysis By Component, 2021 to 2025
- Absolute $ Opportunity Analysis By Component, 2026 to 2036
- Global Market Analysis and Forecast, By Deployment, 2021 to 2036
- Introduction / Key Findings
- Historical Market Size Value (USD Billion) Analysis By Deployment, 2021 to 2025
- Current and Future Market Size Value (USD Billion) Analysis and Forecast By Deployment, 2026 to 2036
- Cloud
- On-Premises
- Hybrid
- Managed Service
- Y-o-Y Growth Trend Analysis By Deployment, 2021 to 2025
- Absolute $ Opportunity Analysis By Deployment, 2026 to 2036
- Global Market Analysis and Forecast, By Application, 2021 to 2036
- Introduction / Key Findings
- Historical Market Size Value (USD Billion) Analysis By Application, 2021 to 2025
- Current and Future Market Size Value (USD Billion) Analysis and Forecast By Application, 2026 to 2036
- Process Discovery
- Conformance Checking
- Enhancement & Prediction
- Automation Identification
- Y-o-Y Growth Trend Analysis By Application, 2021 to 2025
- Absolute $ Opportunity Analysis By Application, 2026 to 2036
- Global Market Analysis and Forecast, By End Use, 2021 to 2036
- Introduction / Key Findings
- Historical Market Size Value (USD Billion) Analysis By End Use, 2021 to 2025
- Current and Future Market Size Value (USD Billion) Analysis and Forecast By End Use, 2026 to 2036
- BFSI
- Manufacturing
- Healthcare
- Public Sector
- Y-o-Y Growth Trend Analysis By End Use, 2021 to 2025
- Absolute $ Opportunity Analysis By End Use, 2026 to 2036
- Global Market Analysis and Forecast, By Region, 2021 to 2036
- Introduction
- Historical Market Size Value (USD Billion) Analysis By Region, 2021 to 2025
- Current Market Size Value (USD Billion) Analysis and Forecast By Region, 2026 to 2036
- North America
- Latin America
- Western Europe
- Eastern Europe
- East Asia
- South Asia and Pacific
- Middle East and Africa
- Market Attractiveness Analysis By Region
- North America Market Analysis and Forecast, By Country, 2021 to 2036
- Historical Market Size Value (USD Billion) Trend Analysis By Market Taxonomy, 2021 to 2025
- Market Size Value (USD Billion) Forecast By Market Taxonomy, 2026 to 2036
- By Country
- United States
- Canada
- By Component
- By Deployment
- By Application
- By End Use
- By Country
- Market Attractiveness Analysis
- By Country
- By Component
- By Deployment
- By Application
- By End Use
- Key Takeaways
- Latin America Market Analysis and Forecast, By Country
- Historical Market Size Value (USD Billion) Trend Analysis By Market Taxonomy, 2021 to 2025
- Market Size Value (USD Billion) Forecast By Market Taxonomy, 2026 to 2036
- By Country
- Brazil
- Mexico
- Argentina
- Chile
- By Component
- By Deployment
- By Application
- By End Use
- By Country
- Market Attractiveness Analysis
- By Country
- By Component
- By Deployment
- By Application
- By End Use
- Key Takeaways
- Western Europe Market Analysis and Forecast, By Country
- Historical Market Size Value (USD Billion) Trend Analysis By Market Taxonomy, 2021 to 2025
- Market Size Value (USD Billion) Forecast By Market Taxonomy, 2026 to 2036
- By Country
- Germany
- France
- United Kingdom
- Italy
- Spain
- Benelux
- Nordics
- By Component
- By Deployment
- By Application
- By End Use
- By Country
- Market Attractiveness Analysis
- By Country
- By Component
- By Deployment
- By Application
- By End Use
- Key Takeaways
- Eastern Europe Market Analysis and Forecast, By Country
- Historical Market Size Value (USD Billion) Trend Analysis By Market Taxonomy, 2021 to 2025
- Market Size Value (USD Billion) Forecast By Market Taxonomy, 2026 to 2036
- By Country
- Poland
- Czech Republic
- Romania
- Hungary
- By Component
- By Deployment
- By Application
- By End Use
- By Country
- Market Attractiveness Analysis
- By Country
- By Component
- By Deployment
- By Application
- By End Use
- Key Takeaways
- East Asia Market Analysis and Forecast, By Country
- Historical Market Size Value (USD Billion) Trend Analysis By Market Taxonomy, 2021 to 2025
- Market Size Value (USD Billion) Forecast By Market Taxonomy, 2026 to 2036
- By Country
- China
- Japan
- South Korea
- By Component
- By Deployment
- By Application
- By End Use
- By Country
- Market Attractiveness Analysis
- By Country
- By Component
- By Deployment
- By Application
- By End Use
- Key Takeaways
- South Asia and Pacific Market Analysis and Forecast, By Country
- Historical Market Size Value (USD Billion) Trend Analysis By Market Taxonomy, 2021 to 2025
- Market Size Value (USD Billion) Forecast By Market Taxonomy, 2026 to 2036
- By Country
- India
- ASEAN
- Australia and New Zealand
- By Component
- By Deployment
- By Application
- By End Use
- By Country
- Market Attractiveness Analysis
- By Country
- By Component
- By Deployment
- By Application
- By End Use
- Key Takeaways
- Middle East and Africa Market Analysis and Forecast, By Country
- Historical Market Size Value (USD Billion) Trend Analysis By Market Taxonomy, 2021 to 2025
- Market Size Value (USD Billion) Forecast By Market Taxonomy, 2026 to 2036
- By Country
- GCC Countries
- South Africa
- Türkiye
- Israel
- By Component
- By Deployment
- By Application
- By End Use
- By Country
- Market Attractiveness Analysis
- By Country
- By Component
- By Deployment
- By Application
- By End Use
- Key Takeaways
- Key Countries Market Analysis
- United States
- Pricing Analysis
- Market Share Analysis, 2025
- By Component
- By Deployment
- By Application
- By End Use
- Canada
- Pricing Analysis
- Market Share Analysis, 2025
- By Component
- By Deployment
- By Application
- By End Use
- Mexico
- Pricing Analysis
- Market Share Analysis, 2025
- By Component
- By Deployment
- By Application
- By End Use
- Brazil
- Pricing Analysis
- Market Share Analysis, 2025
- By Component
- By Deployment
- By Application
- By End Use
- Chile
- Pricing Analysis
- Market Share Analysis, 2025
- By Component
- By Deployment
- By Application
- By End Use
- Germany
- Pricing Analysis
- Market Share Analysis, 2025
- By Component
- By Deployment
- By Application
- By End Use
- United Kingdom
- Pricing Analysis
- Market Share Analysis, 2025
- By Component
- By Deployment
- By Application
- By End Use
- Italy
- Pricing Analysis
- Market Share Analysis, 2025
- By Component
- By Deployment
- By Application
- By End Use
- Spain
- Pricing Analysis
- Market Share Analysis, 2025
- By Component
- By Deployment
- By Application
- By End Use
- France
- Pricing Analysis
- Market Share Analysis, 2025
- By Component
- By Deployment
- By Application
- By End Use
- India
- Pricing Analysis
- Market Share Analysis, 2025
- By Component
- By Deployment
- By Application
- By End Use
- ASEAN
- Pricing Analysis
- Market Share Analysis, 2025
- By Component
- By Deployment
- By Application
- By End Use
- Australia and New Zealand
- Pricing Analysis
- Market Share Analysis, 2025
- By Component
- By Deployment
- By Application
- By End Use
- China
- Pricing Analysis
- Market Share Analysis, 2025
- By Component
- By Deployment
- By Application
- By End Use
- Japan
- Pricing Analysis
- Market Share Analysis, 2025
- By Component
- By Deployment
- By Application
- By End Use
- South Korea
- Pricing Analysis
- Market Share Analysis, 2025
- By Component
- By Deployment
- By Application
- By End Use
- Poland
- Pricing Analysis
- Market Share Analysis, 2025
- By Component
- By Deployment
- By Application
- By End Use
- Hungary
- Pricing Analysis
- Market Share Analysis, 2025
- By Component
- By Deployment
- By Application
- By End Use
- Türkiye
- Pricing Analysis
- Market Share Analysis, 2025
- By Component
- By Deployment
- By Application
- By End Use
- South Africa
- Pricing Analysis
- Market Share Analysis, 2025
- By Component
- By Deployment
- By Application
- By End Use
- Australia
- Pricing Analysis
- Market Share Analysis, 2025
- By Component
- By Deployment
- By Application
- By End Use
- United States
- Market Structure Analysis
- Competition Dashboard
- Competition Benchmarking
- Market Share Analysis of Top Players
- By Regional
- By Component
- By Deployment
- By Application
- By End Use
- Emerging Startups
- Innovation Benchmarking
- Competition Analysis
- Competition Deep Dive
- Celonis SE
- Overview
- Product Portfolio
- Profitability by Market Segments
- Sales Footprint
- Strategy Overview
- Marketing Strategy
- Product Strategy
- Channel Strategy
- UiPath Inc.
- SAP SE (Signavio)
- Software AG (ARIS)
- Microsoft Corporation
- ABBYY Solutions Ltd.
- Apromore Pty Ltd
- IBM Corporation
- Celonis SE
- Case Studies
- Success Stories
- Recent Developments
- Competition Deep Dive
- Assumptions & Acronyms Used


