

- Market Size (2026)
- USD 956.0 Mn
- Forecast (2036)
- USD 10853.0 Mn
- CAGR (2026 to 2036)
- 27.5%
How big is Real-Time Grid Stabilization AI Market in 2026?
USD 956.0 million in 2026 and USD 10,853.0 million by 2036 at a 27.5% CAGR.
Demand for real-time grid stabilization AI is projected to rise at 27.5% CAGR from 2026 to 2036. Market value is estimated to increase from USD 956.0 million in 2026 to USD 10,853.0 million by 2036. Wind and solar plants provide less natural balancing support than the conventional turbines that once stabilized grid frequency. Grid operators therefore need tools that detect a disturbance and recommend a safe response within seconds. In February 2026, the International Energy Agency placed current annual grid investment near USD 400 billion. Investment at this level supports demand for utility analytics tools that help networks use existing assets more safely.
Regional priorities vary with network structure and the type of investment already under way. United States programs focus on overloaded transmission routes and rising demand around major load centers. European networks manage power flows across national systems that follow different rules and planning cycles. Japan gives more weight to direct inertia measurement since it shows how strongly each regional grid resists sudden change. In July 2025, Hitachi Energy valued its long-term transformer agreement with E.ON at up to USD 700 million. The contract shows that software now enters the same investment plans as physical grid equipment, including smart grid analytics used to connect live operating signals with planning decisions. Commercial value comes from finding a stability risk sooner and selecting a response that engineers trust.
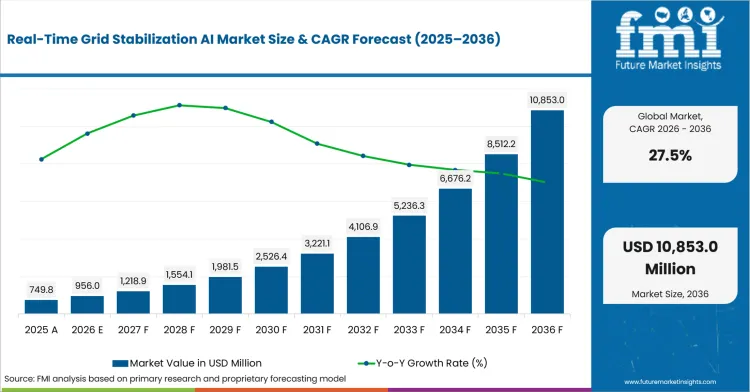
Key Takeaways of Real-Time Grid Stabilization AI Market
- Demand for real-time grid stabilization AI is driven by the need to close the gap between rapidly shifting grid conditions and slower manual reviews, turning live network signals into clear actions for control-room teams.
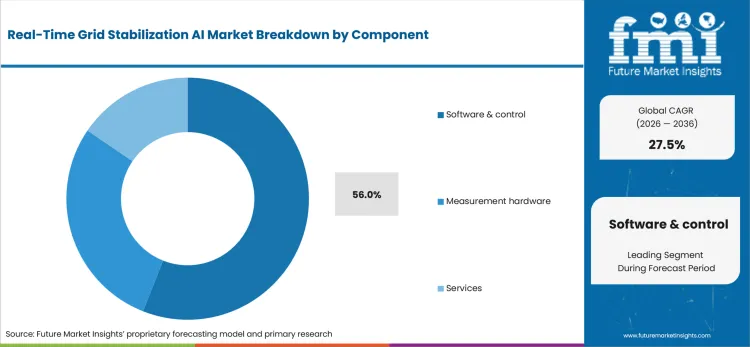
- By component, software and control is expected to lead with 56.0% share in 2026, earning repeat use by combining live measurements with limits that grid operators already understand.
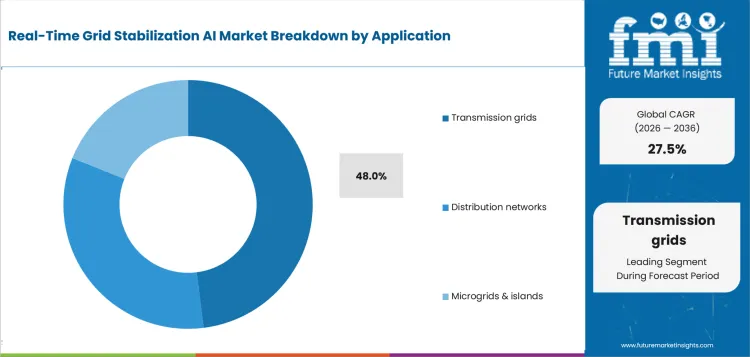
- Transmission grids are the dominant application segment, projected to hold 48.0% share in 2026, reflecting how a single disturbance affects several connected regions and raises commercial priority.
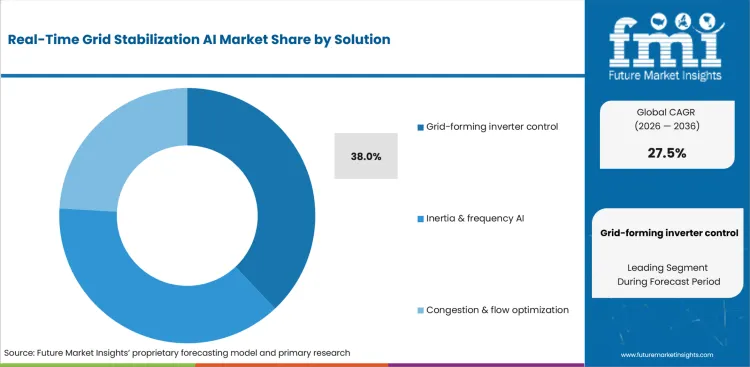
- Grid-forming inverter control is estimated to lead the solution category with 38.0% share in 2026, providing the stable voltage and frequency reference that inverter-heavy power systems often lack during disturbances.
- Reliable performance during both routine operation and severe grid events remains critical to adoption, as clear recommendations make products easier to approve for wider control-room use.
- The United States, Europe, and Japan are expected to follow distinct adoption paths, shaped by transfer capacity needs, cross-border data models, and inertia-based stability planning respectively.
- Competition centers on GE Vernova, Siemens, Hitachi Energy, and Reactive Technologies, with vendors differentiating through broad software platforms, automation paired with stabilizing equipment, and direct real-time measurement of network inertia and system strength.
Analyst Perspective
"Grid operators measure the value of AI by its ability to support stable network operation during both routine balancing and unexpected system disturbances. Software recommendations must remain transparent, traceable, and aligned with established control practices so engineers can validate actions before execution. Market leadership will favor providers that combine reliable power system intelligence with proven operational performance, allowing utilities to improve grid resilience without introducing unnecessary operational risk."
- Sudip Saha, Principal Analyst at Future Market Insights
Source: FMI's proprietary forecasting model and primary research
How is the Real-Time Grid Stabilization AI Market segmented?
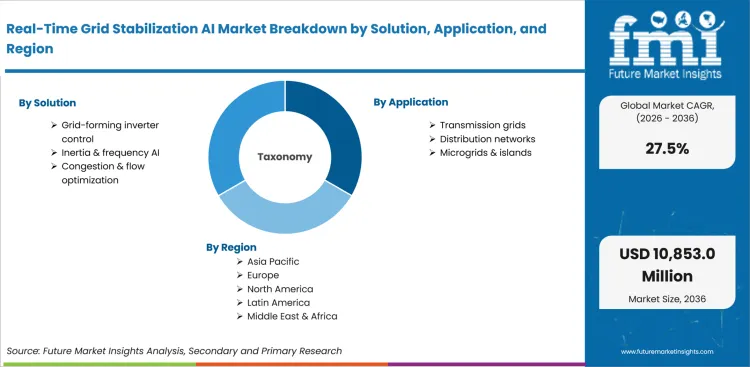
The real-time grid stabilization AI industry is segmented by solution, application, component, end user, business model, and region.
The report examines six parts of the market to show how technical capability becomes commercial demand. Solution covers grid-forming control, inertia and frequency AI, and tools that manage congestion or power flow. Application separates transmission networks from distribution systems and from microgrids serving islands or isolated sites. Component compares software with measurement hardware and technical services used for testing or model tuning.
End-user analysis covers network operators, independent power producers, storage companies, and other owners of flexible assets. Business models include enterprise licenses, SaaS subscriptions, and contracts that tie payment to measured operating results. Regional differences also shape how engineering analytics support planning and testing across different power systems. Together these categories reveal which function creates value, who pays for it, and why approval requirements vary by market.
How does grid-forming inverter control shape demand within the solution category?
Grid-forming control gives an inverter its own voltage and frequency reference during unstable conditions. The decline in conventional turbine generation increases the commercial value of this stabilizing function for grid operators. In May 2025, Hitachi Energy said its Transpower project would add STATCOM equipment for fast voltage support on New Zealand’s North Island. The project shows that software settings and power equipment must work as one system during weak-grid tests.
- Based on solutions, grid-forming inverter control is expected to hold 38.0% share in 2026. The share reflects demand for controls that support voltage and frequency without a conventional turbine. In November 2025, Reactive Technologies announced a South Korean partnership with Korea Grid Forming Co., Ltd. Together the partners match direct network measurement with grid-forming control, helping engineers tune each response to the grid’s actual condition.
- Rising inverter capacity is expected to increase demand for grid-forming controls among storage companies and renewable developers. Engineering teams test tuning support and fault response under weak-grid conditions during formal approval reviews. The results show whether the control stabilizes the network without creating a new risk. Shifts in PV inverter design draw a clearer line between basic power conversion and products designed to support the wider grid.
What supports demand for transmission grids within the application category?
Transmission operators face wide service risks if a local disturbance spreads into connected regions. In March 2025, Siemens and Reactive Technologies linked PSS®E planning software with direct inertia measurements. The combined view gives engineers a clearer picture of live network conditions during planning studies. The integrated evidence narrows the gap between a planning model and the grid that model represents.
- In 2026, transmission grids are forecast to represent 48.0% share of application revenue. The projected share reflects the cost of a disturbance that affects an entire region. In March 2025, Siemens said DB Energie would modernize its transmission control with Spectrum Power 7 and Gridscale X. The project reflects demand for one operating view covering voltage, frequency and power flow.
- Renewable output is expected to increase spending on wide-area control by changing power flows across established corridors. Engineering teams test model accuracy and override rules during formal approval for live-system use by operators. Control-room staff must retain final authority over system actions during routine operations and severe grid emergencies. Expanding utility on-grid PV inverter deployments add more inverter behavior to transmission studies, which raises the value of accurate stability models.
What makes software and control central to the component category?
Software creates value by turning sensor readings into a practical response during a grid disturbance. In June 2025, GE Vernova released two papers on AI use in grid planning and operations. The papers covered fault detection, risk prediction, and guided actions that support control-room staff during urgent decisions. The practical value comes from fewer distracting alerts and clearer reasons behind every recommended action. Software earns trust when control-room staff judge operational risk under severe time pressure.
- The software and control segment is projected to hold 56.0% share of component revenue in 2026. The projected share reflects software’s central role in detecting instability and guiding an effective response. In November 2025, Siemens introduced Gridscale X Flexibility Manager to forecast congestion and activate flexible resources. The launch shows a shift from passive dashboards toward tools that help staff act early enough to avoid a network limit breach.
- Grid operators are expected to favor software that combines stability models with live network data. Utility teams can draw on cloud analytics practices for data access and storage, but utility safety rules remain the final guide for live control.
What are the drivers, restraints, and opportunities in the Real-Time Grid Stabilization AI Market?
Faster changes in grid frequency and voltage are expected to increase demand for real-time stability tools. Strict testing requirements are expected to slow approval across networks with different protection rules. Clear explanations are projected to widen commercial use by helping staff trust each recommended action.
- Driver: Faster changes in frequency and voltage are expected to increase spending on real-time grid control.
- Restraint: Approval is expected to slow if model inputs or control settings conflict with local protection rules.
- Opportunity: Clear explanations are projected to widen use by showing staff why each action is recommended.
Control rooms now face sharper power-flow changes during brief shifts in wind and solar output. In August 2025, Hitachi Energy completed its acquisition of eks Energy to strengthen power conversion and control for storage systems. The deal reflects demand for equipment that delivers rapid power response with clear software guidance. Wider use depends on consistent behavior during routine operation and during severe network disturbances alike. A successful trial must prove that speed does not weaken safety or staff control.
Differences in protection settings and study methods slow grid approval across separate utility service areas. The USA Department of Energy’s January 2025 interconnection roadmap called for better data sharing and more consistent study methods. The roadmap shows why automated controls need clear data and consistent evidence for live-system approval. Projects slow if technical teams cannot show how a model fits local reliability practices. The same approval problem affects software trials and connected measurement equipment used during live operations. Technical proof must match the operating rules and reliability practices used by the local network.
Utilities want faster decisions without giving software full control during uncertain or dangerous operating conditions. In May 2026, Siemens introduced a Gridscale X release that links shared grid models with AI-assisted transmission planning. The release connects long-term studies with operating tools and brings planning evidence closer to daily decisions. Growth in decentralized inverter deployments adds more operating conditions across local networks and storage projects. Commercial value comes from helping engineers act sooner while keeping final authority in the control room.
Which country CAGRs are profiled in the Real-Time Grid Stabilization AI Market?
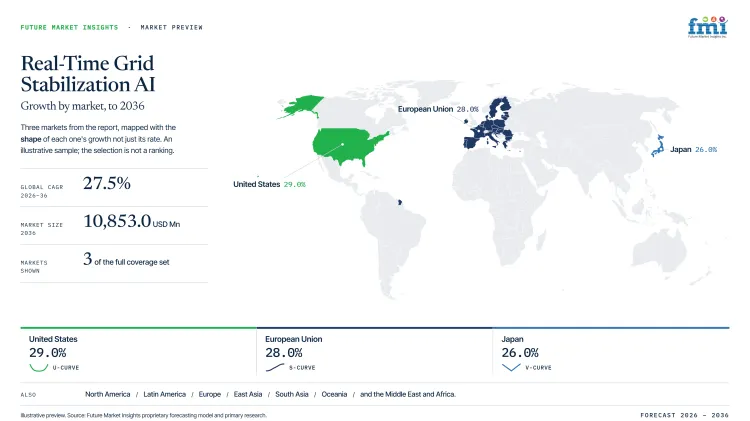
| Country | CAGR |
|---|---|
| United States | 29.0% |
| European Union | 28.0% |
| Japan | 26.0% |
Source: FMI's proprietary forecasting model and primary research
How do country-level CAGRs compare in the Real-Time Grid Stabilization AI Market?
The country comparison spans 3.0 percentage points and indicates a closely grouped growth trajectory across the real-time grid stabilization AI market. The United States leads with a CAGR of 29.0%, followed by the European Union at 28.0% and Japan at 26.0%. The narrow spread suggests that electricity network operators across all three markets are increasing investment in AI-based grid management, although modernization priorities and power system structures differ.
- The United States leads the comparison with a CAGR of 29.0%. Utilities are increasingly incorporating AI into grid stabilization platforms to balance variable renewable generation, improve grid visibility and support faster operational decisions during changing electricity demand and supply conditions.
- The European Union follows at 28.0%, only 1.0 percentage point behind the United States. Market activity reflects continued modernization of transmission and distribution networks, where AI-based forecasting and real-time grid optimization are being evaluated to improve system resilience and accommodate higher shares of renewable energy. Adoption varies across member states because electricity market structures and grid investment priorities are not uniform.
- Japan records a CAGR of 26.0%, standing 2.0 percentage points below the European Union. Power utilities are assessing AI-enabled grid stabilization tools to strengthen network reliability, optimize power flows and improve operational flexibility as distributed energy resources become more integrated into the electricity system.
Comparable CAGRs do not necessarily produce identical commercial opportunities. Differences in grid architecture, renewable energy penetration, utility investment strategies and regulatory frameworks influence AI deployment, implementation timelines and long-term supplier opportunities. The full report provides country-level CAGR analysis across North America, Latin America, Europe, East Asia, South Asia, Oceania and the Middle East and Africa.
Country-wise Analysis
Grid structure and investment schedules create clearly different growth paths across the three profiled markets. United States programs focus on transfer capacity across crowded corridors and areas with rising power demand. European Union operators manage cross-border congestion under shared rules that span several national systems. Japanese utilities place greater value on inertia measurement across networks separated by region and operating frequency. These conditions shape approval timelines, service needs, and support requirements across the full forecast period. Changes in solar inverter deployment show why each power system tests inverter behavior against its own technical limits.
- Federal funding is drawing attention to upgrades that increase transfer capacity on existing routes. Demand in the United States is forecast to expand at 29.0% CAGR by 2036. In March 2026, the USA Department of Energy announced about USD 1.9 billion for critical grid infrastructure. The funding supports technologies that raise capacity and operating efficiency without waiting for entirely new routes. American transmission operators therefore need software that explains each detected risk and fits local protection settings. Public funding helps finance trials, but operating proof remains the final test during real disturbances.
- Cross-border power flows make congestion management a daily issue across the European Union. Regional demand is anticipated to advance at 28.0% CAGR from 2026 to 2036. In June 2025, the International Energy Agency estimated that European Union grid spending would exceed USD 70 billion that year. Investment at this level supports tools that help operators use new assets without creating hidden stability risks. Shared data models help national systems exchange consistent operating information under different grid codes. Commercial success depends on finding a problem early enough to stop congestion from shifting into another operating area.
- Japan’s regional network boundaries increase the value of direct inertia measurement in planning and daily operations. Adoption in Japan is estimated to expand at 26.0% CAGR over forecast period. In May 2026, the OECD placed grid investment needs near USD 50 billion by 2050 under Japan’s national master plan. The figure supports software that helps planners rank new links and use existing assets safely. In September 2025, Hokkaido Electric Power Company began using Reactive Technologies for frequency and inertia measurement. Measured stability data helps guide future power inverter control investment in Japan. Direct measurement gives Japanese utilities a clearer basis for choosing the next control upgrade program.
Who are the notable companies in the Real-Time Grid Stabilization AI Market?
GE Vernova, Siemens, Hitachi Energy, and Reactive Technologies are the notable companies shaping this market.
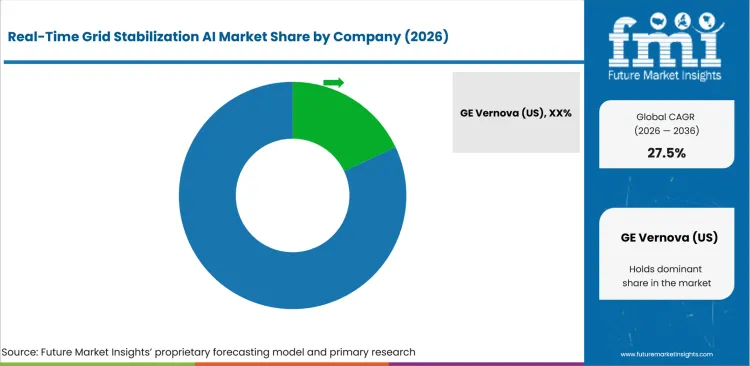
The competitive field includes grid software companies, power-electronics groups, and specialists in live stability measurement. Software companies compete on control-room integration and access to reliable planning or operating data at scale. Power-electronics groups add equipment that supports voltage and frequency during rapid network disturbances in real time. Measurement specialists show how much inertia and system strength are available across the live network. Broader IoT in utilities adoption shapes data, connectivity, and system-integration choices for operators. Practical proof decides which products reach control rooms, and the most valuable offers turn a detected risk into a safe response with fewer steps.
- Key players such as GE Vernova and Siemens are focusing on software that links long-term planning with daily grid operations. GridOS® emphasizes shared data and coordinated applications, while Gridscale X uses common models across planning and operating tools. Both approaches address the same business need: fewer gaps between studies and live decisions.
- Hitachi Energy combines automation software with STATCOM equipment and other power controls used for voltage support. This pairing has practical value in projects that need software guidance and physical response within one upgrade. Its position is clearest in programs that connect engineering studies with equipment behavior during a disturbance.
- Reactive Technologies uses GridMetrix® to measure inertia and system strength across a live network. The service shows how firmly the live grid resists a sudden change in generation or demand. Direct evidence helps engineering teams judge whether automated controls are ready for wider use.
Competitive Benchmarking: Real-Time Grid Stabilization AI Market
| Company | Real-Time Stability Measurement | Grid Operations Software | Grid-Forming and Power Electronics | Service Reach |
|---|---|---|---|---|
| GE Vernova | Medium | High | Medium | Global |
| Siemens | Medium | High | Low | Global |
| Hitachi Energy | Medium | Medium | High | Global |
| Reactive Technologies | High | Medium | Low | Europe, Asia, and the Middle East (Regional) |
Scoring basis: High indicates substantial direct capability in the stated area; Medium indicates relevant but partial capability; Low indicates limited direct evidence.
Source: Future Market Insights competitive analysis, 2026. Ratings reflect official product and project evidence reviewed through July 2026, while service reach reflects documented operating regions and support access.
Key Developments in the Real-Time Grid Stabilization AI Market
- In July 2025, GE Vernova agreed to acquire Alteia SAS and add visual AI to the GridOS® portfolio. Alteia’s computer-vision tools assess storm damage and vegetation risks across long stretches of network assets. The planned integration brings image data and location records into utility operations and restoration planning.
- June 2025, Siemens: AcegasApsAmga selected Gridscale X to create a digital twin of Trieste’s medium-voltage and low-voltage network. The project models congestion and future power needs linked directly to port electrification in Trieste. Operations staff test future power-flow changes early in the planning cycle, giving them time to adjust investment plans. The added time helps the team compare technical options and prepare a practical corrective action.
- In March 2025, Hitachi Energy signed a multi-year collaboration agreement with AWS for cloud-based utility software. The first service combines satellite images with weather data to identify vegetation risks along utility corridors. A shared operating view helps teams manage long service areas and changing weather conditions.
- In December 2025, Reactive Technologies secured a multi-year grid stability measurement contract with National Grid Saudi Arabia through Al-Haitam. GridMetrix® provides real-time views of regional inertia through alerts, heat maps, and other operating displays. The service helps engineers locate low-inertia areas as renewable output changes across the network.
Key Players in the Real-Time Grid Stabilization AI Market
Grid orchestration and control software provider
- GE Vernova
- Siemens
Power-electronics and automation company
- Hitachi Energy
Real-time stability measurement specialist
- Reactive Technologies
Real-Time Grid Stabilization AI Market - Report Scope
| Coverage field | Report scope |
|---|---|
| Market breakdown | Solution, application, component, end user, business model, and region. |
| Quantitative Units | Revenue in USD million, CAGR in %, and segment share in %. |
| Market Definition | AI software, control tools, measurement systems, and services that detect or correct grid stability risks in real time. |
| Regions Covered | North America, Latin America, Europe, East Asia, South Asia, Oceania, and the Middle East and Africa. |
| Countries Covered | United States, Japan, European Union member states, and 20+ additional countries within the regional model. |
| Key Companies Profiled | GE Vernova, Siemens, Hitachi Energy, and Reactive Technologies. |
| Forecast Period | 2026 to 2036. |
| Approach | Hybrid bottom-up and top-down sizing using company evidence, grid investment, operator interviews, and country checks. |
Source: Future Market Insights - analysis driven by proprietary forecasting models and primary research
Real-Time Grid Stabilization AI Market - Research Methodology
| Method | Approach |
|---|---|
| Primary Research |
FMI analysts gathered input from manufacturers, service providers, technology developers, distributors, end users, sourcing teams, and subject-matter experts. Interviews examined purchasing decisions, product or service evaluation, adoption barriers, approval requirements, pricing considerations, and expectations for technical or commercial support. Respondents were also asked what evidence is required before a trial, pilot, or initial order develops into regular purchasing. |
| Desk Research | Desk research covered government statistics, regulatory publications, trade data, industry associations, technical literature, standards, company filings, product information, and official corporate announcements. Sources were reviewed for relevance, publication date, geographic coverage, and consistency with the defined market scope. Claims relating to performance, applications, approvals, capacity, investment, and commercial activity were retained only when supported by credible public evidence. |
| Market Sizing and Forecasting | The market model combined the baseline value with historical performance, segment structure, pricing and volume indicators, adoption levels, company participation, and country-level demand conditions. Forecast assumptions considered economic activity, investment trends, regulatory developments, technology adoption, purchasing cycles, supply availability, and barriers to wider market use. Segment and regional estimates were reconciled before the final market total was calculated. |
| Data Validation | Estimates were checked against multiple independent indicators, including public data, company activity, trade patterns, industry developments, and findings from primary interviews. Validation also tested whether products, services, applications, and company revenues fell within the defined market boundaries. Adjacent categories, unsupported claims, overlapping revenues, and activities without direct market relevance were excluded to reduce double counting and maintain consistency across segments and countries. |
Source: Future Market Insights (FMI) analysis, based on proprietary forecasting model and primary research
Real-Time Grid Stabilization AI Market by Segments
Real-Time Grid Stabilization AI Market segmented by Solution:
- Grid-forming inverter control
- Inertia and frequency AI
- Congestion and flow optimization
Real-Time Grid Stabilization AI Market segmented by Application:
- Transmission grids
- Distribution networks
- Microgrids and islands
Real-Time Grid Stabilization AI Market segmented by Component:
- Software and control
- Measurement hardware
- Services
Real-Time Grid Stabilization AI Market segmented by End User:
- Transmission system operators
- Distribution system operators
- Independent power producers and storage operators
Real-Time Grid Stabilization AI Market segmented by Business Model:
- Enterprise licenses
- SaaS subscriptions
- Performance-based contracts
Real-Time Grid Stabilization AI Market by Region:
- North America
- United States
- Canada
- Latin America
- Brazil
- Mexico
- Argentina
- Europe
- Germany
- United Kingdom
- France
- Italy
- Spain
- East Asia
- China
- Japan
- South Korea
- South Asia
- India
- Thailand
- Indonesia
- Oceania
- Australia
- New Zealand
- Middle East and Africa
- GCC countries
- South Africa
- Turkey
Research Sources and Bibliography
- International Energy Agency. (2026, February 6). Grids. International Energy Agency.
- USA Department of Energy. (2026, March 12). Energy Department Announces $1.9B Investment in Critical Grid Infrastructure to Reduce Electricity Costs. USA Department of Energy.
- International Energy Agency. (2025, June 5). European Union. International Energy Agency.
- Organisation for Economic Co-operation and Development. (2026, May 13). OECD Economic Surveys: Japan 2026. OECD Publishing.
- USA Department of Energy. (2025, January 16). Distributed Energy Resource Interconnection Roadmap: Transforming Interconnection by 2035. USA Department of Energy.
- GE Vernova. (2025, June 10). GE Vernova whitepapers offer pragmatic approach on AI for more intelligent energy grids. GE Vernova.
- GE Vernova. (2025, July 21). GE Vernova to acquire Alteia, advancing AI-enabled GridOS® Visual Intelligence software. GE Vernova.
- Siemens. (2025, March 20). Reactive Technologies improves grid stability monitoring precision with Siemens software. Siemens.
- Siemens. (2025, March 27). Siemens supplies DB Energie with software to modernize their transmission grid operations. Siemens.
- Siemens. (2025, June 16). AcegasApsAmga leverages Siemens’ Gridscale X to build digital twin of Trieste’s energy grid. Siemens.
- Siemens. (2025, November 20). Siemens unveils flexibility software to increase electricity grid capacity, moving towards autonomous grid management. Siemens.
- Siemens. (2026, May 5). Siemens’ Gridscale X redefines system operations and agentic transmission planning. Siemens.
- Hitachi Energy. (2025, March 25). Hitachi Energy and AWS strategic collaboration accelerates innovation in the cloud and advances the energy transition. Hitachi Energy.
- Hitachi Energy. (2025, May 20). Hitachi Energy and Transpower strengthen grid for New Zealand’s sustainable energy future. Hitachi Energy.
- Hitachi Energy. (2025, July 28). Hitachi Energy and E.ON sign deal worth up to $700 million USD for critical grid infrastructure to bolster energy security and resilience in Germany. Hitachi Energy.
- Hitachi Energy. (2025, August 28). Hitachi Energy acquires remaining stake of eks Energy, reinforcing leadership in power conversion systems for energy storage. Hitachi Energy.
- Reactive Technologies. (2025, September 11). HEPCO and Reactive Technologies collaborate to enhance grid stability as Japan transitions to carbon neutrality by 2050. Reactive Technologies.
- Reactive Technologies. (2025, November 24). Reactive Technologies and Korea Grid Forming Co., Ltd partner to support grid stability and net zero goals in South Korea. Reactive Technologies.
- Reactive Technologies. (2025, December 23). Reactive Technologies and Al-Haitam awarded grid stability contract by National Grid Saudi Arabia. Reactive Technologies.
This bibliography is provided for reader reference and uses primary government, international organization, and official company sources.
This Report Answers
- What are the estimated market values for 2026 and 2036?
- What CAGR is projected from 2026 to 2036?
- Which solution and application segments are expected to shape demand?
- Which grid conditions are projected to support real-time control investment?
- How do growth rates differ across the United States, European Union, and Japan?
- How do notable companies compete across measurement, software, and power electronics?
- How does FMI validate market size and country forecasts?
- What issues should utilities resolve during wider adoption or long-term contracts?
- How do protection rules and technical evidence affect the choice of a technology provider?
Frequently Asked Questions
What is driving growth in the Real-Time Grid Stabilization AI Market?
Renewable generation changes frequency and voltage faster than manual operating processes respond during stressed conditions. Grid operators therefore need tools that turn live measurements into clear actions within established control rules.
Who are the key players in the Real-Time Grid Stabilization AI Market?
GE Vernova and Siemens compete through software that connects network planning with daily operations. Hitachi Energy adds power-electronics depth and Reactive Technologies provides direct measurement of live stability conditions.
What is a notable restraint in the Real-Time Grid Stabilization AI Market?
Utility approval slows if model inputs or inverter settings conflict with local protection rules and control authority. Technology providers must prove safe behavior during stressed conditions to earn wider operating access.
Why should executives track the Real-Time Grid Stabilization AI Market?
Grid instability creates financial and service risks that spread beyond one asset or operating area. Earlier visibility helps executives direct capital toward controls that protect existing network capacity and service reliability.
What business problem does the Real-Time Grid Stabilization AI Market address?
The market addresses the shrinking time available to detect and correct disturbances across inverter-heavy power systems. Its tools help control-room staff maintain frequency and voltage during fast changes in power flow.
What should utility teams check when choosing a technology provider?
Utility teams should test data access and response speed under stressed network conditions during formal approval. They should confirm local engineering support and clear override rules for routine or emergency use.
What factors reduce the return on investment for grid companies?
Poor data quality and weak system links reduce the value of capable software during complex grid events. Returns decline further if alerts arrive without clear ownership of the next corrective action during an emergency.
How do technology companies earn long-term trust?
Technology providers build trust by delivering repeatable results in normal operation and stressed network tests. Clear explanations and dependable local support turn successful trials into wider operating use across the network.
Preview the report firsthand - request a free sample
Get SampleGet the brochure for pricing and purchase details.
Get PDFTable of Content
- Key Takeaways
- Market Size and CAGR
- Top Growth Driver
- Fastest Growing Segment
- Leading Region
- Key Companies
- Emerging Opportunities
- Executive Summary
- Global Market Outlook
- Demand-side Trends
- Supply-side Trends
- Technology Roadmap Analysis
- Analysis and Recommendations
- Analyst Perspective (What is happening? Why now? What should investors know?)
- Key Questions Answered
- How large is the market?
- What is the CAGR?
- What are key trends?
- Which region dominates?
- Who are the leaders?
- Market Overview
- Market Coverage / Taxonomy
- Market Definition / Scope / Limitations
- Research Methodology
- Chapter Orientation
- Analytical Lens and Working Hypotheses
- Market Structure, Signals, and Trend Drivers
- Benchmarking and Cross-market Comparability
- Market Sizing, Forecasting, and Opportunity Mapping
- Research Design and Evidence Framework
- Desk Research Programme (Secondary Evidence)
- Expert Input and Fieldwork (Primary Evidence)
- Tooling, Models, and Reference Databases
- Data Engineering and Model Build
- Quality Assurance and Audit Trail
- Market Background
- Market Dynamics (Drivers, Restraints, Opportunity, Trends)
- Scenario Forecast (Optimistic, Likely, Conservative)
- Impact Analysis
- AI Impact
- Sustainability Impact
- Regulatory Impact
- Technology Impact
- Consumer / Buyer Analysis
- Purchase Drivers
- Adoption Barriers
- Buyer Journey
- Opportunity Map Analysis
- Product Life Cycle Analysis
- Supply Chain Analysis
- Investment Feasibility Matrix
- Value Chain Analysis
- PESTLE and Porter's Analysis
- Regulatory Landscape
- Regional Parent Market Outlook
- Production and Consumption Statistics
- Import and Export Statistics
- Global Market Analysis and Forecast, 2021 to 2036
- Historical Market Size Value (USD Million) Analysis, 2021 to 2025
- Current and Future Market Size Value (USD Million) Projections, 2026 to 2036
- Y-o-Y Growth Trend Analysis
- Absolute $ Opportunity Analysis
- Global Market Pricing Analysis, 2021 to 2036
- Global Market Analysis and Forecast, By Solution, 2021 to 2036
- Introduction / Key Findings
- Historical Market Size Value (USD Million) Analysis By Solution, 2021 to 2025
- Current and Future Market Size Value (USD Million) Analysis and Forecast By Solution, 2026 to 2036
- Grid-forming inverter control
- Inertia & frequency AI
- Congestion & flow optimization
- Grid-forming inverter control
- Y-o-Y Growth Trend Analysis By Solution, 2021 to 2025
- Absolute $ Opportunity Analysis By Solution, 2026 to 2036
- Global Market Analysis and Forecast, By Application, 2021 to 2036
- Introduction / Key Findings
- Historical Market Size Value (USD Million) Analysis By Application, 2021 to 2025
- Current and Future Market Size Value (USD Million) Analysis and Forecast By Application, 2026 to 2036
- Transmission grids
- Distribution networks
- Microgrids & islands
- Transmission grids
- Y-o-Y Growth Trend Analysis By Application, 2021 to 2025
- Absolute $ Opportunity Analysis By Application, 2026 to 2036
- Global Market Analysis and Forecast, By Component, 2021 to 2036
- Introduction / Key Findings
- Historical Market Size Value (USD Million) Analysis By Component, 2021 to 2025
- Current and Future Market Size Value (USD Million) Analysis and Forecast By Component, 2026 to 2036
- Software & control
- Measurement hardware
- Services
- Software & control
- Y-o-Y Growth Trend Analysis By Component, 2021 to 2025
- Absolute $ Opportunity Analysis By Component, 2026 to 2036
- Global Market Analysis and Forecast, By End User, 2021 to 2036
- Introduction / Key Findings
- Historical Market Size Value (USD Million) Analysis By End User, 2021 to 2025
- Current and Future Market Size Value (USD Million) Analysis and Forecast By End User, 2026 to 2036
- TSOs
- DSOs
- IPPs & storage operators
- TSOs
- Y-o-Y Growth Trend Analysis By End User, 2021 to 2025
- Absolute $ Opportunity Analysis By End User, 2026 to 2036
- Global Market Analysis and Forecast, By Business Model, 2021 to 2036
- Introduction / Key Findings
- Historical Market Size Value (USD Million) Analysis By Business Model, 2021 to 2025
- Current and Future Market Size Value (USD Million) Analysis and Forecast By Business Model, 2026 to 2036
- Enterprise licences
- SaaS
- Performance contracts
- Enterprise licences
- Y-o-Y Growth Trend Analysis By Business Model, 2021 to 2025
- Absolute $ Opportunity Analysis By Business Model, 2026 to 2036
- Global Market Analysis and Forecast, By Region, 2021 to 2036
- Introduction
- Historical Market Size Value (USD Million) Analysis By Region, 2021 to 2025
- Current Market Size Value (USD Million) Analysis and Forecast By Region, 2026 to 2036
- North America
- Latin America
- Western Europe
- Eastern Europe
- East Asia
- South Asia and Pacific
- Middle East & Africa
- Market Attractiveness Analysis By Region
- North America Market Analysis and Forecast, By Country, 2021 to 2036
- Historical Market Size Value (USD Million) Trend Analysis By Market Taxonomy, 2021 to 2025
- Market Size Value (USD Million) Forecast By Market Taxonomy, 2026 to 2036
- By Country
- USA
- Canada
- By Solution
- By Application
- By Component
- By End User
- By Business Model
- By Country
- Market Attractiveness Analysis
- By Country
- By Solution
- By Application
- By Component
- By End User
- By Business Model
- Key Takeaways
- Latin America Market Analysis and Forecast, By Country
- Historical Market Size Value (USD Million) Trend Analysis By Market Taxonomy, 2021 to 2025
- Market Size Value (USD Million) Forecast By Market Taxonomy, 2026 to 2036
- By Country
- Brazil
- Mexico
- Chile
- Rest of Latin America
- By Solution
- By Application
- By Component
- By End User
- By Business Model
- By Country
- Market Attractiveness Analysis
- By Country
- By Solution
- By Application
- By Component
- By End User
- By Business Model
- Key Takeaways
- Western Europe Market Analysis and Forecast, By Country
- Historical Market Size Value (USD Million) Trend Analysis By Market Taxonomy, 2021 to 2025
- Market Size Value (USD Million) Forecast By Market Taxonomy, 2026 to 2036
- By Country
- Germany
- UK
- Italy
- Spain
- France
- Nordic
- BENELUX
- Rest of Western Europe
- By Solution
- By Application
- By Component
- By End User
- By Business Model
- By Country
- Market Attractiveness Analysis
- By Country
- By Solution
- By Application
- By Component
- By End User
- By Business Model
- Key Takeaways
- Eastern Europe Market Analysis and Forecast, By Country
- Historical Market Size Value (USD Million) Trend Analysis By Market Taxonomy, 2021 to 2025
- Market Size Value (USD Million) Forecast By Market Taxonomy, 2026 to 2036
- By Country
- Russia
- Poland
- Hungary
- Balkan & Baltic
- Rest of Eastern Europe
- By Solution
- By Application
- By Component
- By End User
- By Business Model
- By Country
- Market Attractiveness Analysis
- By Country
- By Solution
- By Application
- By Component
- By End User
- By Business Model
- Key Takeaways
- East Asia Market Analysis and Forecast, By Country
- Historical Market Size Value (USD Million) Trend Analysis By Market Taxonomy, 2021 to 2025
- Market Size Value (USD Million) Forecast By Market Taxonomy, 2026 to 2036
- By Country
- China
- Japan
- South Korea
- By Solution
- By Application
- By Component
- By End User
- By Business Model
- By Country
- Market Attractiveness Analysis
- By Country
- By Solution
- By Application
- By Component
- By End User
- By Business Model
- Key Takeaways
- South Asia and Pacific Market Analysis and Forecast, By Country
- Historical Market Size Value (USD Million) Trend Analysis By Market Taxonomy, 2021 to 2025
- Market Size Value (USD Million) Forecast By Market Taxonomy, 2026 to 2036
- By Country
- India
- ASEAN
- Australia & New Zealand
- Rest of South Asia and Pacific
- By Solution
- By Application
- By Component
- By End User
- By Business Model
- By Country
- Market Attractiveness Analysis
- By Country
- By Solution
- By Application
- By Component
- By End User
- By Business Model
- Key Takeaways
- Middle East & Africa Market Analysis and Forecast, By Country
- Historical Market Size Value (USD Million) Trend Analysis By Market Taxonomy, 2021 to 2025
- Market Size Value (USD Million) Forecast By Market Taxonomy, 2026 to 2036
- By Country
- Kingdom of Saudi Arabia
- Other GCC Countries
- Türkiye
- South Africa
- Other African Union
- Rest of Middle East & Africa
- By Solution
- By Application
- By Component
- By End User
- By Business Model
- By Country
- Market Attractiveness Analysis
- By Country
- By Solution
- By Application
- By Component
- By End User
- By Business Model
- Key Takeaways
- Key Countries Market Analysis
- USA
- Pricing Analysis
- Market Share Analysis, 2025
- By Solution
- By Application
- By Component
- By End User
- By Business Model
- Canada
- Pricing Analysis
- Market Share Analysis, 2025
- By Solution
- By Application
- By Component
- By End User
- By Business Model
- Mexico
- Pricing Analysis
- Market Share Analysis, 2025
- By Solution
- By Application
- By Component
- By End User
- By Business Model
- Brazil
- Pricing Analysis
- Market Share Analysis, 2025
- By Solution
- By Application
- By Component
- By End User
- By Business Model
- Chile
- Pricing Analysis
- Market Share Analysis, 2025
- By Solution
- By Application
- By Component
- By End User
- By Business Model
- Germany
- Pricing Analysis
- Market Share Analysis, 2025
- By Solution
- By Application
- By Component
- By End User
- By Business Model
- UK
- Pricing Analysis
- Market Share Analysis, 2025
- By Solution
- By Application
- By Component
- By End User
- By Business Model
- Italy
- Pricing Analysis
- Market Share Analysis, 2025
- By Solution
- By Application
- By Component
- By End User
- By Business Model
- Spain
- Pricing Analysis
- Market Share Analysis, 2025
- By Solution
- By Application
- By Component
- By End User
- By Business Model
- France
- Pricing Analysis
- Market Share Analysis, 2025
- By Solution
- By Application
- By Component
- By End User
- By Business Model
- India
- Pricing Analysis
- Market Share Analysis, 2025
- By Solution
- By Application
- By Component
- By End User
- By Business Model
- ASEAN
- Pricing Analysis
- Market Share Analysis, 2025
- By Solution
- By Application
- By Component
- By End User
- By Business Model
- Australia & New Zealand
- Pricing Analysis
- Market Share Analysis, 2025
- By Solution
- By Application
- By Component
- By End User
- By Business Model
- China
- Pricing Analysis
- Market Share Analysis, 2025
- By Solution
- By Application
- By Component
- By End User
- By Business Model
- Japan
- Pricing Analysis
- Market Share Analysis, 2025
- By Solution
- By Application
- By Component
- By End User
- By Business Model
- South Korea
- Pricing Analysis
- Market Share Analysis, 2025
- By Solution
- By Application
- By Component
- By End User
- By Business Model
- Russia
- Pricing Analysis
- Market Share Analysis, 2025
- By Solution
- By Application
- By Component
- By End User
- By Business Model
- Poland
- Pricing Analysis
- Market Share Analysis, 2025
- By Solution
- By Application
- By Component
- By End User
- By Business Model
- Hungary
- Pricing Analysis
- Market Share Analysis, 2025
- By Solution
- By Application
- By Component
- By End User
- By Business Model
- Kingdom of Saudi Arabia
- Pricing Analysis
- Market Share Analysis, 2025
- By Solution
- By Application
- By Component
- By End User
- By Business Model
- Türkiye
- Pricing Analysis
- Market Share Analysis, 2025
- By Solution
- By Application
- By Component
- By End User
- By Business Model
- South Africa
- Pricing Analysis
- Market Share Analysis, 2025
- By Solution
- By Application
- By Component
- By End User
- By Business Model
- USA
- Market Structure Analysis
- Competition Dashboard
- Competition Benchmarking
- Market Share Analysis of Top Players
- By Regional
- By Solution
- By Application
- By Component
- By End User
- By Business Model
- Emerging Startups
- Innovation Benchmarking
- Competition Analysis
- Competition Deep Dive
- GE Vernova (US)
- Overview
- Product Portfolio
- Profitability by Market Segments
- Sales Footprint
- Strategy Overview
- Marketing Strategy
- Product Strategy
- Channel Strategy
- Siemens Grid Software (DE)
- Hitachi Energy (JP-CH)
- Reactive Technologies (UK-FI)
- GE Vernova (US)
- Case Studies
- Success Stories
- Recent Developments
- Competition Deep Dive
- Assumptions & Acronyms Used


