
- Market Size (2026)
- USD 6.6 Bn
- Forecast (2036)
- USD 12.9 Bn
- CAGR (2026 to 2036)
- 7.0%
How Big Is the Recruitment Process Outsourcing Market in 2026?
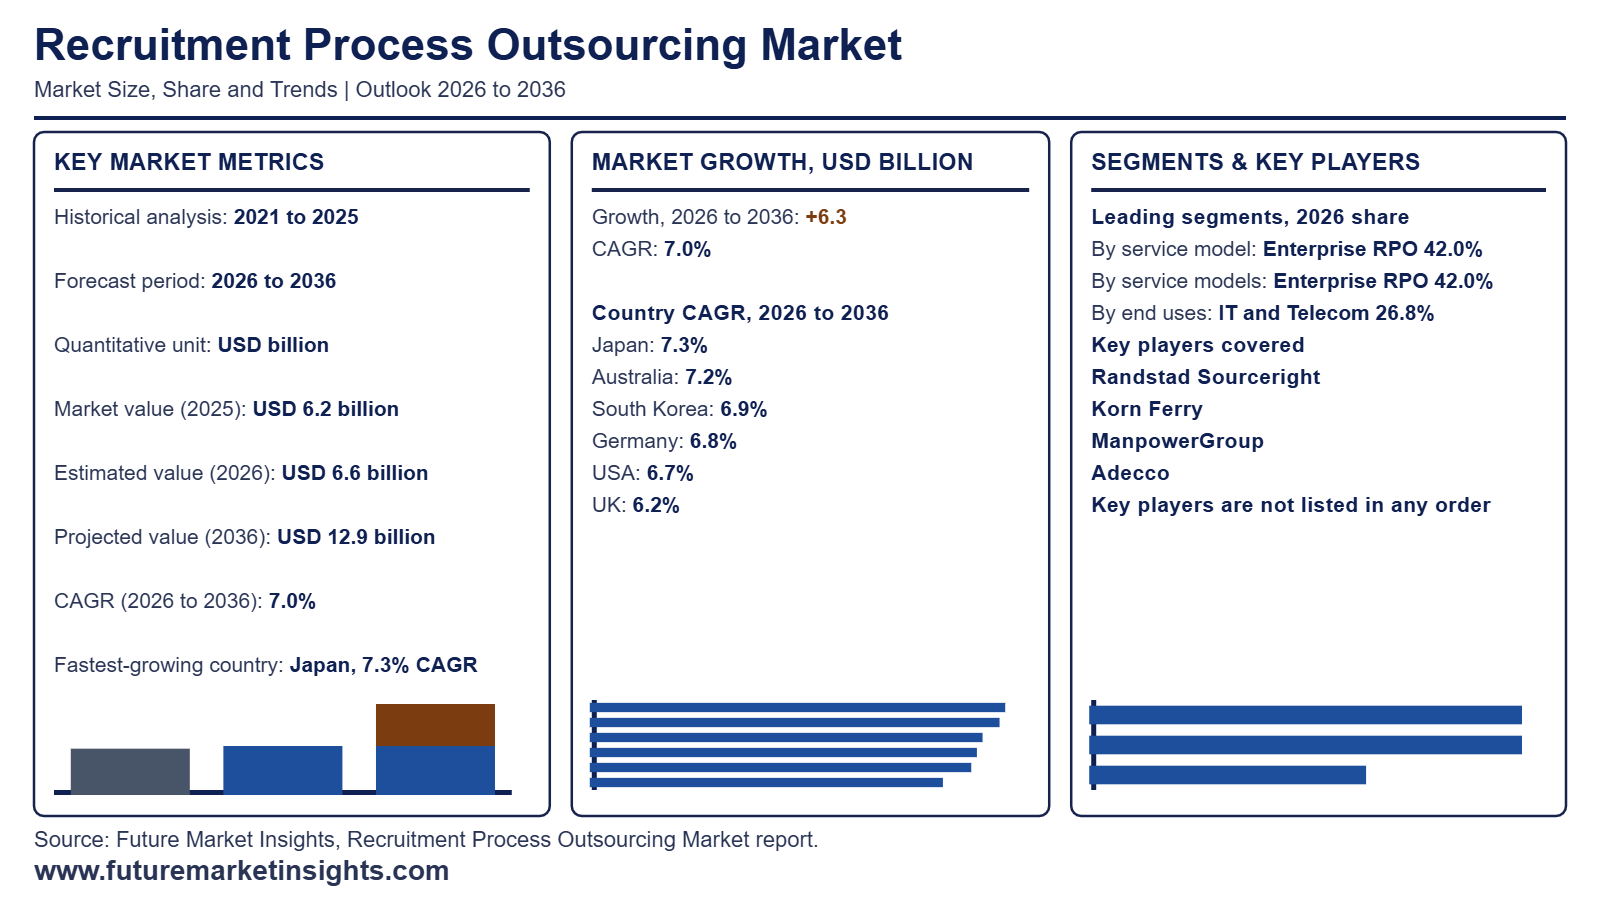
The global recruitment process outsourcing market is valued at USD 6.6 billion in 2026, up from USD 6.2 billion in 2025, and is projected by Future Market Insights (FMI) to reach USD 12.9 billion by 2036, expanding at a 7.0% CAGR over the 2026 to 2036 forecast period.
| Market Metric | Valuation / Share / Forecast Benchmark |
|---|---|
| 2025 Market Size (Historical) | USD 6.2 billion |
| 2026 Market Size (Estimated) | USD 6.6 billion |
| 2036 Market Size (Projected) | USD 12.9 billion |
| Compound Annual Growth Rate (2026 to 2036) | 7.0% CAGR |
| Incremental Dollar Opportunity (2026 to 2036) | USD 6.3 billion |
| Dominant Service Model (2026 to 2036 Share) | Enterprise RPO (42.0% in 2026, rising to 43.1% by 2036) |
| Leading & Fastest-Growing Service Models | Enterprise RPO (42.0% share in 2026; 7.2% CAGR) | Modular and On-Demand RPO (8.4% CAGR) |
| Leading & Fastest-Growing End Uses | IT and Telecom (26.8% share in 2026; 7.2% CAGR) | Healthcare and Life Sciences (8.0% CAGR) |
| Leading & Fastest-Growing Client Sizes | Global Enterprises (40.0% share in 2026; 7.1% CAGR) | Mid-Sized Companies (8.2% CAGR) |
| Largest Country Markets (2026 Global Share) | USA (38.0%), UK (10.0%), Germany (8.0%) |
| Fastest-Growing Country Markets (2026 to 2036) | Japan (7.3% CAGR), Australia (7.2% CAGR), South Korea (6.9% CAGR) |
| Leading Tier-1 Companies | Randstad Sourceright, Korn Ferry, ManpowerGroup, Adecco |
Source: Future Market Insights analysis of the recruitment process outsourcing market, 2026.
Executive Market Overview
Enterprises hand hiring to outside partners because requisition volumes swing with the business cycle and fixed internal recruiting teams are costly to size for every peak. RPO providers run sourcing and screening and onboarding under flexible pricing so clients scale capacity as needs shift. Employers keep reshaping their workforces as 62% of those adding staff cite changing roles and skills while the global Net Employment Outlook stands at 29% (ManpowerGroup 2026). Enterprise RPO holds 42.0% of Service Model revenue with a 7.2% CAGR and Modular and On-Demand RPO advances fastest at 8.4% as buyers favor adjustable capacity. IT and Telecom leads End Use at 26.8% with 7.2% as providers pair recruiter teams with applicant tracking system data.
Hiring volume linkage is the restraint specific to this market since fee income follows requisitions and employers that pace hiring conservatively trim program scope. US employers made 5.4 million hires in September against 7.5 million openings (Bureau of Labor Statistics 2026). UK vacancies of about 690,000 and Australian vacancies of 325,000 reflect a measured hiring pace (Office for National Statistics 2026 and Australian Bureau of Statistics 2026). Healthcare and Life Sciences is the fastest-growing End Use at 8.0% and Global Enterprises hold 40.0% of Client Size at 7.1%. Japan is the fastest-growing country at a 7.3% CAGR ahead of Australia at 7.2% and South Korea at 6.9%. Germany at 6.8% and the USA at 6.7% sit above the UK at 6.2% within HR analytics adoption. Market sizing covers outsourced sourcing and screening and onboarding programs while excluding retained executive search and standalone job boards.
Analyst Perspective
The recruitment process outsourcing market is gaining momentum as employers hand hiring workflows to specialists who apply analytics and automation to fill roles faster. Providers that blend talent data platforms with flexible delivery models will win multiyear enterprise mandates and deepen client relationships.
- Anurag Sharma, Principal Consultant, Future Market Insights.
Major Market Trends and Insights
- AI Delivery Capability Now Decides RPO Contract Awards: Buyers now judge RPO providers by how well technology shortens hiring cycles so platform capability carries as much weight as recruiter bench strength. The RPO Association (June 2026) notes that client demand for AI is running ahead of provider readiness which rewards teams with proven tooling. Korn Ferry reports shortlists in hard to fill countries built up to 30% faster with its RPO technology than traditional methods. Management also said technology adoption runs deeper in RPO than in executive search. Providers that pair automation with skilled recruiters are shaping pricing and service terms across new mandates.
- EU Hiring AI Rules Lift the Compliance Bar for Outsourced Recruiters: Recruiters screen candidates on behalf of employers so the AI tools inside an RPO program now sit under the EU rulebook for high risk systems. Providers with logging and human oversight in place can bid for regulated clients with confidence. The EU AI Act brought transparency duties into effect on 2 August 2026 and sets full high risk employment obligations from 2 December 2027 as summarized by Ogletree (2026). That timeline gives providers a defined window to document tools and train recruiter teams. Compliance readiness is becoming a visible selling point in tenders. Steady Fee Growth Shows RPO Holding Ground at Leading Providers: Multi-year outsourcing contracts give providers a steadier fee base than project hiring and that stability keeps enterprises signing even as hiring volumes vary. Contract length also lets providers invest in sourcing technology and training that single projects could not justify. Randstad (October 2026) reported RPO fees up 4% organically to €84 million from €80 million a year earlier. Korn Ferry recorded RPO fee revenue of USD 87.5 million in its fiscal third quarter ended 31 January 2026 up 3% on new North America clients. Both providers show that scale and client retention carry the segment forward through changing demand.
What Are the Main Drivers, Restraints, and Opportunities?
Large employers hand over hiring volume to RPO partners because skills scarcity and hiring cycles strain internal teams while hiring swings and contract pricing test provider margins and that balance favors modular programs that let mid-sized companies and healthcare clients scale recruiting capacity up or down.
Driver: Enterprise Hiring Complexity Anchors Outsourced Recruitment Programs
Global enterprises outsource hiring because recruiting for scarce skills demands process discipline that internal teams find hard to sustain and that need keeps Enterprise RPO the leading service model with IT and Telecom the leading end use. Randstad (October 2026) reported growth in RPO and said its largest clients keep outpacing the rest of the group. Korn Ferry (September 2026) completed its AMS acquisition to add technology-enabled talent solutions backed by long-term contracts. Randstad Sourceright and Korn Ferry therefore win recurring mandates from buyers in the USA with the UK and Germany close behind and tie them to talent acquisition and staffing technology platforms.
Restraint: Hiring Cycles and Contract Pricing Shape Provider Margins
Recruitment outsourcing fees follow client hiring volume so a pause in requisitions flows straight into provider revenue and labor intensive delivery leaves fixed costs exposed. The Bureau of Labor Statistics (November 2026) reported September job openings and hires little changed while quits increased. ManpowerGroup (October 2026) called the present period an inflection point and said its Experis and Talent Solutions brands saw sequential revenue trend improvement. Pricing therefore rests on expected requisition volume across each contract term. Buyers in contingent staffing solutions programs compare RPO fees against flexible labor options and providers hold margins through scope discipline in each contract.
Opportunity: Modular Programs Reach Mid-Sized and Healthcare Employers
Mid-sized companies and healthcare employers need recruiting capacity that expands and contracts with hiring waves and that is why Modular and On-Demand RPO is the fastest growing service model with Mid-Sized Companies and Healthcare and Life Sciences leading growth within their groups. Adecco (November 2026) reported permanent placement back to growth and Professional Recruitment Solutions up year over year. Randstad (October 2026) noted Japan stepping up its growth and Australia returning to growth. Providers can package project-based hiring with human capital management tools for clients in Japan and Australia and South Korea where growth is fastest.
How Is the Recruitment Process Outsourcing Market Segmented?
Segmentation of the global recruitment process outsourcing market spans service model and end use and client size and role level and region with each axis built as a separate view of buyer behavior and sized to the same market total.
| Segmentation Axis | Sub-Segments Covered | 2026 Leading Segment and Share | Main Growth Benchmark (2026 to 2036) |
|---|---|---|---|
| Service Model | Enterprise RPO / Modular and On-Demand RPO / Project RPO / Contingent Workforce RPO | Enterprise RPO (42.0% revenue share) | Enterprise RPO grows at 6.8% CAGR to a 41.2% share by 2036 |
| End Use | IT and Telecom / Banking and Insurance / Healthcare and Life Sciences / Manufacturing and Industrial / Retail and Consumer Goods | IT and Telecom (26.8% revenue share) | IT and Telecom share rises to 27.6% by 2036 at 7.3% CAGR |
| Client Size | Global Enterprises / Large Enterprises / Mid-Sized Companies / Small Companies | Global Enterprises (40.0% revenue share) | Global Enterprises grows at 6.8% CAGR to a 39.3% share by 2036 |
| Role Level | Professional and Skilled / High-Volume Hourly / Early Talent / Executive and Leadership | Professional and Skilled (48.0% revenue share) | Professional and Skilled share rises to 48.9% by 2036 at 7.2% CAGR |
| Region | North America / Latin America / Western Europe / Eastern Europe / East Asia / South Asia and Pacific / Middle East and Africa | North America (46.0% revenue share) | Japan leads country growth at 7.3% CAGR |
Source. Future Market Insights analysis of the recruitment process outsourcing market 2026.
Why Does Enterprise RPO Lead by Service Model?
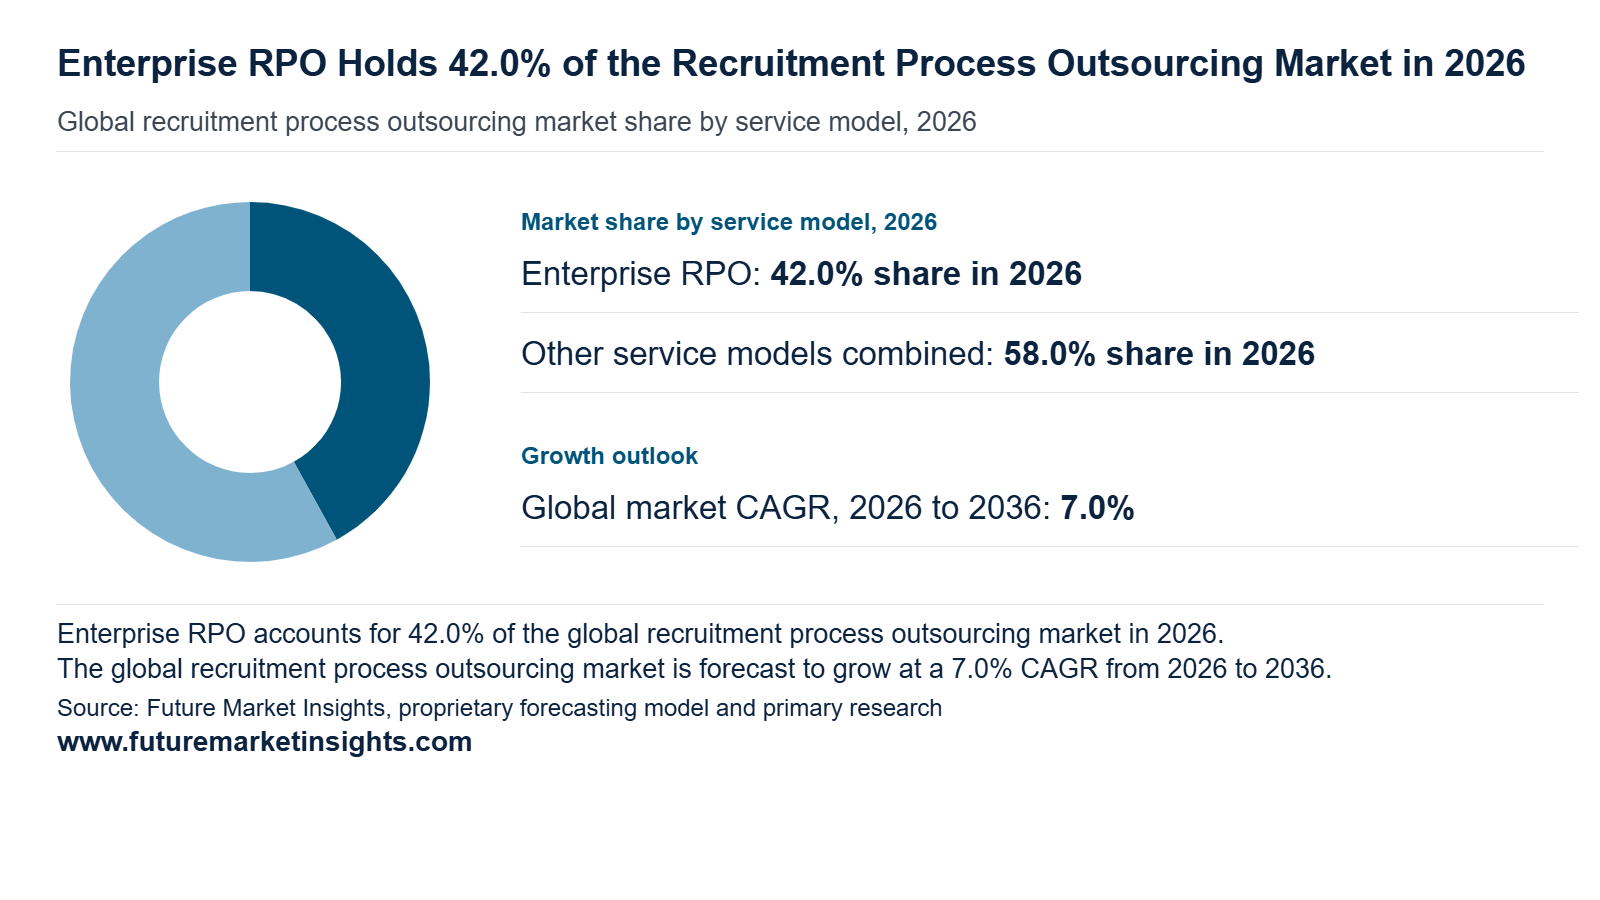
Enterprise RPO leads by service model with a 42.0% share in 2026 and is projected to stand at 41.2% by 2036 while growing at a 6.8% CAGR. Providers such as Randstad Sourceright and Cielo and Alexander Mann Solutions take over the full hiring function from requisition to onboarding under multi-year contracts. Integration with applicant tracking system platforms gives clients one data view across recruiters and hiring managers. Corporate buyers value predictable cost per hire and service level agreements that tie fees to time to fill. Modular and on-demand and project and contingent workforce models serve firms that want narrower scope or seasonal capacity.
Why Does IT and Telecom Lead by End Use?
IT and telecom leads end use with a 26.8% share in 2026 and is likely to reach 27.6% by 2036 at a 7.3% CAGR. Software and cloud and network companies hire engineers and cybersecurity specialists in short windows and compete across India and the United States and Germany for the same in-demand talent. RPO partners such as Korn Ferry and Pontoon supply sourcing teams and employer branding that internal teams scale gradually. Product launches and acquisitions create hiring surges that favor flexible contracts. Banking and insurance and healthcare and life sciences and manufacturing and retail buyers follow with compliance-driven and volume-driven requisitions.
Why Do Global Enterprises Lead by Client Size?
Global enterprises lead client size with a 40.0% share in 2026 and are poised to account for 39.3% by 2036 at a 6.8% CAGR. Multinationals operating across dozens of countries seek a single provider that harmonizes hiring processes and data privacy practices under GDPR and local labor rules. Central talent leaders align recruiting metrics with human capital management systems to compare performance across regions. Providers differentiate through multilingual recruiters and local market intelligence in Asia Pacific and Europe. The EU Pay Transparency Directive adds reporting work that favors experienced partners. Large enterprises and mid-sized companies and small companies buy narrower scopes that fit regional hiring plans.
Why Do Professional and Skilled Roles Lead by Role Level?
Professional and skilled roles lead role level with a 48.0% share in 2026 and are anticipated to move to 48.9% by 2036 at a 7.2% CAGR. Engineers and nurses and accountants and analysts command recruitment fees large enough to justify dedicated RPO sourcing pools and talent communities. Providers build pipelines through technical assessments and passive candidate outreach that improve quality of hire. Employers in the United States and Japan and Australia plan around aging workforces and skills shifts that keep requisitions steady. High-volume hourly and early talent and executive and leadership programs run on separate playbooks with campus events and mass screening and retained search.
Recruitment Process Outsourcing Market by Region and Country (2026 to 2036)
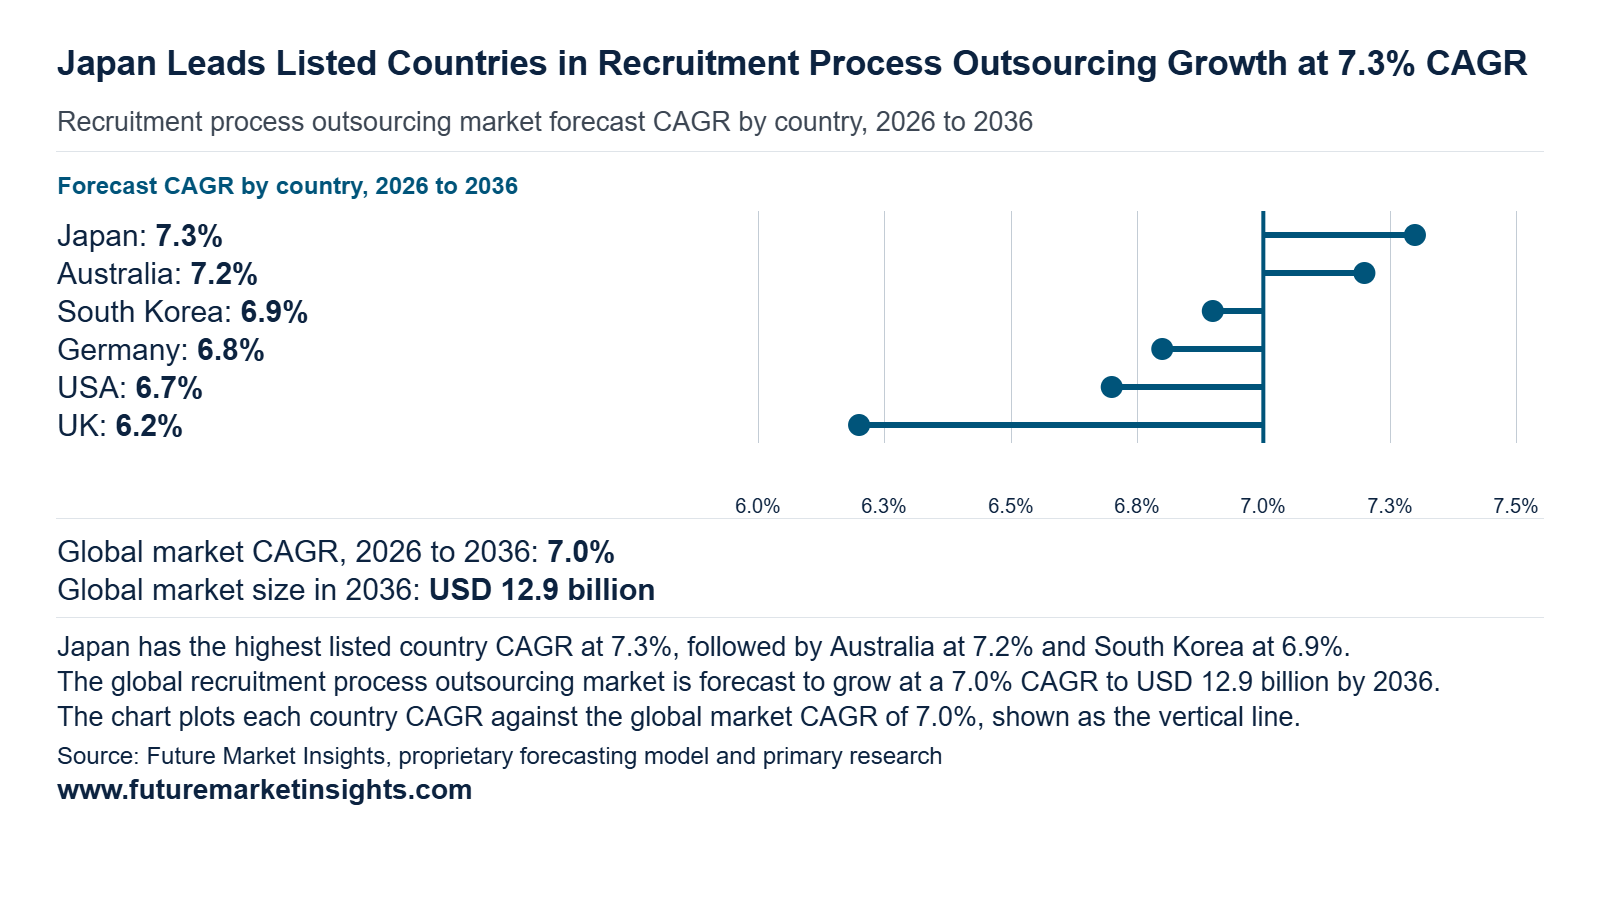
Demand for outsourced hiring is spreading across five regions. North America holds the largest base through the USA. Western Europe adds scale through the UK and Germany. East Asia gains pace through Japan and South Korea. South Asia and Pacific shows strong momentum through Australia. Employers in these countries buy managed hiring programs as vacancy volumes stay high and applicant screening takes more effort. Japan leads on growth, followed closely by Australia and South Korea.
| Country | 2026 Revenue (USD billion) | 2036 Revenue (USD billion) | 10-Year Addition (USD billion) | 2026 to 2036 CAGR | Global Share (2026 → 2036) |
|---|---|---|---|---|---|
| Japan | 0.55 | 1.10 | 0.56 | 7.3% | 6.5% → 6.8% |
| Australia | 0.34 | 0.67 | 0.34 | 7.2% | 4.0% → 4.2% |
| South Korea | 0.21 | 0.41 | 0.20 | 6.9% | 2.5% → 2.5% |
| Germany | 0.50 | 0.97 | 0.47 | 6.8% | 6.0% → 6.0% |
| USA | 3.70 | 7.07 | 3.37 | 6.7% | 44.0% → 43.6% |
| UK | 0.84 | 1.53 | 0.69 | 6.2% | 10.0% → 9.5% |
| Rest of World | 2.27 | 4.46 | 2.19 | 7.0% | 27.0% → 27.5% |
Source: Future Market Insights analysis of the recruitment process outsourcing market, 2026.
Japan
Japan is the fastest-growing country in the recruitment process outsourcing market at a 7.3% CAGR as private employment agencies take over a rising share of hiring. The Cabinet Office (July 2025) explains that perceived labor shortages sit at a historically high level. The job openings-to-applicants ratio stayed flat because postings moved from Hello Work public offices to private employment agencies. The same paper points to a growing mismatch across job types. Large employers in manufacturing and healthcare and retail therefore hand sourcing and screening to outsourced partners that coordinate several agencies inside one process. Demand for these managed programs should widen as the labor force tightens through 2036. Japan holds a 6.5% global share in 2026 and reaches 6.8% by 2036.
Australia
Australia ranks second at a 7.2% CAGR as employers work through a large and varied vacancy base. The Australian Bureau of Statistics (November 2026) reports 325 thousand job vacancies in August 2026 with 286.3 thousand in the private sector and 38.7 thousand in the public sector. Public sector openings rose 7.8% from May 2026 and this gives government departments a reason to tender for managed recruitment programs. Private employers in retail and finance and professional services pair a steady flow of openings with a need for fast and consistent screening. Outsourced teams that run employer branding and candidate screening and onboarding under one contract fit this need. These buyers should keep awarding multi-year programs through 2036 and lift Australia from 4.0% to 4.2% of global revenue.
South Korea
South Korea ranks third at a 6.9% CAGR as employer demand outpaces the inflow of new job seekers. The Ministry of Employment and Labor (July 2026) recorded 183 thousand new job openings on Work24 for June 2026 which is 21.4% above a year earlier. Health and welfare and manufacturing and business services led the gain. Openings per seeker reached 0.48 against 0.39 a year earlier. Employers in these sectors compete for a smaller pool of candidates and look for sourcing partners that reach passive talent beyond public job portals. Recruitment process outsourcing providers that combine active outreach with structured screening should capture this need. Korean buyers are likely to extend pilots into full programs through 2036 while the country holds a steady 2.5% share.
Germany
Germany ranks fourth at a 6.8% CAGR with screening workloads at the center of its hiring picture. The IAB (September 2026) counted about 1 million vacancies in the second quarter of 2026 and found that about 81% were ready to fill immediately. There are 291 unemployed people per 100 vacancies and employers received an average of 16 applications per hire in 2025 against 9 in 2022. A larger applicant volume per role raises the effort required for review and assessment in every HR department. Mittelstand manufacturers and large service employers therefore move screening and interview scheduling to external teams. This keeps recruiter capacity focused on final selection and supports orders through 2036 as Germany holds near 6.0% of global revenue.
USA
The USA anchors the market with a 44.0% global share in 2026 and a 6.7% CAGR that ranks fifth. The Bureau of Labor Statistics (November 2026) reported 7.5 million job openings and 5.4 million hires for September 2026 alongside 3.4 million quits. Professional and business services alone listed 1.31 million openings which is 106 thousand more than in August. High turnover keeps employers recruiting continuously and this suits outsourced programs that scale with demand. Technology and healthcare and logistics employers in large metro areas buy volume hiring and project hiring support from a single partner. Continuous replacement demand should keep contract renewals strong through 2036 and hold the share near 43.6%.
UK
The UK holds the second largest share among the profiled countries at 10.0% in 2026 and posts a 6.2% CAGR as employers rethink recruiting budgets. The Office for National Statistics (November 2026) estimated about 690 thousand vacancies for August to October 2026. Businesses with 1 to 9 employees held 73 thousand of these vacancies and the unemployment rate stood at 4.6% for July to September 2026. Employers facing cautious hiring plans prefer variable cost recruiting over fixed in-house teams. Banks and retailers and public bodies in London and the regions therefore convert agency spend into outsourced programs priced per hire. This shift should secure steady volumes through 2036 and keep the UK near 9.5% of global revenue.
Competitive Environment and Notable Companies
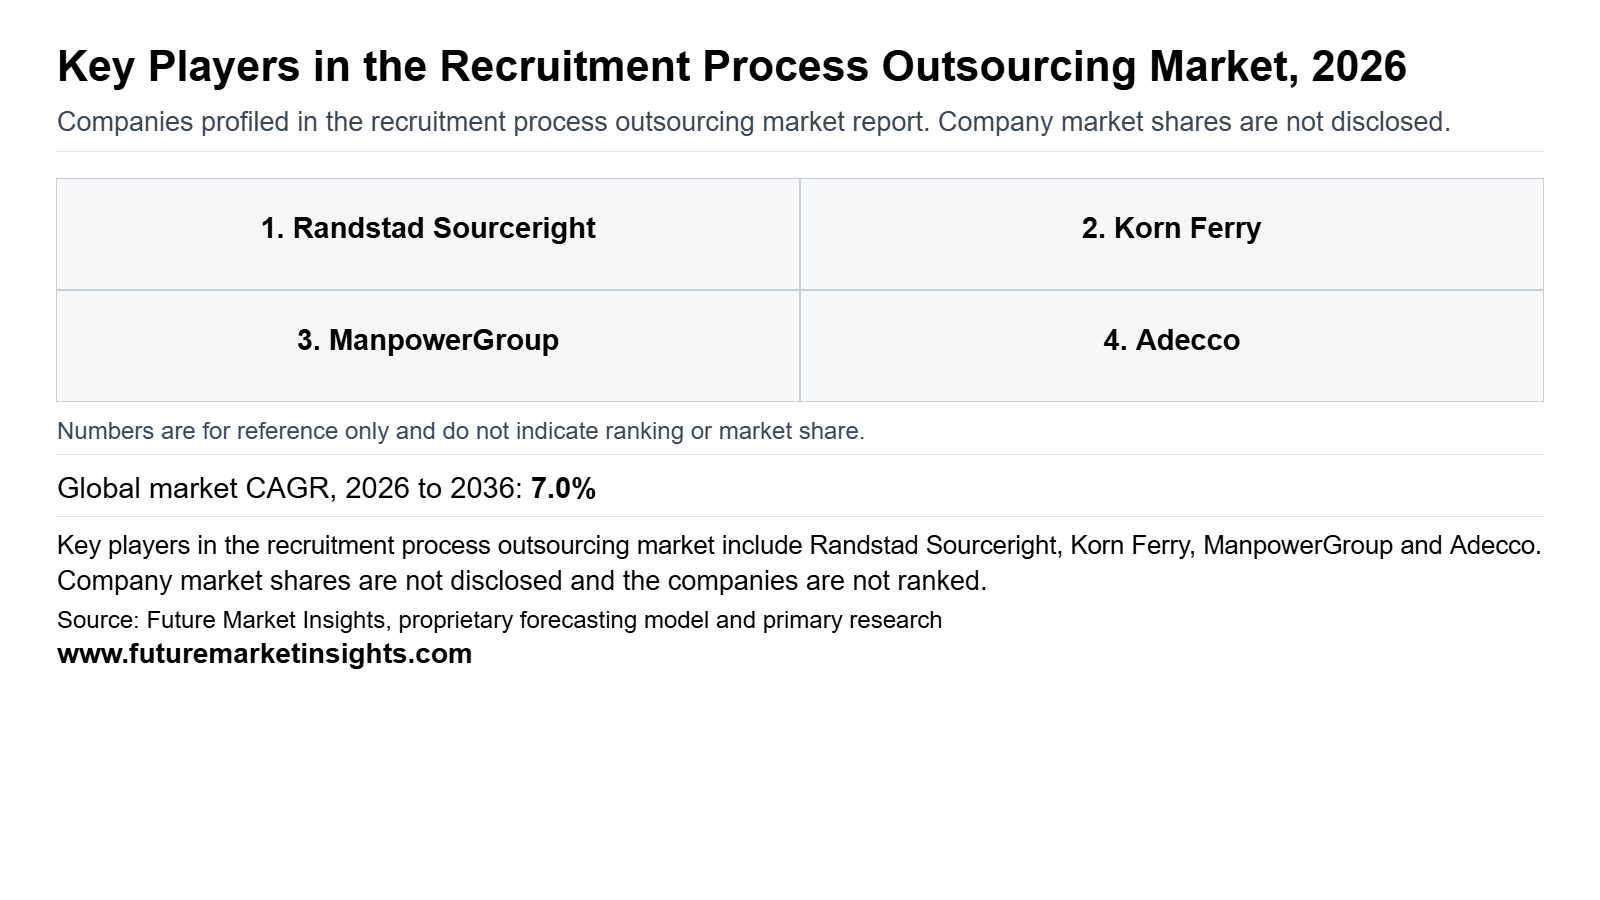
Notable companies operating in the global recruitment process outsourcing market include Randstad Sourceright, Korn Ferry, ManpowerGroup, Adecco, Allegis Global Solutions, Alexander Mann Solutions, Cielo, Hudson RPO, Hays, and Kelly. Competition forms at two structural levels. Staffing groups such as Randstad and ManpowerGroup and Adecco and Kelly and Hays run RPO beside temporary and permanent placement and managed services. Consulting-led and specialist providers such as Korn Ferry and Alexander Mann Solutions and Cielo and Hudson compete on talent advisory depth and technology. Enterprise buyers reward global delivery and this keeps Randstad Sourceright as the leading company. Technology alliances and regional acquisitions offer the clearest partnership scope beyond the core North American and European programs.
How Are Companies Positioned in the Recruitment Process Outsourcing Market?
Positioning separates integrated staffing platforms from consulting-led specialists. Korn Ferry completed its AMS acquisition on 1 September 2026 and formed a combined firm of nearly 17 thousand colleagues in more than 130 offices (Korn Ferry, September 2026). Hudson Talent Solutions acquired Cornerstone RPO on 3 November 2026 to bolster its presence in the US RPO market (Hudson, November 2026). Consolidation therefore narrows the field of independent specialists and pushes buyers toward providers that combine search and RPO and advisory under one contract.
What Matters When a Buyer Selects a Recruitment Process Outsourcing Supplier?
Enterprise buyers select an RPO partner on proven delivery across several regions and on the ability to flex between full programs and project hiring because hiring volumes shift with demand. Randstad Sourceright credits its US Leader designation in the Everest Group assessment to specialized hiring for hard-to-fill technical roles and to flexible models including end-to-end and modular and project RPO (Randstad Sourceright, July 2026). ManpowerGroup reports that Talent Solutions RPO was named a Global Leader in the same assessment for the 16th consecutive year (ManpowerGroup, August 2026). Buyers should read these ratings as company-reported and confirm them through client references.
Which Capabilities Distinguish Product Offers?
Product offers diverge on how much technology and advisory sit around the core sourcing service. Allegis Global Solutions reports that Everest Group credits its Acumen platform and agentic AI workflows along with hybrid RPO models and consulting services (Allegis Global Solutions, September 2026). Randstad Sourceright reinforced an integrated partnership with Workday (Randstad Sourceright, July 2026). Hays serves large enterprise clients mainly through managed service provider contracts and also provides RPO and onboarding and workforce planning (Hays, August 2026). These layers let providers sell adjacent services into the same client.
How Does Geographic Reach Affect Competition?
Reach follows the places where the largest hiring programs sit and the teams able to serve them. Cornerstone RPO serves clients in the US and Canada and Mexico and this adds North American delivery depth to Hudson (Hudson, November 2026). Hays is narrowing its footprint to 16 countries and three core products under its Momentum strategy (Hays, August 2026). Regional acquisitions and focused footprints therefore decide which providers extend reach and which concentrate it.
| Verified Company Evidence (2026) | Commercial Effect | Buyer Action |
|---|---|---|
| 1 September 2026 Korn Ferry completed its acquisition of AMS and formed a firm of nearly 17 thousand colleagues in more than 130 offices [Korn Ferry (September 2026)]. | Joins executive search and talent consulting with technology-enabled talent solutions delivered at scale. | Review contract terms and delivery teams in programs that span Korn Ferry and AMS. |
| 3 November 2026 Hudson Talent Solutions acquired Cornerstone RPO of Richmond Virginia which serves clients from startups to Fortune 100 companies [Hudson (November 2026)]. | Adds North American delivery depth and an established client roster to a global RPO provider. | Confirm recruiter continuity and technology integration plans for transferred programs. |
| 20 August 2026 Hays launched its Momentum strategy with a footprint of 16 countries and three core products including Solutions [Hays (August 2026)]. | Concentrates investment on fewer markets and on enterprise outsourcing. | Check regional coverage in Hays RPO and managed service proposals. |
Source: Verified corporate disclosures and Future Market Insights analysis, 2026.
| Company | Core Positioning | Verified Activity & Source Attribution |
|---|---|---|
| Randstad Sourceright | RPO platform inside Randstad Enterprise and the leading company | Reports a US Leader designation in the 2026 Everest Group assessment on 20 July 2026 (Randstad Sourceright, July 2026). |
| Korn Ferry | Executive search and talent consulting with RPO | Completed the AMS acquisition on 1 September 2026 (Korn Ferry, September 2026). |
| ManpowerGroup | Talent Solutions RPO within a global workforce group | Reported a 16th consecutive Global Leader year on 12 August 2026 (ManpowerGroup, August 2026). |
| Adecco | Global staffing group with recruitment solutions | Positioning only. Recent activity sits outside the source list. |
| Allegis Global Solutions | Workforce solutions across RPO and managed services and services procurement | Reports a US Leader placement in the 2026 Everest Group assessment on 2 September 2026 (Allegis Global Solutions, September 2026). |
| Alexander Mann Solutions | Talent acquisition outsourcing provider now operating as AMS | Joined Korn Ferry on 1 September 2026 (Korn Ferry, September 2026). |
| Cielo | Talent acquisition partner built around RPO | Positioning only. Recent activity sits outside the source list. |
| Hudson RPO | Global RPO provider within Hudson Talent Solutions | Acquired Cornerstone RPO on 3 November 2026 (Hudson, November 2026). |
| Hays | Specialist recruiter with an enterprise Solutions division | Launched its Momentum strategy on 20 August 2026 (Hays, August 2026). |
| Kelly | Specialty talent group with KellyOCG RPO | Positioning only. Recent activity sits outside the source list. |
Source: Verified corporate disclosures and Future Market Insights analysis, 2026.
Recruitment Process Outsourcing Market Report Scope and Research Methodology
FMI sizes the recruitment process outsourcing market from the number of hires managed by providers in each country multiplied by the average fee earned per hire. National staffing and recruitment industry totals provide the cross-check. Enterprise RPO anchors the model because multi-year contracts with large employers produce the most visible and repeatable fee streams. Project and modular and contingent workforce engagements convert to full-process hire equivalents so every service model shares one volume basis. Revenue is counted in the country where the hired worker is based. Service and client and country figures sum to the global total in every year. Company disclosures verify service positioning and client mix rather than estimate proprietary company revenue.
| Coverage Field | Report Scope |
|---|---|
| Market definition | Revenue from outsourced recruitment services that cover enterprise and modular and project and contingent workforce hiring for employer clients across professional and hourly and early talent and executive roles. |
| Product types | Enterprise RPO / modular and on-demand RPO / project RPO / contingent workforce RPO |
| Variants | Professional and skilled hiring / high-volume hourly hiring / early talent hiring / executive and leadership hiring |
| Ingredients or materials included | Sourcing teams and applicant tracking platforms and employer branding programs and assessment tools and recruitment analytics |
| Packaging formats | Multi-year enterprise contracts / per-hire fee models / project-based engagements / on-demand service modules |
| Distribution channels | Direct enterprise sales / master vendor program tenders / consulting and advisory partners |
| End users | IT and telecom / banking and insurance / healthcare and life sciences / manufacturing and industrial / retail and consumer goods |
| Exclusions | Standalone applicant tracking software / traditional contingent search agency placements / temporary staffing payroll revenue / executive search retainers outside RPO contracts |
| Quantitative units | USD billion for value and hires managed for volume |
| Volume basis | Full-process hire equivalents with project and modular and contingent workforce engagements converted to hire terms |
| Value basis | Fee revenue from clients in each country counted where the hired worker is based |
| Regions covered | North America / Latin America / Western Europe / Eastern Europe / East Asia / South Asia and Pacific / Middle East and Africa |
| National coverage | United States / United Kingdom / Australia / Germany / Japan / South Korea |
| Companies covered | Randstad Sourceright / Korn Ferry / ManpowerGroup / Adecco / Allegis Global Solutions / Alexander Mann Solutions / Cielo / Hudson RPO / Hays / Kelly |
Source: Future Market Insights analysis of the recruitment process outsourcing market, 2026.
Research Sources and Bibliography
- Adecco Group (November 2026). The Adecco Group Q3 2026 Results [results release, November 12, 2026]. https://www.adeccogroup.com/our-group/media/press-releases/q3-2026-results
- Allegis Global Solutions (September 2026). Allegis Global Solutions Named a Leader on Everest Group’s 2026 RPO PEAK Matrix® Assessment for the US Market [Press release, 2 September 2026]. https://www.allegisglobalsolutions.com/about-us/news-and-events/press-releases/2026-everest-group-peak-matrix-2026-rpo-us-press-release
- Australian Bureau of Statistics (October 2026). Job Vacancies, Australia, August 2026 [statistical release]. https://www.abs.gov.au/statistics/labour/jobs/job-vacancies-australia/latest-release
- Bureau of Labor Statistics (November 2026). Job Openings and Labor Turnover Summary, September 2026 [news release, November 3, 2026]. https://www.bls.gov/news.release/jolts.nr0.htm
- Cabinet Office, Government of Japan (July 2025). Annual Report on the Japanese Economy and Public Finance, Summary [white paper summary, July 2025]. https://www5.cao.go.jp/keizai3/2025/0729wp-keizai/setsumei-e2025.pdf
- Hays (August 2026). Hays Report Year Ended 30 June 2026: Decisive Actions Drive Profit Growth in H2; Momentum Strategy Launched [Results report, 20 August 2026]. https://www.haysplc.com/~/media/Files/H/Hays/results-centre/FY26/Prelims/Hays%20FY26%20Prelims%20-%20web.htm
- Hudson (November 2026). Hudson Talent Solutions Acquires Cornerstone RPO Expanding North American Delivery Capabilities [Press release, 3 November 2026]. https://hudsontalent.com/press-release/hudson-talent-solutions-acquires-cornerstone-rpo-expanding-north-american-delivery-capabilities/
- Institute for Employment Research (September 2026). IAB-Stellenerhebung: Rückgang der offenen Stellen im zweiten Quartal 2026 auf rund 1 Million [press release, 3 September 2026]. https://iab.de/presseinfo/iab-stellenerhebung-rueckgang-der-offenen-stellen-im-zweiten-quartal-2026-auf-rund-1-million/
- Korn Ferry (January 2026). Beyond RPO. https://www.kornferry.com/insights/featured-topics/talent-recruitment/rpo-solutions-for-talent-strategy
- Korn Ferry (September 2026). Korn Ferry Announces First Quarter Fiscal 2027 Results of Operations [results release, September 9, 2026]. https://www.kornferry.com/about-us/press/korn-ferry-announces-first-quarter-fiscal-2027-results-of-operations
- Korn Ferry (September 2026). Korn Ferry Completes Acquisition of AMS [Press release, 1 September 2026]. https://www.kornferry.com/about-us/press/korn-ferry-completes-acquisition-of-ams
- Korn Ferry (March 2026). Third quarter fiscal 2026 results and earnings call [news article, 9 March 2026]. https://www.staffingindustry.com/news/global-daily-news/korn-ferry-q3-revenue-up-73-with-growth-across-most-segments
- ManpowerGroup (August 2026). As Skills Shortages and AI Reshape Hiring, Talent Solutions RPO Named a Global RPO Leader for Helping Organizations Navigate a Changing Workforce [Press release, 12 August 2026]. https://investor.manpower.com/node/69101
- ManpowerGroup (September 2026). Global Hiring Outlook Strengthens for Q4 as Workforce Transformation Drives Demand for New Skills [press release, September 8, 2026]. https://investor.manpowergroup.com/node/69136
- ManpowerGroup (October 2026). ManpowerGroup Reports 3rd Quarter 2026 Results [results release, October 15, 2026]. https://investor.manpowergroup.com/news-releases/news-release-details/manpowergroup-reports-3rd-quarter-2026-results
- Ministry of Employment and Labor, Republic of Korea (July 2026). June 2026 Labor Market Trends from Employment Administration Statistics [press release, 13 July 2026]. https://www.moel.go.kr/news/enews/report/enewsView.do?news_seq=19654
- Office for National Statistics (November 2026). Labour Market Overview, UK: November 2026 [statistical bulletin, 17 November 2026]. https://www.ons.gov.uk/employmentandlabourmarket/peopleinwork/employmentandemployeetypes/bulletins/uklabourmarket/november2026
- Ogletree Deakins (2026). Global AI and data compliance. https://ogletree.com/insights-resources/blog-posts/global-ai-and-data-compliance-why-u-s-employers-cant-afford-a-u-s-only-lens/
- Randstad (October 2026). Randstad Q3 2026 Earnings Call Transcript [earnings call transcript, October 21, 2026]. https://www.randstad.com/s3fs-media/rscom/public/2026-10/Q3_2026_Earnings_Call_Transcript.pdf
- Randstad (October 2026). Third quarter 2026 results [news article, 21 October 2026]. https://www.staffingindustry.com/news/global-daily-news/randstad-q3-revenue-rises-39-amid-growth-in-north-america
- Randstad Sourceright (July 2026). Navigating the US Talent Landscape: Why Randstad Sourceright Is a Top RPO Provider for 2026 [Company web page, 20 July 2026]. https://www.randstadenterprise.com/insights/us/everest-group-recruitment-process-outsourcing-rpo-peak-matrix-assessment-2026-us-focus-on-randstad-sourceright/
- Recruitment Process Outsourcing Association (June 2026). AI Task Force initial findings [12 June 2026]. https://www.pulse.bot/hrtech/news/rpoa-ai-task-force-shares-initial-findings-on-the-impact-of-ai-on-recruitment-process-outsourcing-rp-31a8218f-2f79-428b-b138-25e066cb2f02/
Table of Content
- Key Takeaways
- Market Size and CAGR
- Top Growth Driver
- Fastest Growing Segment
- Leading Region
- Key Companies
- Emerging Opportunities
- Executive Summary
- Global Market Outlook
- Demand-side Trends
- Supply-side Trends
- Technology Roadmap Analysis
- Analysis and Recommendations
- Analyst Perspective (What is happening? Why now? What should investors know?)
- Key Questions Answered
- How large is the market?
- What is the CAGR?
- What are key trends?
- Which region dominates?
- Who are the leaders?
Read More...
- Market Overview
- Market Coverage / Taxonomy
- Market Definition / Scope / Limitations
- Research Methodology
- Chapter Orientation
- Analytical Lens and Working Hypotheses
- Market Structure, Signals, and Trend Drivers
- Benchmarking and Cross-market Comparability
- Market Sizing, Forecasting, and Opportunity Mapping
- Research Design and Evidence Framework
- Desk Research Programme (Secondary Evidence)
- Expert Input and Fieldwork (Primary Evidence)
- Tooling, Models, and Reference Databases
- Data Engineering and Model Build
- Quality Assurance and Audit Trail
- Market Background
- Market Dynamics (Drivers, Restraints, Opportunity, Trends)
- Scenario Forecast (Optimistic, Likely, Conservative)
- Impact Analysis
- AI Impact
- Sustainability Impact
- Regulatory Impact
- Technology Impact
- Consumer / Buyer Analysis
- Purchase Drivers
- Adoption Barriers
- Buyer Journey
- Opportunity Map Analysis
- Product Life Cycle Analysis
- Supply Chain Analysis
- Investment Feasibility Matrix
- Value Chain Analysis
- PESTLE and Porter's Analysis
- Regulatory Landscape
- Regional Parent Market Outlook
- Production and Consumption Statistics
- Import and Export Statistics
- Global Market Analysis and Forecast, 2021 to 2036
- Historical Market Size Value (USD Billion) Analysis, 2021 to 2025
- Current and Future Market Size Value (USD Billion) Projections, 2026 to 2036
- Y-o-Y Growth Trend Analysis
- Absolute $ Opportunity Analysis
- Global Market Pricing Analysis, 2021 to 2036
- Global Market Analysis and Forecast, By Service Model, 2021 to 2036
- Introduction / Key Findings
- Historical Market Size Value (USD Billion) Analysis By Service Model, 2021 to 2025
- Current and Future Market Size Value (USD Billion) Analysis and Forecast By Service Model, 2026 to 2036
- Enterprise RPO
- Modular and On-Demand RPO
- Project RPO
- Contingent Workforce RPO
- Y-o-Y Growth Trend Analysis By Service Model, 2021 to 2025
- Absolute $ Opportunity Analysis By Service Model, 2026 to 2036
- Global Market Analysis and Forecast, By End Use, 2021 to 2036
- Introduction / Key Findings
- Historical Market Size Value (USD Billion) Analysis By End Use, 2021 to 2025
- Current and Future Market Size Value (USD Billion) Analysis and Forecast By End Use, 2026 to 2036
- IT and Telecom
- Banking and Insurance
- Healthcare and Life Sciences
- Manufacturing and Industrial
- Retail and Consumer Goods
- Y-o-Y Growth Trend Analysis By End Use, 2021 to 2025
- Absolute $ Opportunity Analysis By End Use, 2026 to 2036
- Global Market Analysis and Forecast, By Client Size, 2021 to 2036
- Introduction / Key Findings
- Historical Market Size Value (USD Billion) Analysis By Client Size, 2021 to 2025
- Current and Future Market Size Value (USD Billion) Analysis and Forecast By Client Size, 2026 to 2036
- Global Enterprises
- Large Enterprises
- Mid-Sized Companies
- Small Companies
- Y-o-Y Growth Trend Analysis By Client Size, 2021 to 2025
- Absolute $ Opportunity Analysis By Client Size, 2026 to 2036
- Global Market Analysis and Forecast, By Role Level, 2021 to 2036
- Introduction / Key Findings
- Historical Market Size Value (USD Billion) Analysis By Role Level, 2021 to 2025
- Current and Future Market Size Value (USD Billion) Analysis and Forecast By Role Level, 2026 to 2036
- Professional and Skilled
- High-Volume Hourly
- Early Talent
- Executive and Leadership
- Y-o-Y Growth Trend Analysis By Role Level, 2021 to 2025
- Absolute $ Opportunity Analysis By Role Level, 2026 to 2036
- Global Market Analysis and Forecast, By Region, 2021 to 2036
- Introduction
- Historical Market Size Value (USD Billion) Analysis By Region, 2021 to 2025
- Current Market Size Value (USD Billion) Analysis and Forecast By Region, 2026 to 2036
- North America
- Latin America
- Western Europe
- Eastern Europe
- East Asia
- South Asia and Pacific
- Middle East and Africa
- Market Attractiveness Analysis By Region
- North America Market Analysis and Forecast, By Country, 2021 to 2036
- Historical Market Size Value (USD Billion) Trend Analysis By Market Taxonomy, 2021 to 2025
- Market Size Value (USD Billion) Forecast By Market Taxonomy, 2026 to 2036
- By Country
- United States
- Canada
- By Service Model
- By End Use
- By Client Size
- By Role Level
- By Country
- Market Attractiveness Analysis
- By Country
- By Service Model
- By End Use
- By Client Size
- By Role Level
- Key Takeaways
- Latin America Market Analysis and Forecast, By Country, 2021 to 2036
- Historical Market Size Value (USD Billion) Trend Analysis By Market Taxonomy, 2021 to 2025
- Market Size Value (USD Billion) Forecast By Market Taxonomy, 2026 to 2036
- By Country
- Brazil
- Mexico
- Argentina
- Chile
- By Service Model
- By End Use
- By Client Size
- By Role Level
- By Country
- Market Attractiveness Analysis
- By Country
- By Service Model
- By End Use
- By Client Size
- By Role Level
- Key Takeaways
- Western Europe Market Analysis and Forecast, By Country, 2021 to 2036
- Historical Market Size Value (USD Billion) Trend Analysis By Market Taxonomy, 2021 to 2025
- Market Size Value (USD Billion) Forecast By Market Taxonomy, 2026 to 2036
- By Country
- Germany
- France
- United Kingdom
- Italy
- Spain
- Benelux
- Nordics
- By Service Model
- By End Use
- By Client Size
- By Role Level
- By Country
- Market Attractiveness Analysis
- By Country
- By Service Model
- By End Use
- By Client Size
- By Role Level
- Key Takeaways
- Eastern Europe Market Analysis and Forecast, By Country, 2021 to 2036
- Historical Market Size Value (USD Billion) Trend Analysis By Market Taxonomy, 2021 to 2025
- Market Size Value (USD Billion) Forecast By Market Taxonomy, 2026 to 2036
- By Country
- Poland
- Czech Republic
- Romania
- Hungary
- By Service Model
- By End Use
- By Client Size
- By Role Level
- By Country
- Market Attractiveness Analysis
- By Country
- By Service Model
- By End Use
- By Client Size
- By Role Level
- Key Takeaways
- East Asia Market Analysis and Forecast, By Country, 2021 to 2036
- Historical Market Size Value (USD Billion) Trend Analysis By Market Taxonomy, 2021 to 2025
- Market Size Value (USD Billion) Forecast By Market Taxonomy, 2026 to 2036
- By Country
- China
- Japan
- South Korea
- By Service Model
- By End Use
- By Client Size
- By Role Level
- By Country
- Market Attractiveness Analysis
- By Country
- By Service Model
- By End Use
- By Client Size
- By Role Level
- Key Takeaways
- South Asia and Pacific Market Analysis and Forecast, By Country, 2021 to 2036
- Historical Market Size Value (USD Billion) Trend Analysis By Market Taxonomy, 2021 to 2025
- Market Size Value (USD Billion) Forecast By Market Taxonomy, 2026 to 2036
- By Country
- India
- ASEAN
- Australia and New Zealand
- By Service Model
- By End Use
- By Client Size
- By Role Level
- By Country
- Market Attractiveness Analysis
- By Country
- By Service Model
- By End Use
- By Client Size
- By Role Level
- Key Takeaways
- Middle East and Africa Market Analysis and Forecast, By Country, 2021 to 2036
- Historical Market Size Value (USD Billion) Trend Analysis By Market Taxonomy, 2021 to 2025
- Market Size Value (USD Billion) Forecast By Market Taxonomy, 2026 to 2036
- By Country
- GCC Countries
- South Africa
- Türkiye
- Israel
- By Service Model
- By End Use
- By Client Size
- By Role Level
- By Country
- Market Attractiveness Analysis
- By Country
- By Service Model
- By End Use
- By Client Size
- By Role Level
- Key Takeaways
- Key Countries Market Analysis
- United States
- Pricing Analysis
- Market Share Analysis, 2025
- By Service Model
- By End Use
- By Client Size
- By Role Level
- Canada
- Pricing Analysis
- Market Share Analysis, 2025
- By Service Model
- By End Use
- By Client Size
- By Role Level
- Brazil
- Pricing Analysis
- Market Share Analysis, 2025
- By Service Model
- By End Use
- By Client Size
- By Role Level
- Mexico
- Pricing Analysis
- Market Share Analysis, 2025
- By Service Model
- By End Use
- By Client Size
- By Role Level
- Argentina
- Pricing Analysis
- Market Share Analysis, 2025
- By Service Model
- By End Use
- By Client Size
- By Role Level
- Chile
- Pricing Analysis
- Market Share Analysis, 2025
- By Service Model
- By End Use
- By Client Size
- By Role Level
- Germany
- Pricing Analysis
- Market Share Analysis, 2025
- By Service Model
- By End Use
- By Client Size
- By Role Level
- France
- Pricing Analysis
- Market Share Analysis, 2025
- By Service Model
- By End Use
- By Client Size
- By Role Level
- United Kingdom
- Pricing Analysis
- Market Share Analysis, 2025
- By Service Model
- By End Use
- By Client Size
- By Role Level
- Italy
- Pricing Analysis
- Market Share Analysis, 2025
- By Service Model
- By End Use
- By Client Size
- By Role Level
- Spain
- Pricing Analysis
- Market Share Analysis, 2025
- By Service Model
- By End Use
- By Client Size
- By Role Level
- Benelux
- Pricing Analysis
- Market Share Analysis, 2025
- By Service Model
- By End Use
- By Client Size
- By Role Level
- Nordics
- Pricing Analysis
- Market Share Analysis, 2025
- By Service Model
- By End Use
- By Client Size
- By Role Level
- Poland
- Pricing Analysis
- Market Share Analysis, 2025
- By Service Model
- By End Use
- By Client Size
- By Role Level
- Czech Republic
- Pricing Analysis
- Market Share Analysis, 2025
- By Service Model
- By End Use
- By Client Size
- By Role Level
- Romania
- Pricing Analysis
- Market Share Analysis, 2025
- By Service Model
- By End Use
- By Client Size
- By Role Level
- Hungary
- Pricing Analysis
- Market Share Analysis, 2025
- By Service Model
- By End Use
- By Client Size
- By Role Level
- China
- Pricing Analysis
- Market Share Analysis, 2025
- By Service Model
- By End Use
- By Client Size
- By Role Level
- Japan
- Pricing Analysis
- Market Share Analysis, 2025
- By Service Model
- By End Use
- By Client Size
- By Role Level
- South Korea
- Pricing Analysis
- Market Share Analysis, 2025
- By Service Model
- By End Use
- By Client Size
- By Role Level
- India
- Pricing Analysis
- Market Share Analysis, 2025
- By Service Model
- By End Use
- By Client Size
- By Role Level
- ASEAN
- Pricing Analysis
- Market Share Analysis, 2025
- By Service Model
- By End Use
- By Client Size
- By Role Level
- Australia and New Zealand
- Pricing Analysis
- Market Share Analysis, 2025
- By Service Model
- By End Use
- By Client Size
- By Role Level
- GCC Countries
- Pricing Analysis
- Market Share Analysis, 2025
- By Service Model
- By End Use
- By Client Size
- By Role Level
- South Africa
- Pricing Analysis
- Market Share Analysis, 2025
- By Service Model
- By End Use
- By Client Size
- By Role Level
- Türkiye
- Pricing Analysis
- Market Share Analysis, 2025
- By Service Model
- By End Use
- By Client Size
- By Role Level
- Israel
- Pricing Analysis
- Market Share Analysis, 2025
- By Service Model
- By End Use
- By Client Size
- By Role Level
- United States
- Market Structure Analysis
- Competition Dashboard
- Competition Benchmarking
- Market Share Analysis of Top Players
- By Region
- By Service Model
- By End Use
- By Client Size
- By Role Level
- Emerging Startups
- Innovation Benchmarking
- Competition Analysis
- Competition Deep Dive
- Randstad Sourceright
- Overview
- Product Portfolio
- Profitability by Market Segments
- Sales Footprint
- Strategy Overview
- Marketing Strategy
- Product Strategy
- Channel Strategy
- Korn Ferry
- ManpowerGroup
- Adecco
- Allegis Global Solutions
- Alexander Mann Solutions
- Cielo
- Hudson RPO
- Hays
- Kelly
- Randstad Sourceright
- Case Studies
- Success Stories
- Recent Developments
- Competition Deep Dive
- Assumptions & Acronyms Used
List of Tables
- Table 1: Global Market Value (USD Billion) Forecast by Region, 2021 to 2036
- Table 2: Global Market Value (USD Billion) Forecast by Service Model, 2021 to 2036
- Table 3: Global Market Value (USD Billion) Forecast by End Use, 2021 to 2036
- Table 4: Global Market Value (USD Billion) Forecast by Client Size, 2021 to 2036
- Table 5: Global Market Value (USD Billion) Forecast by Role Level, 2021 to 2036
- Table 6: North America Market Value (USD Billion) Forecast by Country, 2021 to 2036
- Table 7: North America Market Value (USD Billion) Forecast by Service Model, 2021 to 2036
- Table 8: North America Market Value (USD Billion) Forecast by End Use, 2021 to 2036
- Table 9: North America Market Value (USD Billion) Forecast by Client Size, 2021 to 2036
- Table 10: North America Market Value (USD Billion) Forecast by Role Level, 2021 to 2036
- Table 11: Latin America Market Value (USD Billion) Forecast by Country, 2021 to 2036
- Table 12: Latin America Market Value (USD Billion) Forecast by Service Model, 2021 to 2036
- Table 13: Latin America Market Value (USD Billion) Forecast by End Use, 2021 to 2036
- Table 14: Latin America Market Value (USD Billion) Forecast by Client Size, 2021 to 2036
- Table 15: Latin America Market Value (USD Billion) Forecast by Role Level, 2021 to 2036
- Table 16: Western Europe Market Value (USD Billion) Forecast by Country, 2021 to 2036
- Table 17: Western Europe Market Value (USD Billion) Forecast by Service Model, 2021 to 2036
- Table 18: Western Europe Market Value (USD Billion) Forecast by End Use, 2021 to 2036
- Table 19: Western Europe Market Value (USD Billion) Forecast by Client Size, 2021 to 2036
- Table 20: Western Europe Market Value (USD Billion) Forecast by Role Level, 2021 to 2036
- Table 21: Eastern Europe Market Value (USD Billion) Forecast by Country, 2021 to 2036
- Table 22: Eastern Europe Market Value (USD Billion) Forecast by Service Model, 2021 to 2036
- Table 23: Eastern Europe Market Value (USD Billion) Forecast by End Use, 2021 to 2036
- Table 24: Eastern Europe Market Value (USD Billion) Forecast by Client Size, 2021 to 2036
- Table 25: Eastern Europe Market Value (USD Billion) Forecast by Role Level, 2021 to 2036
- Table 26: East Asia Market Value (USD Billion) Forecast by Country, 2021 to 2036
- Table 27: East Asia Market Value (USD Billion) Forecast by Service Model, 2021 to 2036
- Table 28: East Asia Market Value (USD Billion) Forecast by End Use, 2021 to 2036
- Table 29: East Asia Market Value (USD Billion) Forecast by Client Size, 2021 to 2036
- Table 30: East Asia Market Value (USD Billion) Forecast by Role Level, 2021 to 2036
- Table 31: South Asia and Pacific Market Value (USD Billion) Forecast by Country, 2021 to 2036
- Table 32: South Asia and Pacific Market Value (USD Billion) Forecast by Service Model, 2021 to 2036
- Table 33: South Asia and Pacific Market Value (USD Billion) Forecast by End Use, 2021 to 2036
- Table 34: South Asia and Pacific Market Value (USD Billion) Forecast by Client Size, 2021 to 2036
- Table 35: South Asia and Pacific Market Value (USD Billion) Forecast by Role Level, 2021 to 2036
- Table 36: Middle East and Africa Market Value (USD Billion) Forecast by Country, 2021 to 2036
- Table 37: Middle East and Africa Market Value (USD Billion) Forecast by Service Model, 2021 to 2036
- Table 38: Middle East and Africa Market Value (USD Billion) Forecast by End Use, 2021 to 2036
- Table 39: Middle East and Africa Market Value (USD Billion) Forecast by Client Size, 2021 to 2036
- Table 40: Middle East and Africa Market Value (USD Billion) Forecast by Role Level, 2021 to 2036
List of Figures
- Figure 1: Global Market Pricing Analysis
- Figure 2: Global Market Value (USD Billion) Forecast 2021-2036
- Figure 3: Global Market Value Share and BPS Analysis by Service Model, 2026 and 2036
- Figure 4: Global Market Y-o-Y Growth Comparison by Service Model, 2026-2036
- Figure 5: Global Market Attractiveness Analysis by Service Model
- Figure 6: Global Market Value Share and BPS Analysis by End Use, 2026 and 2036
- Figure 7: Global Market Y-o-Y Growth Comparison by End Use, 2026-2036
- Figure 8: Global Market Attractiveness Analysis by End Use
- Figure 9: Global Market Value Share and BPS Analysis by Client Size, 2026 and 2036
- Figure 10: Global Market Y-o-Y Growth Comparison by Client Size, 2026-2036
- Figure 11: Global Market Attractiveness Analysis by Client Size
- Figure 12: Global Market Value Share and BPS Analysis by Role Level, 2026 and 2036
- Figure 13: Global Market Y-o-Y Growth Comparison by Role Level, 2026-2036
- Figure 14: Global Market Attractiveness Analysis by Role Level
- Figure 15: Global Market Value (USD Billion) Share and BPS Analysis by Region, 2026 and 2036
- Figure 16: Global Market Y-o-Y Growth Comparison by Region, 2026-2036
- Figure 17: Global Market Attractiveness Analysis by Region
- Figure 18: North America Market Incremental Dollar Opportunity, 2026-2036
- Figure 19: Latin America Market Incremental Dollar Opportunity, 2026-2036
- Figure 20: Western Europe Market Incremental Dollar Opportunity, 2026-2036
- Figure 21: Eastern Europe Market Incremental Dollar Opportunity, 2026-2036
- Figure 22: East Asia Market Incremental Dollar Opportunity, 2026-2036
- Figure 23: South Asia and Pacific Market Incremental Dollar Opportunity, 2026-2036
- Figure 24: Middle East and Africa Market Incremental Dollar Opportunity, 2026-2036
- Figure 25: North America Market Value Share and BPS Analysis by Country, 2026 and 2036
- Figure 26: North America Market Value Share and BPS Analysis by Service Model, 2026 and 2036
- Figure 27: North America Market Y-o-Y Growth Comparison by Service Model, 2026-2036
- Figure 28: North America Market Attractiveness Analysis by Service Model
- Figure 29: North America Market Value Share and BPS Analysis by End Use, 2026 and 2036
- Figure 30: North America Market Y-o-Y Growth Comparison by End Use, 2026-2036
- Figure 31: North America Market Attractiveness Analysis by End Use
- Figure 32: North America Market Value Share and BPS Analysis by Client Size, 2026 and 2036
- Figure 33: North America Market Y-o-Y Growth Comparison by Client Size, 2026-2036
- Figure 34: North America Market Attractiveness Analysis by Client Size
- Figure 35: North America Market Value Share and BPS Analysis by Role Level, 2026 and 2036
- Figure 36: North America Market Y-o-Y Growth Comparison by Role Level, 2026-2036
- Figure 37: North America Market Attractiveness Analysis by Role Level
- Figure 38: Latin America Market Value Share and BPS Analysis by Country, 2026 and 2036
- Figure 39: Latin America Market Value Share and BPS Analysis by Service Model, 2026 and 2036
- Figure 40: Latin America Market Y-o-Y Growth Comparison by Service Model, 2026-2036
- Figure 41: Latin America Market Attractiveness Analysis by Service Model
- Figure 42: Latin America Market Value Share and BPS Analysis by End Use, 2026 and 2036
- Figure 43: Latin America Market Y-o-Y Growth Comparison by End Use, 2026-2036
- Figure 44: Latin America Market Attractiveness Analysis by End Use
- Figure 45: Latin America Market Value Share and BPS Analysis by Client Size, 2026 and 2036
- Figure 46: Latin America Market Y-o-Y Growth Comparison by Client Size, 2026-2036
- Figure 47: Latin America Market Attractiveness Analysis by Client Size
- Figure 48: Latin America Market Value Share and BPS Analysis by Role Level, 2026 and 2036
- Figure 49: Latin America Market Y-o-Y Growth Comparison by Role Level, 2026-2036
- Figure 50: Latin America Market Attractiveness Analysis by Role Level
- Figure 51: Western Europe Market Value Share and BPS Analysis by Country, 2026 and 2036
- Figure 52: Western Europe Market Value Share and BPS Analysis by Service Model, 2026 and 2036
- Figure 53: Western Europe Market Y-o-Y Growth Comparison by Service Model, 2026-2036
- Figure 54: Western Europe Market Attractiveness Analysis by Service Model
- Figure 55: Western Europe Market Value Share and BPS Analysis by End Use, 2026 and 2036
- Figure 56: Western Europe Market Y-o-Y Growth Comparison by End Use, 2026-2036
- Figure 57: Western Europe Market Attractiveness Analysis by End Use
- Figure 58: Western Europe Market Value Share and BPS Analysis by Client Size, 2026 and 2036
- Figure 59: Western Europe Market Y-o-Y Growth Comparison by Client Size, 2026-2036
- Figure 60: Western Europe Market Attractiveness Analysis by Client Size
- Figure 61: Western Europe Market Value Share and BPS Analysis by Role Level, 2026 and 2036
- Figure 62: Western Europe Market Y-o-Y Growth Comparison by Role Level, 2026-2036
- Figure 63: Western Europe Market Attractiveness Analysis by Role Level
- Figure 64: Eastern Europe Market Value Share and BPS Analysis by Country, 2026 and 2036
- Figure 65: Eastern Europe Market Value Share and BPS Analysis by Service Model, 2026 and 2036
- Figure 66: Eastern Europe Market Y-o-Y Growth Comparison by Service Model, 2026-2036
- Figure 67: Eastern Europe Market Attractiveness Analysis by Service Model
- Figure 68: Eastern Europe Market Value Share and BPS Analysis by End Use, 2026 and 2036
- Figure 69: Eastern Europe Market Y-o-Y Growth Comparison by End Use, 2026-2036
- Figure 70: Eastern Europe Market Attractiveness Analysis by End Use
- Figure 71: Eastern Europe Market Value Share and BPS Analysis by Client Size, 2026 and 2036
- Figure 72: Eastern Europe Market Y-o-Y Growth Comparison by Client Size, 2026-2036
- Figure 73: Eastern Europe Market Attractiveness Analysis by Client Size
- Figure 74: Eastern Europe Market Value Share and BPS Analysis by Role Level, 2026 and 2036
- Figure 75: Eastern Europe Market Y-o-Y Growth Comparison by Role Level, 2026-2036
- Figure 76: Eastern Europe Market Attractiveness Analysis by Role Level
- Figure 77: East Asia Market Value Share and BPS Analysis by Country, 2026 and 2036
- Figure 78: East Asia Market Value Share and BPS Analysis by Service Model, 2026 and 2036
- Figure 79: East Asia Market Y-o-Y Growth Comparison by Service Model, 2026-2036
- Figure 80: East Asia Market Attractiveness Analysis by Service Model
- Figure 81: East Asia Market Value Share and BPS Analysis by End Use, 2026 and 2036
- Figure 82: East Asia Market Y-o-Y Growth Comparison by End Use, 2026-2036
- Figure 83: East Asia Market Attractiveness Analysis by End Use
- Figure 84: East Asia Market Value Share and BPS Analysis by Client Size, 2026 and 2036
- Figure 85: East Asia Market Y-o-Y Growth Comparison by Client Size, 2026-2036
- Figure 86: East Asia Market Attractiveness Analysis by Client Size
- Figure 87: East Asia Market Value Share and BPS Analysis by Role Level, 2026 and 2036
- Figure 88: East Asia Market Y-o-Y Growth Comparison by Role Level, 2026-2036
- Figure 89: East Asia Market Attractiveness Analysis by Role Level
- Figure 90: South Asia and Pacific Market Value Share and BPS Analysis by Country, 2026 and 2036
- Figure 91: South Asia and Pacific Market Value Share and BPS Analysis by Service Model, 2026 and 2036
- Figure 92: South Asia and Pacific Market Y-o-Y Growth Comparison by Service Model, 2026-2036
- Figure 93: South Asia and Pacific Market Attractiveness Analysis by Service Model
- Figure 94: South Asia and Pacific Market Value Share and BPS Analysis by End Use, 2026 and 2036
- Figure 95: South Asia and Pacific Market Y-o-Y Growth Comparison by End Use, 2026-2036
- Figure 96: South Asia and Pacific Market Attractiveness Analysis by End Use
- Figure 97: South Asia and Pacific Market Value Share and BPS Analysis by Client Size, 2026 and 2036
- Figure 98: South Asia and Pacific Market Y-o-Y Growth Comparison by Client Size, 2026-2036
- Figure 99: South Asia and Pacific Market Attractiveness Analysis by Client Size
- Figure 100: South Asia and Pacific Market Value Share and BPS Analysis by Role Level, 2026 and 2036
- Figure 101: South Asia and Pacific Market Y-o-Y Growth Comparison by Role Level, 2026-2036
- Figure 102: South Asia and Pacific Market Attractiveness Analysis by Role Level
- Figure 103: Middle East and Africa Market Value Share and BPS Analysis by Country, 2026 and 2036
- Figure 104: Middle East and Africa Market Value Share and BPS Analysis by Service Model, 2026 and 2036
- Figure 105: Middle East and Africa Market Y-o-Y Growth Comparison by Service Model, 2026-2036
- Figure 106: Middle East and Africa Market Attractiveness Analysis by Service Model
- Figure 107: Middle East and Africa Market Value Share and BPS Analysis by End Use, 2026 and 2036
- Figure 108: Middle East and Africa Market Y-o-Y Growth Comparison by End Use, 2026-2036
- Figure 109: Middle East and Africa Market Attractiveness Analysis by End Use
- Figure 110: Middle East and Africa Market Value Share and BPS Analysis by Client Size, 2026 and 2036
- Figure 111: Middle East and Africa Market Y-o-Y Growth Comparison by Client Size, 2026-2036
- Figure 112: Middle East and Africa Market Attractiveness Analysis by Client Size
- Figure 113: Middle East and Africa Market Value Share and BPS Analysis by Role Level, 2026 and 2036
- Figure 114: Middle East and Africa Market Y-o-Y Growth Comparison by Role Level, 2026-2036
- Figure 115: Middle East and Africa Market Attractiveness Analysis by Role Level
- Figure 116: Global Market - Tier Structure Analysis
- Figure 117: Global Market - Company Share Analysis
Frequently Asked Questions
How big is the Recruitment Process Outsourcing Market in 2026?
Future Market Insights estimates the global recruitment process outsourcing market at USD 6.6 billion in 2026 and projects it to reach USD 12.9 billion by 2036.
How fast is the Recruitment Process Outsourcing Market expected to grow through 2036?
FMI projects the market to expand at a 7.0% CAGR from 2026 to 2036, reflecting the increasing adoption of outsourced recruitment services across industries.
Which service model leads the Recruitment Process Outsourcing Market?
Enterprise RPO leads the service model segment with a 42.0% share, reflecting the preference of large organizations for comprehensive outsourced recruitment solutions.
Which end-use industry accounts for the largest share of the Recruitment Process Outsourcing Market?
IT and telecom lead the end-use segment with a 26.8% share, supported by continuous hiring requirements for skilled technology and telecommunications professionals.
Which countries are expected to record the fastest growth in the Recruitment Process Outsourcing Market?
Japan is projected to record the fastest growth at a 7.3% CAGR from 2026 to 2036, followed by Australia at 7.2% and South Korea at 6.9%.
Who are the leading players in the Recruitment Process Outsourcing Market?
Key players in the recruitment process outsourcing market include Randstad Sourceright, Korn Ferry, ManpowerGroup, Adecco, Allegis Global Solutions, Alexander Mann Solutions, Cielo, Hudson RPO, Hays, and Kelly.
Preview the report firsthand - request a free sample
Get SampleGet the brochure for pricing and purchase details.
Get PDF
