Resilient Desert Plant Extracts Market Size and Share Forecast Outlook 2025 to 2035

A valuation of USD 1,053.1 million has been projected for the Resilient Desert Plant Extracts Market in 2025, and the figure is anticipated to reach USD 3,452.7 million by 2035. This remarkable increase of USD 2,399.6 million represents a threefold expansion, equivalent to a CAGR of 12.6% during the period 2025-2035.
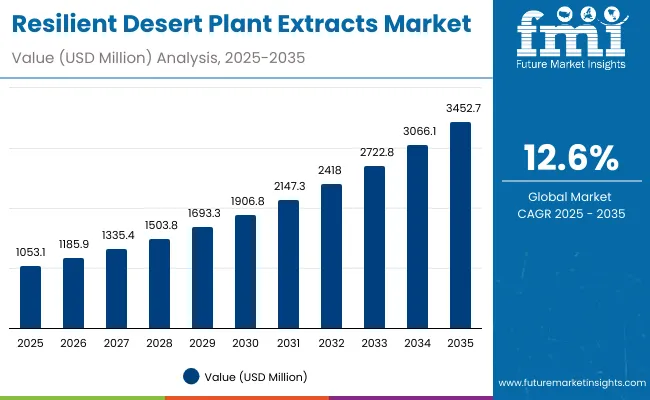
Quick Stats for Resilient Desert Plant Extracts Market

  • Resilient Desert Plant Extracts Market Value (2025): USD 1,053.1 million
  • Resilient Desert Plant Extracts Market Forecast Value (2035): USD 3,452.7 million
  • Resilient Desert Plant Extracts Market Forecast CAGR (2025 to 2035): 12.6%
  • Leading Segment in 2025: Hydration (52.5%)
  • Key Growth Regions: China, India, Japan, USA, Europe
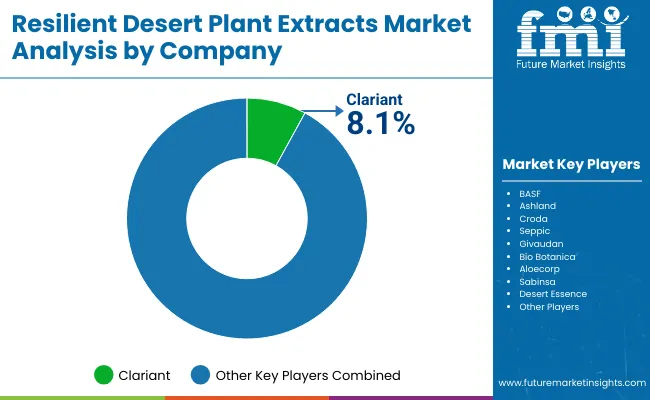
  • Top Key Players: Clariant, BASF, Ashland, Croda, Seppic, Givaudan, Bio Botanica, Aloecorp, Sabinsa, Desert Essence

Resilient Desert Plant Extracts Market

Resilient Desert Plant Extracts Market Key Takeaways

Metric Value
Resilient Desert Plant Extracts Market Estimated Value in (2025E) USD 1,053.1 million
Resilient Desert Plant Extracts Market Forecast Value in (2035F) USD 3,452.7 million
Forecast CAGR (2025 to 2035) 12.60%

During the initial half of the decade, the market is expected to rise steadily from USD 1,053.1 million in 2025 to USD 1,906.8 million in 2030, generating an incremental value of USD 853.7 million. This phase is likely to account for 35.6% of the total forecast growth. Expansion during these years is anticipated to be shaped by consistent adoption of hydration-focused formulations, as desert-derived ingredients continue to resonate with demand for moisture-rich, functional, and natural solutions. Hydration is forecast to lead the functional segments with 52.5% share in 2025, highlighting its dominance in consumer preferences.

The second phase, spanning from 2030 to 2035, is projected to deliver accelerated growth, adding USD 1,545.9 million as the market advances from USD 1,906.8 million to USD 3,452.7 million. This represents 64.4% of the total decade expansion, underpinned by widespread demand for sustainable sourcing and eco-ethical claims. Sustainable sourcing is forecast to dominate the claim segment with 51.5% share in 2025, reinforcing its role as a decisive driver. Stronger adoption of resilient ingredients in personal care and wellness applications is expected to sustain momentum in the later years.

Between 2020 and 2024, the Resilient Desert Plant Extracts Market expanded steadily as demand for natural, eco-ethical, and multifunctional plant-based solutions gained traction across personal care and wellness applications. The competitive environment was largely defined by ingredient suppliers, who held significant influence through proprietary sourcing methods and resilient supply chains. By 2025, demand is expected to climb to USD 1,053.1 million, with hydration-led formulations capturing the highest value share.

The period 2025-2035 is projected to witness transformative momentum, as revenues are forecast to triple, reaching USD 3,452.7 million. Growth will be underpinned by consumer-driven emphasis on sustainable sourcing, which is set to dominate with 51.5% share in 2025. Competitive differentiation is anticipated to shift toward ecological certifications, innovation in bioactive efficacy, and strategic positioning in high-growth markets such as China and India. Established players are expected to diversify into advanced sustainability platforms, while regional firms may leverage cost-effective supply models. Competitive advantage is projected to evolve from basic extract provision to ecosystem-driven strategies built on traceability, clean-label alignment, and long-term environmental resilience.

Why the Resilient Desert Plant Extracts Market is growing?

Growth in the Resilient Desert Plant Extracts Market is being fueled by rising consumer preference for natural, sustainable, and multifunctional ingredients. Increased awareness of hydration, anti-aging, and protective benefits associated with desert-derived botanicals has been observed, and these properties are being valued for their resilience against extreme climates. Demand has been further strengthened by the global shift toward clean-label, vegan, and eco-ethical claims, with sustainable sourcing recognized as a decisive growth driver.

Expanding use of aloe vera, baobab, cactus, and prickly pear extracts is being reinforced by their proven efficacy in skincare and wellness applications. Rapid adoption in high-growth economies such as China and India is being supported by evolving consumer lifestyles and the expansion of premium personal care categories. Regulatory encouragement for eco-conscious formulations is also influencing industry direction. Competitive differentiation is projected to be built on transparency, traceability, and innovation in functional performance, sustaining momentum throughout the forecast period.

Segmental Analysis

The Resilient Desert Plant Extracts Market has been segmented by function, claim, and product type to capture the key dynamics shaping demand. Each segment reflects evolving consumer priorities, where hydration-led performance, sustainable sourcing practices, and diverse product formulations are being emphasized as critical growth drivers. Functional segmentation highlights the dominance of hydration, supported by the intrinsic moisture-retention properties of desert-derived botanicals.

Claim-based segmentation underlines the growing preference for sustainable sourcing, reflecting the alignment of consumer behavior with ethical and eco-conscious standards. In terms of product type, creams and lotions continue to account for the largest share, reaffirming their role as core applications in skincare and wellness regimens. These segments together illustrate how resilience, sustainability, and everyday usability are converging to define the trajectory of this market through 2035.
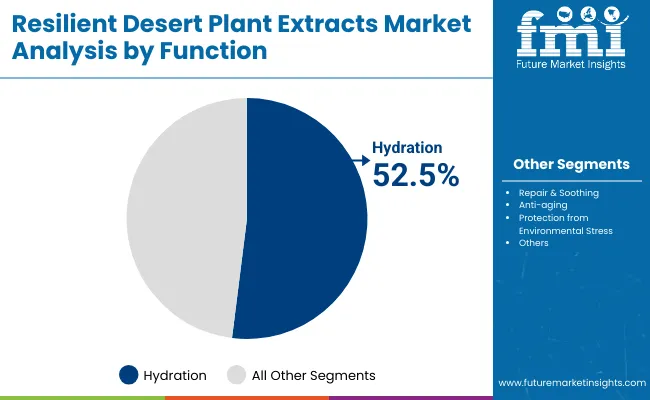
Insights into the Function Segment with Hydration Leading in Market Share

Resilient Desert Plant Extracts Market By Function

Segment Market Value Share, 2025
Hydration 52.5%
Others 47.5%

Hydration is expected to emerge as the dominant functional segment in the Resilient Desert Plant Extracts Market, accounting for 52.5% of the share in 2025 with USD 551.5 million in sales. This dominance is being supported by the proven ability of desert-derived actives to retain moisture under extreme conditions, a property that resonates strongly with skincare and wellness consumers. The category is projected to expand further as awareness of natural hydration solutions continues to rise, reinforced by demand for products that provide both immediate and long-term moisture benefits. While repair, soothing, and anti-aging functions are expected to maintain relevance, the sustained consumer preference for hydration-led formulations is likely to ensure continued leadership in this segment throughout the forecast horizon.
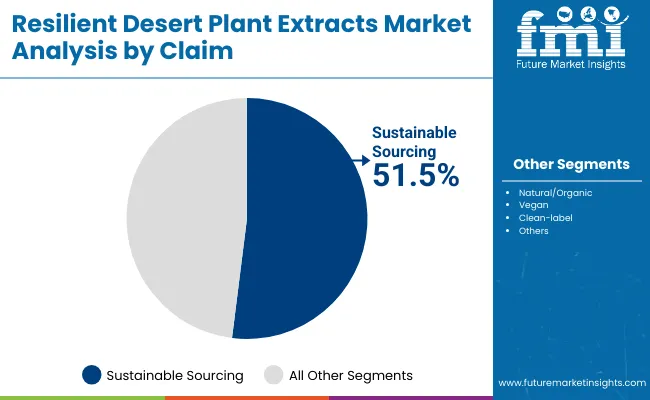
Insights into the Claim Segment with Sustainable Sourcing Driving Growth

Resilient Desert Plant Extracts Market By Claim

Segment Market Value Share, 2025
Sustainable sourcing 51.5%
Others 48.5%

Sustainable sourcing is projected to dominate the claim segment with 51.5% share in 2025, generating USD 541.4 million in revenue. Growth in this category is being reinforced by rising consumer demand for eco-conscious and ethically produced formulations, as well as by regulatory initiatives promoting transparency and sustainability. The ability of desert plant extracts to thrive in arid climates with minimal resources has positioned them as symbols of ecological resilience, strengthening their role in sustainable supply chains. Consumer alignment with environmental responsibility is expected to intensify, pushing sustainable sourcing further into the mainstream. Other claims such as natural, organic, clean-label, and vegan will retain importance, but sustainable sourcing is forecast to remain the most influential growth driver in this segment.
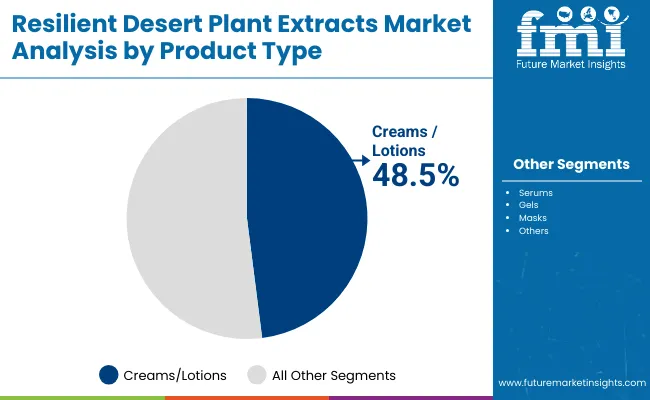
Insights into the Product Type Segment with Creams and Lotions Leading in Market Share

Resilient Desert Plant Extracts Market By Product

Segment Market Value Share, 2025
Creams/lotions 48.5%
Others 51.5%

Creams and lotions are anticipated to lead the product type segment with 48.5% share in 2025, contributing USD 509.1 million in sales. This leadership is being supported by their everyday use and broad adoption across global skincare routines, ensuring consistent demand for desert-derived hydration and protective benefits. Growth in this segment is likely to be enhanced by product innovations offering improved textures, multifunctional benefits, and sensorial appeal. Other product types, representing 51.5% share and USD 542.5 million in 2025, are projected to expand steadily as consumer interest in diverse formulations such as gels and masks gains momentum. However, creams and lotions are expected to remain the backbone of market revenues due to their entrenched role in daily personal care regimens.

What are the Drivers, Restraints, and Key Trends of the Resilient Desert Plant Extracts Market?

Despite promising growth, the Resilient Desert Plant Extracts Market is being shaped by complex sustainability requirements and shifting consumer priorities, even as opportunities in advanced bioactive innovation and ethical supply chains continue to reinforce expansion across personal care and wellness industries.

Ecological Resilience as a Value Proposition

Market momentum is being supported by the ecological resilience of desert plants, which thrive in harsh environments while utilizing minimal resources. This characteristic is being positioned as a strategic advantage in sustainability narratives, allowing brands to build differentiation beyond traditional functional claims. Extracts from aloe vera, baobab, cactus, and prickly pear are increasingly being recognized not only for hydration or repair but also for their symbolic alignment with climate adaptation. As climate stress becomes a mainstream concern, desert plant extracts are expected to be marketed as natural solutions embodying environmental survival, creating deeper resonance with eco-conscious consumers. This dynamic is anticipated to accelerate adoption by both established and emerging brands.

Supply Chain Fragility and Traceability Gaps

Constraints are being observed in ensuring transparent, traceable, and resilient supply chains for desert botanicals. Many cultivation zones remain concentrated in specific geographies, exposing producers to climate volatility, regional policy shifts, and logistical disruptions. Without strong traceability frameworks, ethical sourcing claims may face scrutiny, undermining consumer trust. Regulatory focus on proof of sustainability is intensifying, and the inability to verify origins could restrict scalability. Investment in digital traceability systems and fair-trade certifications is projected to become essential for industry credibility. This restraint, if unaddressed, could limit the pace at which the market expands globally.
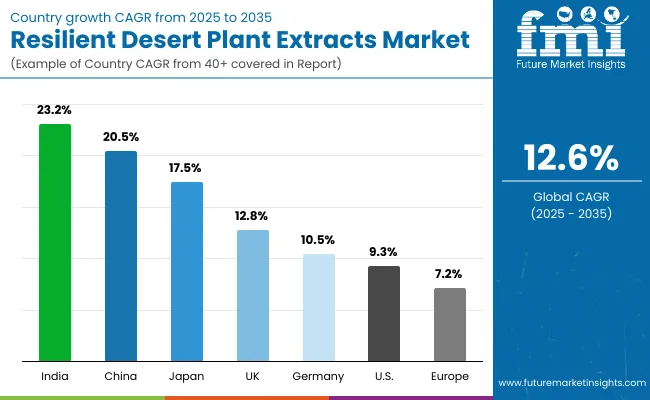
Analysis of Resilient Desert Plant Extracts Market By Key Countries

Resilient Desert Plant Extracts Market By Country

Countries CAGR
China 20.5%
USA 9.3%
India 23.2%
UK 12.8%
Germany 10.5%
Japan 17.5%

Adoption of resilient desert plant extracts is being observed at varied speeds across leading global markets, reflecting differences in consumer priorities, regulatory frameworks, and industrial innovation. Asia is projected to demonstrate the fastest pace of expansion, with India expected to record a CAGR of 23.2% and China anticipated at 20.5% between 2025 and 2035. India’s growth is likely to be reinforced by rising demand for natural wellness and skincare solutions, while China is expected to benefit from large-scale commercialization supported by sustainability policies and advanced manufacturing ecosystems. Japan, at 17.5% CAGR, is forecast to sustain momentum through its strong alignment with premium personal care categories emphasizing natural efficacy.

In Europe, growth is projected at a comparatively modest 7.2%, with Germany at 10.5% and the UK at 12.8%. Market expansion in the region is anticipated to be driven by regulatory support for eco-labels, though saturation and compliance costs may temper acceleration. North America is expected to demonstrate moderate growth, with the USA forecast at 9.3% CAGR, reflecting its maturity in natural ingredients adoption but slower uptake relative to Asia. Collectively, these country-level variations highlight how sustainability narratives, regulatory influence, and consumer alignment with eco-conscious choices are shaping long-term opportunities.
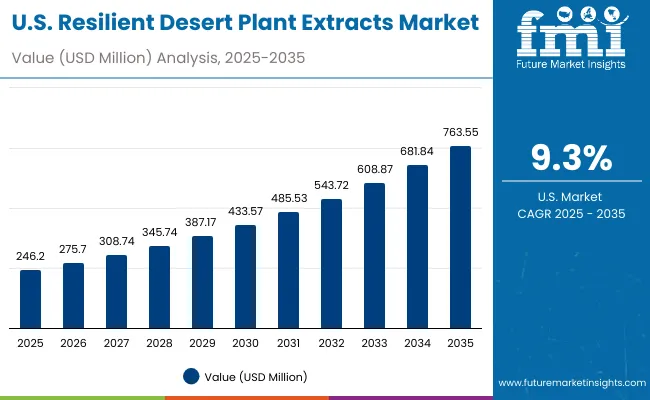
Sales Outlook for Resilient Desert Plant Extracts Market in the United States

Resilient Desert Plant Extracts Market Usa

Year USA Resilient Desert Plant Extracts Market (USD Million)
2025 246.20
2026 275.70
2027 308.74
2028 345.74
2029 387.17
2030 433.57
2031 485.53
2032 543.72
2033 608.87
2034 681.84
2035 763.55

The Resilient Desert Plant Extracts Market in the United States is projected to grow at a CAGR of 12% from 2025 to 2035, advancing from USD 246.2 million to USD 763.6 million. Expansion is expected to be reinforced by sustained demand for hydration-led formulations, supported by proven desert plant bioactive properties. Sustainable sourcing is anticipated to emerge as a differentiator, with eco-ethical claims likely to shape consumer loyalty and regulatory alignment.

Premium personal care and wellness applications are forecast to capture the majority of demand, with hydration and repair benefits aligning closely with USA consumer expectations. Partnerships between extract producers and formulators are projected to strengthen competitive positioning, while innovation in multifunctional ingredients is expected to diversify product portfolios.

  • Hydration-based applications are projected to retain the highest adoption levels.
  • Sustainable sourcing claims are expected to elevate brand equity and credibility.
  • Premium wellness and clean-label categories are forecast to accelerate growth.

Growth and Expansion Outlook for Resilient Desert Plant Extracts Market in the United Kingdom

A CAGR of 12.8% is projected for the UK Resilient Desert Plant Extracts Market through 2035. Expansion is expected to be shaped by retailer-led sustainability scorecards, stringent substantiation standards, and consumer preference for traceable naturals. Hydration-led efficacy will remain the anchor use case, while eco-labels will guide premium positioning. E-commerce and pharmacy chains are anticipated to serve as the primary scale channels, with own-label ranges integrating ethically sourced desert botanicals. Formulators are likely to prioritize lifecycle-assessed inputs and recyclable packaging, reinforcing brand trust. Partnerships with certified growers and third-party auditors are expected to de-risk supply continuity and claims verification.

  • Retailer sustainability scorecards are expected to steer assortment choices.
  • Third-party verification of sustainable sourcing is likely to be required for premium listings.
  • Pharmacy and online channels are projected to concentrate volume.
  • Hydration-centric claims are anticipated to anchor repeat purchase.

Growth and Expansion Outlook for Resilient Desert Plant Extracts Market in India

A CAGR of 23.2% is projected for India, indicating the fastest trajectory among key markets. Growth is expected to be enabled by Ayurveda-aligned formulations, domestic cultivation capacity in arid zones, and cost-efficient processing ecosystems. Hydration and soothing benefits are likely to be embedded in mass-premium skincare, while clean-label and vegan cues enhance trust. Contract manufacturing clusters are anticipated to scale private-label launches for modern trade and D2C brands. Digital commerce will catalyze nationwide reach, and localized storytelling around water stewardship is expected to elevate brand equity. Harmonization with eco-label standards is projected to unlock export opportunities across Asia and the Middle East.

  • Ayurveda compatibility is expected to accelerate formulation adoption.
  • Arid-zone cultivation and contract manufacturing are likely to underpin scale.
  • D2C and marketplace channels are projected to drive discovery.
  • Sustainability storytelling around water use is anticipated to differentiate brands

Sales Outlook for Resilient Desert Plant Extracts Market in China

A CAGR of 20.5% is projected for China through 2035. Momentum is expected to be supported by clean-beauty regulation, rapid product cycle times, and data-driven merchandising on leading social-commerce platforms. Hydration leadership is likely to persist, with sustainable-sourcing claims gaining visibility through digital traceability pilots. Local extraction and blending capacity are anticipated to compress lead times, enabling frequent seasonal drops. Cross-border assortments will complement domestic lines where certified sourcing narratives are strongest. Collaboration between ingredient producers and C-beauty brands is expected to yield sensorial textures optimized for humid and dry climates alike.
  • Social-commerce analytics are projected to refine SKU velocity and claims testing.
  • Digital traceability is expected to validate sustainable-sourcing narratives.
  • Localized extraction capacity is likely to reduce cycle times.
  • Hydration-first positioning is anticipated to anchor hero products.

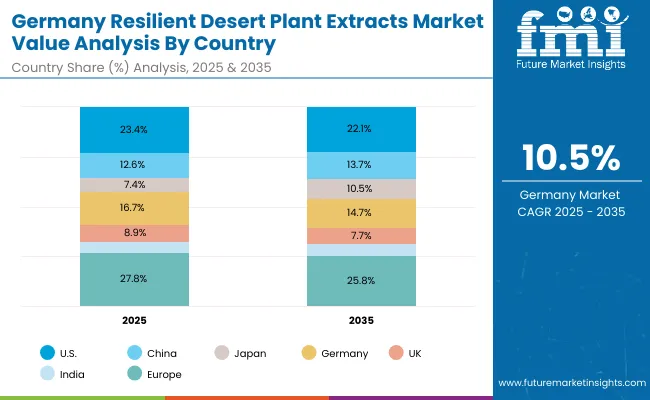
In-depth Analysis of Resilient Desert Plant Extracts Market in Germany

Resilient Desert Plant Extracts Market Germany

Countries 2025
USA 23.4%
China 12.6%
Japan 7.4%
Germany 16.7%
UK 8.9%
India 5.6%
Countries 2035
USA 22.1%
China 13.7%
Japan 10.5%
Germany 14.7%
UK 7.7%
India 6.3%

A CAGR of 10.5% is projected for Germany, reflecting disciplined expansion under rigorous safety and environmental norms. Market development is expected to be shaped by pharmacy-led counseling, strong interest in clinically substantiated naturals, and preference for recyclable packaging. Sustainable-sourcing claims are likely to be scrutinized, driving adoption of supplier audits and chain-of-custody documentation. Hydration and repair benefits are anticipated to feature in dermocosmetic ranges targeting sensitive-skin users. Specialty retail and e-pharmacies are expected to concentrate value, while private-label portfolios standardize eco-criteria across tiers. Supplier partnerships emphasizing LCA data and fair-trade frameworks are projected to secure durable placements.
  • Pharmacy and dermocosmetic channels are expected to concentrate premium sales.
  • Chain-of-custody documentation is likely to be decisive for sustainable claims.
  • Recyclable packaging and LCA reporting are projected to influence listings.
  • Hydration-plus-repair positioning is anticipated to resonate with sensitive-skin segments.

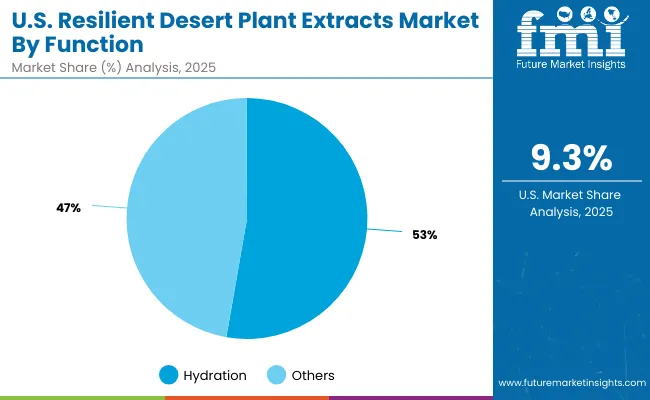
Growth Outlook for Resilient Desert Plant Extracts Market in USA

Resilient Desert Plant Extracts Market Usa 2

Segment Market Value Share, 2025
Hydration 52.5%
Others 47.5%

The USA Resilient Desert Plant Extracts Market is projected at USD 246.2 million in 2025. Hydration contributes 52.5%, while other functions hold 47.5%, reflecting balanced but hydration-led demand. This hydration leadership is being reinforced by the proven ability of desert-derived botanicals to retain moisture under extreme conditions, a property that aligns closely with consumer expectations in personal care. The functional advantage of hydration is anticipated to sustain long-term adoption, particularly as climate-induced dryness and environmental stress heighten consumer awareness of protective care.

Other functional categories, including repair, soothing, and anti-aging, are also expected to maintain a strong presence, supported by demand for multifunctional natural solutions. However, hydration’s dominance underscores its position as the cornerstone of functional claims in the USA market. Strategic innovation is likely to integrate hydration benefits with sustainability narratives, further strengthening competitive positioning.
  • The USA market is valued at USD 246.2 million in 2025.
  • Hydration leads functional share at 52.5% vs. 47.5% for others.
  • Growth is expected to be reinforced by climate resilience and eco-label alignment.
  • Multifunctional benefits are projected to expand the relevance of non-hydration categories.

Opportunity Analysis of China Resilient Desert Plant Extracts Market

Resilient Desert Plant Extracts Market China

Segment Market Value Share, 2025
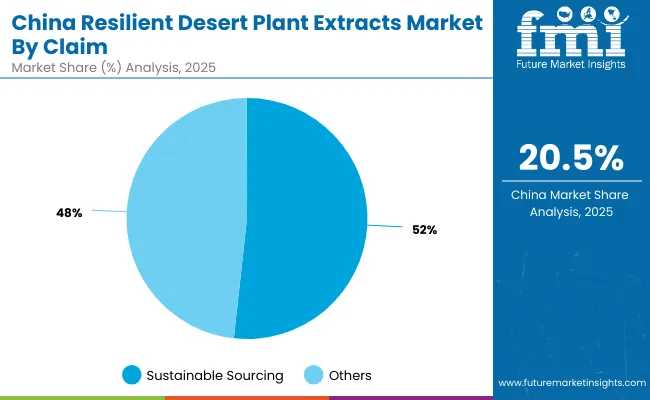
Sustainable sourcing 51.5%
Others 48.5%

The Resilient Desert Plant Extracts Market in China is projected at USD 132.9 million in 2025. Sustainable sourcing contributes 51.5%, while other claims account for 48.5%, reflecting a near-equal split but clear leadership of sustainability-driven narratives. This emphasis on sustainable sourcing is being supported by regulatory encouragement for eco-friendly practices and consumer alignment with ethical choices. Rising sensitivity to traceability, environmental responsibility, and supply chain transparency is expected to reinforce the primacy of this claim throughout the decade.

Other claims, including natural, organic, clean-label, and vegan attributes, are anticipated to retain strong relevance as consumer awareness expands across skincare and wellness categories. However, sustainable sourcing’s dominance illustrates how environmental narratives are being integrated into purchasing behavior, particularly among younger demographics. Brand differentiation in China is likely to be shaped by the depth of sustainability integration, combined with the performance efficacy of desert-derived actives.
  • The Chinese market is valued at USD 132.9 million in 2025.
  • Sustainable sourcing leads with 51.5% vs. 48.5% for other claims.
  • Regulatory push for eco-ethical practices is expected to reinforce leadership.
  • Brand equity is projected to be defined by sustainability plus efficacy.

Competitive Landscape of Resilient Desert Plant Extracts Market

Resilient Desert Plant Extracts Market By Company

The Resilient Desert Plant Extracts Market is moderately fragmented, with global leaders, mid-sized innovators, and niche specialists competing across diverse applications. Global ingredient leaders such as Clariant, BASF, Ashland, Croda, Seppic, and Givaudan are recognized as key players in this market, reflecting their deep expertise in specialty chemicals and botanical actives. These companies are strengthening portfolios with desert-derived extracts positioned for hydration, anti-aging, and eco-ethical claims. Their strategies are being aligned toward sustainability certifications, supply chain traceability, and partnerships with personal care brands to secure long-term relevance.

Mid-sized innovators such as Bio Botanica, Aloecorp, Sabinsa, and Desert Essence are addressing demand for niche and regionally specialized formulations. Their strength lies in vertical integration of sourcing, strong alignment with natural wellness narratives, and adaptability to regional preferences. These firms are expected to grow by catering to D2C brands and natural personal care labels prioritizing authenticity and transparency.

Niche-focused specialists are emphasizing application-specific solutions, including organic certification, vegan-compatible offerings, and clean-label positioning. Their competitive advantage is being driven by agility, regional adaptability, and close consumer alignment.

Competitive differentiation is expected to shift from traditional extract supply toward ecosystem leadership built on sustainability, multifunctional efficacy, and traceable sourcing platforms.

Key Developments in Resilient Desert Plant Extracts Market

  • Clariant unveiled its new "Clariant Beauty" portfolio during in-Cosmetics Global in Amsterdam. It combined the capabilities of Clariant and Lucas Meyer Cosmetics to deliver sustainable, high-performance actives. Ingredients like GlowCytocin™, Melicica™, Aristoflex™ SUN, and Nipaguard™ SCE Vita were introduced, aligning with clean-label, eco-ethical, and adaptive beauty trends
  • At NYSCC Supplier’s Day 2025, Clariant showcased its #BeautyTok Unboxed line, reflecting viral social-media trends via new formulations (milky toners, overnight masks) and two novel ingredients: Plantasens Emulsifier HP 49 (for barrier support) and Nipaguard SCE Vita (100% renewable preservative blend). These developments signaled deepening emphasis on sustainability, efficacy, and trend agility.

Scope of the Report

Item Value
Quantitative Units USD 1,053.1 million (2025E) - USD 3,452.7 million (2035F)
Function Hydration (52.5%, USD 551.5 million in 2025), Others (47.5%, USD 499.9 million in 2025)
Claim Sustainable sourcing (51.5%, USD 541.4 million in 2025), Others (48.5%, USD 510.6 million in 2025)
Product Type Creams/lotions (48.5%, USD 509.1 million in 2025), Others (51.5%, USD 542.5 million in 2025)
Channel E-commerce, Pharmacies, Specialty retail, Mass retail
Regions Covered North America, Europe, Asia-Pacific, Latin America, Middle East & Africa
Countries Covered United States, Canada, Germany, United Kingdom, France, China, Japan, India, Brazil, South Africa
Key Companies Profiled Clariant, BASF, Ashland, Croda, Seppic, Givaudan, Bio Botanica, Aloecorp, Sabinsa, Desert Essence
Additional Attributes Dollar sales by function, claim, and product type; adoption trends in hydration and eco-ethical claims; rising demand for vegan, clean-label, and organic botanicals; sustainable sourcing and traceability initiatives; sector-specific growth in skincare, nutraceuticals, and wellness; regional variations driven by regulatory standards and consumer behavior; innovations in eco-friendly cultivation and extraction technologies.

Key Segments

By Source:

  • Cactus extracts
  • Baobab
  • Aloe vera
  • Prickly pear

By Function:

  • Hydration
  • Repair & soothing
  • Anti-aging
  • Protection from environmental stress

By Product Type:

  • Serums
  • Creams/lotions
  • Gels
  • Masks

By Channel:

  • E-commerce
  • Pharmacies
  • Specialty retail
  • Mass retail

By Claim:

  • Sustainable sourcing
  • Natural/organic
  • Vegan
  • Clean-label

By Region:

  • North America
  • Latin America
  • Europe
  • East Asia
  • South Asia & Pacific
  • Middle East and Africa

Table of Content

  1. Executive Summary
    • Global Market Outlook
    • Demand-side Trends
    • Supply-side Trends
    • Technology Roadmap Analysis
    • Analysis and Recommendations
  2. Market Overview
    • Market Coverage / Taxonomy
    • Market Definition / Scope / Limitations
  3. Market Background
    • Market Dynamics
      • Drivers
      • Restraints
      • Opportunity
      • Trends
    • Scenario Forecast
      • Demand in Optimistic Scenario
      • Demand in Likely Scenario
      • Demand in Conservative Scenario
    • Opportunity Map Analysis
    • Product Life Cycle Analysis
    • Supply Chain Analysis
    • Investment Feasibility Matrix
    • Value Chain Analysis
    • PESTLE and Porter’s Analysis
    • Regulatory Landscape
    • Regional Parent Market Outlook
    • Production and Consumption Statistics
    • Import and Export Statistics
  4. Global Market Analysis 2020 to 2024 and Forecast, 2025 to 2035
    • Historical Market Size Value (USD Million) Analysis, 2020 to 2024
    • Current and Future Market Size Value (USD Million) Projections, 2025 to 2035
      • Y-o-Y Growth Trend Analysis
      • Absolute $ Opportunity Analysis
  5. Global Market Pricing Analysis 2020 to 2024 and Forecast 2025 to 2035
  6. Global Market Analysis 2020 to 2024 and Forecast 2025 to 2035, By Source
    • Introduction / Key Findings
    • Historical Market Size Value (USD Million) Analysis By Source, 2020 to 2024
    • Current and Future Market Size Value (USD Million) Analysis and Forecast By Source, 2025 to 2035
      • Cactus extracts
      • Baobab
      • Aloe vera
      • Prickly pear
    • Y-o-Y Growth Trend Analysis By Source, 2020 to 2024
    • Absolute $ Opportunity Analysis By Source, 2025 to 2035
  7. Global Market Analysis 2020 to 2024 and Forecast 2025 to 2035, By Function
    • Introduction / Key Findings
    • Historical Market Size Value (USD Million) Analysis By Function, 2020 to 2024
    • Current and Future Market Size Value (USD Million) Analysis and Forecast By Function, 2025 to 2035
      • Hydration
      • Repair & soothing
      • Anti-aging
      • Protection from environmental stress
    • Y-o-Y Growth Trend Analysis By Function, 2020 to 2024
    • Absolute $ Opportunity Analysis By Function, 2025 to 2035
  8. Global Market Analysis 2020 to 2024 and Forecast 2025 to 2035, By Product Type
    • Introduction / Key Findings
    • Historical Market Size Value (USD Million) Analysis By Product Type, 2020 to 2024
    • Current and Future Market Size Value (USD Million) Analysis and Forecast By Product Type, 2025 to 2035
      • Serums
      • Creams/lotions
      • Gels
      • Masks
    • Y-o-Y Growth Trend Analysis By Product Type, 2020 to 2024
    • Absolute $ Opportunity Analysis By Product Type, 2025 to 2035
  9. Global Market Analysis 2020 to 2024 and Forecast 2025 to 2035, By Channel
    • Introduction / Key Findings
    • Historical Market Size Value (USD Million) Analysis By Channel, 2020 to 2024
    • Current and Future Market Size Value (USD Million) Analysis and Forecast By Channel, 2025 to 2035
      • E-commerce
      • Pharmacies
      • Specialty retail
      • Mass retail
    • Y-o-Y Growth Trend Analysis By Channel, 2020 to 2024
    • Absolute $ Opportunity Analysis By Channel, 2025 to 2035
  10. Global Market Analysis 2020 to 2024 and Forecast 2025 to 2035, By Claim
    • Introduction / Key Findings
    • Historical Market Size Value (USD Million) Analysis By Claim, 2020 to 2024
    • Current and Future Market Size Value (USD Million) Analysis and Forecast By Claim, 2025 to 2035
      • Sustainable sourcing
      • Natural/organic
      • Vegan
      • Clean-label
    • Y-o-Y Growth Trend Analysis By Claim, 2020 to 2024
    • Absolute $ Opportunity Analysis By Claim, 2025 to 2035
  11. Global Market Analysis 2020 to 2024 and Forecast 2025 to 2035, By Region
    • Introduction
    • Historical Market Size Value (USD Million) Analysis By Region, 2020 to 2024
    • Current Market Size Value (USD Million) Analysis and Forecast By Region, 2025 to 2035
      • North America
      • Latin America
      • Europe
      • East Asia
      • South Asia & Pacific
      • Middle East and Africa
    • Market Attractiveness Analysis By Region
  12. North America Market Analysis 2020 to 2024 and Forecast 2025 to 2035, By Country
    • Historical Market Size Value (USD Million) Trend Analysis By Market Taxonomy, 2020 to 2024
    • Market Size Value (USD Million) Forecast By Market Taxonomy, 2025 to 2035
      • By Country
        • USA
        • Canada
      • By Source
      • By Function
      • By Product Type
      • By Channel
      • By Claim
    • Market Attractiveness Analysis
      • By Country
      • By Source
      • By Function
      • By Product Type
      • By Channel
      • By Claim
    • Key Takeaways
  13. Latin America Market Analysis 2020 to 2024 and Forecast 2025 to 2035, By Country
    • Historical Market Size Value (USD Million) Trend Analysis By Market Taxonomy, 2020 to 2024
    • Market Size Value (USD Million) Forecast By Market Taxonomy, 2025 to 2035
      • By Country
        • Brazil
        • Mexico
        • Colombia
        • Rest of Latin America
      • By Source
      • By Function
      • By Product Type
      • By Channel
      • By Claim
    • Market Attractiveness Analysis
      • By Country
      • By Source
      • By Function
      • By Product Type
      • By Channel
      • By Claim
    • Key Takeaways
  14. Europe Market Analysis 2020 to 2024 and Forecast 2025 to 2035, By Country
    • Historical Market Size Value (USD Million) Trend Analysis By Market Taxonomy, 2020 to 2024
    • Market Size Value (USD Million) Forecast By Market Taxonomy, 2025 to 2035
      • By Country
        • Germany
        • UK
        • France
        • Italy
        • Spain
        • Belgium
        • Netherlands
        • Nordic
        • Switzerland
        • Russia
        • Poland
        • Rest of Europe
      • By Source
      • By Function
      • By Product Type
      • By Channel
      • By Claim
    • Market Attractiveness Analysis
      • By Country
      • By Source
      • By Function
      • By Product Type
      • By Channel
      • By Claim
    • Key Takeaways
  15. East Asia Market Analysis 2020 to 2024 and Forecast 2025 to 2035, By Country
    • Historical Market Size Value (USD Million) Trend Analysis By Market Taxonomy, 2020 to 2024
    • Market Size Value (USD Million) Forecast By Market Taxonomy, 2025 to 2035
      • By Country
        • China
        • Japan
        • South Korea
      • By Source
      • By Function
      • By Product Type
      • By Channel
      • By Claim
    • Market Attractiveness Analysis
      • By Country
      • By Source
      • By Function
      • By Product Type
      • By Channel
      • By Claim
    • Key Takeaways
  16. South Asia & Pacific Market Analysis 2020 to 2024 and Forecast 2025 to 2035, By Country
    • Historical Market Size Value (USD Million) Trend Analysis By Market Taxonomy, 2020 to 2024
    • Market Size Value (USD Million) Forecast By Market Taxonomy, 2025 to 2035
      • By Country
        • India
        • Thailand
        • Malaysia
        • Indonesia
        • Singapore
        • Vietnam
        • Australia
        • New Zealand
        • Rest of South Asia
      • By Source
      • By Function
      • By Product Type
      • By Channel
      • By Claim
    • Market Attractiveness Analysis
      • By Country
      • By Source
      • By Function
      • By Product Type
      • By Channel
      • By Claim
    • Key Takeaways
  17. Middle East and Africa Market Analysis 2020 to 2024 and Forecast 2025 to 2035, By Country
    • Historical Market Size Value (USD Million) Trend Analysis By Market Taxonomy, 2020 to 2024
    • Market Size Value (USD Million) Forecast By Market Taxonomy, 2025 to 2035
      • By Country
        • Turkey
        • UAE
        • Saudi Arabia
        • Israel
        • Other GCC Countries
        • North Africa
        • South Africa
      • By Source
      • By Function
      • By Product Type
      • By Channel
      • By Claim
    • Market Attractiveness Analysis
      • By Country
      • By Source
      • By Function
      • By Product Type
      • By Channel
      • By Claim
    • Key Takeaways
  18. Key Countries Market Analysis
    • USA
      • Pricing Analysis
      • Market Share Analysis, 2024
        • By Source
        • By Function
        • By Product Type
        • By Channel
        • By Claim
    • Canada
      • Pricing Analysis
      • Market Share Analysis, 2024
        • By Source
        • By Function
        • By Product Type
        • By Channel
        • By Claim
    • Mexico
      • Pricing Analysis
      • Market Share Analysis, 2024
        • By Source
        • By Function
        • By Product Type
        • By Channel
        • By Claim
    • Brazil
      • Pricing Analysis
      • Market Share Analysis, 2024
        • By Source
        • By Function
        • By Product Type
        • By Channel
        • By Claim
    • Germany
      • Pricing Analysis
      • Market Share Analysis, 2024
        • By Source
        • By Function
        • By Product Type
        • By Channel
        • By Claim
    • UK
      • Pricing Analysis
      • Market Share Analysis, 2024
        • By Source
        • By Function
        • By Product Type
        • By Channel
        • By Claim
    • Italy
      • Pricing Analysis
      • Market Share Analysis, 2024
        • By Source
        • By Function
        • By Product Type
        • By Channel
        • By Claim
    • Spain
      • Pricing Analysis
      • Market Share Analysis, 2024
        • By Source
        • By Function
        • By Product Type
        • By Channel
        • By Claim
    • France
      • Pricing Analysis
      • Market Share Analysis, 2024
        • By Source
        • By Function
        • By Product Type
        • By Channel
        • By Claim
    • India
      • Pricing Analysis
      • Market Share Analysis, 2024
        • By Source
        • By Function
        • By Product Type
        • By Channel
        • By Claim
    • Australia & New Zealand
      • Pricing Analysis
      • Market Share Analysis, 2024
        • By Source
        • By Function
        • By Product Type
        • By Channel
        • By Claim
    • China
      • Pricing Analysis
      • Market Share Analysis, 2024
        • By Source
        • By Function
        • By Product Type
        • By Channel
        • By Claim
    • Japan
      • Pricing Analysis
      • Market Share Analysis, 2024
        • By Source
        • By Function
        • By Product Type
        • By Channel
        • By Claim
    • South Korea
      • Pricing Analysis
      • Market Share Analysis, 2024
        • By Source
        • By Function
        • By Product Type
        • By Channel
        • By Claim
    • Russia
      • Pricing Analysis
      • Market Share Analysis, 2024
        • By Source
        • By Function
        • By Product Type
        • By Channel
        • By Claim
    • Poland
      • Pricing Analysis
      • Market Share Analysis, 2024
        • By Source
        • By Function
        • By Product Type
        • By Channel
        • By Claim
    • Hungary
      • Pricing Analysis
      • Market Share Analysis, 2024
        • By Source
        • By Function
        • By Product Type
        • By Channel
        • By Claim
    • Kingdom of Saudi Arabia
      • Pricing Analysis
      • Market Share Analysis, 2024
        • By Source
        • By Function
        • By Product Type
        • By Channel
        • By Claim
    • South Africa
      • Pricing Analysis
      • Market Share Analysis, 2024
        • By Source
        • By Function
        • By Product Type
        • By Channel
        • By Claim
  19. Market Structure Analysis
    • Competition Dashboard
    • Competition Benchmarking
    • Market Share Analysis of Top Players
      • By Regional
      • By Source
      • By Function
      • By Product Type
      • By Channel
      • By Claim
  20. Competition Analysis
    • Competition Deep Dive
      • Clariant
        • Overview
        • Product Portfolio
        • Profitability by Market Segments (Product/Age /Sales Channel/Region)
        • Sales Footprint
        • Strategy Overview
        • BASF
        • Ashland
        • Croda
        • Seppic
        • Givaudan
        • Bio Botanica
        • Aloecorp
        • Sabinsa
        • Desert Essence
    • Assumptions & Acronyms Used
    • Research Methodology

List of Tables

  • Table 1: Global Market Value (USD Million) Forecast by Region, 2020-2035
  • Table 2: Global Market Value (USD Million) Forecast by Source, 2020-2035
  • Table 3: Global Market Value (USD Million) Forecast by Function, 2020-2035
  • Table 4: Global Market Value (USD Million) Forecast by Product Type, 2020-2035
  • Table 5: Global Market Value (USD Million) Forecast by Channel, 2020-2035
  • Table 6: Global Market Value (USD Million) Forecast by Claim, 2020-2035
  • Table 7: North America Market Value (USD Million) Forecast by Country, 2020-2035
  • Table 8: North America Market Value (USD Million) Forecast by Source, 2020-2035
  • Table 9: North America Market Value (USD Million) Forecast by Function, 2020-2035
  • Table 10: North America Market Value (USD Million) Forecast by Product Type, 2020-2035
  • Table 11: North America Market Value (USD Million) Forecast by Channel, 2020-2035
  • Table 12: North America Market Value (USD Million) Forecast by Claim, 2020-2035
  • Table 13: Latin America Market Value (USD Million) Forecast by Country, 2020-2035
  • Table 14: Latin America Market Value (USD Million) Forecast by Source, 2020-2035
  • Table 15: Latin America Market Value (USD Million) Forecast by Function, 2020-2035
  • Table 16: Latin America Market Value (USD Million) Forecast by Product Type, 2020-2035
  • Table 17: Latin America Market Value (USD Million) Forecast by Channel, 2020-2035
  • Table 18: Latin America Market Value (USD Million) Forecast by Claim, 2020-2035
  • Table 19: Europe Market Value (USD Million) Forecast by Country, 2020-2035
  • Table 20: Europe Market Value (USD Million) Forecast by Source, 2020-2035
  • Table 21: Europe Market Value (USD Million) Forecast by Function, 2020-2035
  • Table 22: Europe Market Value (USD Million) Forecast by Product Type, 2020-2035
  • Table 23: Europe Market Value (USD Million) Forecast by Channel, 2020-2035
  • Table 24: Europe Market Value (USD Million) Forecast by Claim, 2020-2035
  • Table 25: East Asia Market Value (USD Million) Forecast by Country, 2020-2035
  • Table 26: East Asia Market Value (USD Million) Forecast by Source, 2020-2035
  • Table 27: East Asia Market Value (USD Million) Forecast by Function, 2020-2035
  • Table 28: East Asia Market Value (USD Million) Forecast by Product Type, 2020-2035
  • Table 29: East Asia Market Value (USD Million) Forecast by Channel, 2020-2035
  • Table 30: East Asia Market Value (USD Million) Forecast by Claim, 2020-2035
  • Table 31: South Asia & Pacific Market Value (USD Million) Forecast by Country, 2020-2035
  • Table 32: South Asia & Pacific Market Value (USD Million) Forecast by Source, 2020-2035
  • Table 33: South Asia & Pacific Market Value (USD Million) Forecast by Function, 2020-2035
  • Table 34: South Asia & Pacific Market Value (USD Million) Forecast by Product Type, 2020-2035
  • Table 35: South Asia & Pacific Market Value (USD Million) Forecast by Channel, 2020-2035
  • Table 36: South Asia & Pacific Market Value (USD Million) Forecast by Claim, 2020-2035
  • Table 37: Middle East and Africa Market Value (USD Million) Forecast by Country, 2020-2035
  • Table 38: Middle East and Africa Market Value (USD Million) Forecast by Source, 2020-2035
  • Table 39: Middle East and Africa Market Value (USD Million) Forecast by Function, 2020-2035
  • Table 40: Middle East and Africa Market Value (USD Million) Forecast by Product Type, 2020-2035
  • Table 41: Middle East and Africa Market Value (USD Million) Forecast by Channel, 2020-2035
  • Table 42: Middle East and Africa Market Value (USD Million) Forecast by Claim, 2020-2035

List of Figures

  • Figure 1: Global Market Pricing Analysis
  • Figure 2: Global Market Value (USD Million) Forecast 2020-2035
  • Figure 3: Global Market Value Share and BPS Analysis by Source, 2025 and 2035
  • Figure 4: Global Market Y-o-Y Growth Comparison by Source, 2025-2035
  • Figure 5: Global Market Attractiveness Analysis by Source
  • Figure 6: Global Market Value Share and BPS Analysis by Function, 2025 and 2035
  • Figure 7: Global Market Y-o-Y Growth Comparison by Function, 2025-2035
  • Figure 8: Global Market Attractiveness Analysis by Function
  • Figure 9: Global Market Value Share and BPS Analysis by Product Type, 2025 and 2035
  • Figure 10: Global Market Y-o-Y Growth Comparison by Product Type, 2025-2035
  • Figure 11: Global Market Attractiveness Analysis by Product Type
  • Figure 12: Global Market Value Share and BPS Analysis by Channel, 2025 and 2035
  • Figure 13: Global Market Y-o-Y Growth Comparison by Channel, 2025-2035
  • Figure 14: Global Market Attractiveness Analysis by Channel
  • Figure 15: Global Market Value Share and BPS Analysis by Claim, 2025 and 2035
  • Figure 16: Global Market Y-o-Y Growth Comparison by Claim, 2025-2035
  • Figure 17: Global Market Attractiveness Analysis by Claim
  • Figure 18: Global Market Value (USD Million) Share and BPS Analysis by Region, 2025 and 2035
  • Figure 19: Global Market Y-o-Y Growth Comparison by Region, 2025-2035
  • Figure 20: Global Market Attractiveness Analysis by Region
  • Figure 21: North America Market Incremental $ Opportunity, 2025-2035
  • Figure 22: Latin America Market Incremental $ Opportunity, 2025-2035
  • Figure 23: Europe Market Incremental $ Opportunity, 2025-2035
  • Figure 24: East Asia Market Incremental $ Opportunity, 2025-2035
  • Figure 25: South Asia & Pacific Market Incremental $ Opportunity, 2025-2035
  • Figure 26: Middle East and Africa Market Incremental $ Opportunity, 2025-2035
  • Figure 27: North America Market Value Share and BPS Analysis by Country, 2025 and 2035
  • Figure 28: North America Market Value Share and BPS Analysis by Source, 2025 and 2035
  • Figure 29: North America Market Y-o-Y Growth Comparison by Source, 2025-2035
  • Figure 30: North America Market Attractiveness Analysis by Source
  • Figure 31: North America Market Value Share and BPS Analysis by Function, 2025 and 2035
  • Figure 32: North America Market Y-o-Y Growth Comparison by Function, 2025-2035
  • Figure 33: North America Market Attractiveness Analysis by Function
  • Figure 34: North America Market Value Share and BPS Analysis by Product Type, 2025 and 2035
  • Figure 35: North America Market Y-o-Y Growth Comparison by Product Type, 2025-2035
  • Figure 36: North America Market Attractiveness Analysis by Product Type
  • Figure 37: North America Market Value Share and BPS Analysis by Channel, 2025 and 2035
  • Figure 38: North America Market Y-o-Y Growth Comparison by Channel, 2025-2035
  • Figure 39: North America Market Attractiveness Analysis by Channel
  • Figure 40: North America Market Value Share and BPS Analysis by Claim, 2025 and 2035
  • Figure 41: North America Market Y-o-Y Growth Comparison by Claim, 2025-2035
  • Figure 42: North America Market Attractiveness Analysis by Claim
  • Figure 43: Latin America Market Value Share and BPS Analysis by Country, 2025 and 2035
  • Figure 44: Latin America Market Value Share and BPS Analysis by Source, 2025 and 2035
  • Figure 45: Latin America Market Y-o-Y Growth Comparison by Source, 2025-2035
  • Figure 46: Latin America Market Attractiveness Analysis by Source
  • Figure 47: Latin America Market Value Share and BPS Analysis by Function, 2025 and 2035
  • Figure 48: Latin America Market Y-o-Y Growth Comparison by Function, 2025-2035
  • Figure 49: Latin America Market Attractiveness Analysis by Function
  • Figure 50: Latin America Market Value Share and BPS Analysis by Product Type, 2025 and 2035
  • Figure 51: Latin America Market Y-o-Y Growth Comparison by Product Type, 2025-2035
  • Figure 52: Latin America Market Attractiveness Analysis by Product Type
  • Figure 53: Latin America Market Value Share and BPS Analysis by Channel, 2025 and 2035
  • Figure 54: Latin America Market Y-o-Y Growth Comparison by Channel, 2025-2035
  • Figure 55: Latin America Market Attractiveness Analysis by Channel
  • Figure 56: Latin America Market Value Share and BPS Analysis by Claim, 2025 and 2035
  • Figure 57: Latin America Market Y-o-Y Growth Comparison by Claim, 2025-2035
  • Figure 58: Latin America Market Attractiveness Analysis by Claim
  • Figure 59: Europe Market Value Share and BPS Analysis by Country, 2025 and 2035
  • Figure 60: Europe Market Value Share and BPS Analysis by Source, 2025 and 2035
  • Figure 61: Europe Market Y-o-Y Growth Comparison by Source, 2025-2035
  • Figure 62: Europe Market Attractiveness Analysis by Source
  • Figure 63: Europe Market Value Share and BPS Analysis by Function, 2025 and 2035
  • Figure 64: Europe Market Y-o-Y Growth Comparison by Function, 2025-2035
  • Figure 65: Europe Market Attractiveness Analysis by Function
  • Figure 66: Europe Market Value Share and BPS Analysis by Product Type, 2025 and 2035
  • Figure 67: Europe Market Y-o-Y Growth Comparison by Product Type, 2025-2035
  • Figure 68: Europe Market Attractiveness Analysis by Product Type
  • Figure 69: Europe Market Value Share and BPS Analysis by Channel, 2025 and 2035
  • Figure 70: Europe Market Y-o-Y Growth Comparison by Channel, 2025-2035
  • Figure 71: Europe Market Attractiveness Analysis by Channel
  • Figure 72: Europe Market Value Share and BPS Analysis by Claim, 2025 and 2035
  • Figure 73: Europe Market Y-o-Y Growth Comparison by Claim, 2025-2035
  • Figure 74: Europe Market Attractiveness Analysis by Claim
  • Figure 75: East Asia Market Value Share and BPS Analysis by Country, 2025 and 2035
  • Figure 76: East Asia Market Value Share and BPS Analysis by Source, 2025 and 2035
  • Figure 77: East Asia Market Y-o-Y Growth Comparison by Source, 2025-2035
  • Figure 78: East Asia Market Attractiveness Analysis by Source
  • Figure 79: East Asia Market Value Share and BPS Analysis by Function, 2025 and 2035
  • Figure 80: East Asia Market Y-o-Y Growth Comparison by Function, 2025-2035
  • Figure 81: East Asia Market Attractiveness Analysis by Function
  • Figure 82: East Asia Market Value Share and BPS Analysis by Product Type, 2025 and 2035
  • Figure 83: East Asia Market Y-o-Y Growth Comparison by Product Type, 2025-2035
  • Figure 84: East Asia Market Attractiveness Analysis by Product Type
  • Figure 85: East Asia Market Value Share and BPS Analysis by Channel, 2025 and 2035
  • Figure 86: East Asia Market Y-o-Y Growth Comparison by Channel, 2025-2035
  • Figure 87: East Asia Market Attractiveness Analysis by Channel
  • Figure 88: East Asia Market Value Share and BPS Analysis by Claim, 2025 and 2035
  • Figure 89: East Asia Market Y-o-Y Growth Comparison by Claim, 2025-2035
  • Figure 90: East Asia Market Attractiveness Analysis by Claim
  • Figure 91: South Asia & Pacific Market Value Share and BPS Analysis by Country, 2025 and 2035
  • Figure 92: South Asia & Pacific Market Value Share and BPS Analysis by Source, 2025 and 2035
  • Figure 93: South Asia & Pacific Market Y-o-Y Growth Comparison by Source, 2025-2035
  • Figure 94: South Asia & Pacific Market Attractiveness Analysis by Source
  • Figure 95: South Asia & Pacific Market Value Share and BPS Analysis by Function, 2025 and 2035
  • Figure 96: South Asia & Pacific Market Y-o-Y Growth Comparison by Function, 2025-2035
  • Figure 97: South Asia & Pacific Market Attractiveness Analysis by Function
  • Figure 98: South Asia & Pacific Market Value Share and BPS Analysis by Product Type, 2025 and 2035
  • Figure 99: South Asia & Pacific Market Y-o-Y Growth Comparison by Product Type, 2025-2035
  • Figure 100: South Asia & Pacific Market Attractiveness Analysis by Product Type
  • Figure 101: South Asia & Pacific Market Value Share and BPS Analysis by Channel, 2025 and 2035
  • Figure 102: South Asia & Pacific Market Y-o-Y Growth Comparison by Channel, 2025-2035
  • Figure 103: South Asia & Pacific Market Attractiveness Analysis by Channel
  • Figure 104: South Asia & Pacific Market Value Share and BPS Analysis by Claim, 2025 and 2035
  • Figure 105: South Asia & Pacific Market Y-o-Y Growth Comparison by Claim, 2025-2035
  • Figure 106: South Asia & Pacific Market Attractiveness Analysis by Claim
  • Figure 107: Middle East and Africa Market Value Share and BPS Analysis by Country, 2025 and 2035
  • Figure 108: Middle East and Africa Market Value Share and BPS Analysis by Source, 2025 and 2035
  • Figure 109: Middle East and Africa Market Y-o-Y Growth Comparison by Source, 2025-2035
  • Figure 110: Middle East and Africa Market Attractiveness Analysis by Source
  • Figure 111: Middle East and Africa Market Value Share and BPS Analysis by Function, 2025 and 2035
  • Figure 112: Middle East and Africa Market Y-o-Y Growth Comparison by Function, 2025-2035
  • Figure 113: Middle East and Africa Market Attractiveness Analysis by Function
  • Figure 114: Middle East and Africa Market Value Share and BPS Analysis by Product Type, 2025 and 2035
  • Figure 115: Middle East and Africa Market Y-o-Y Growth Comparison by Product Type, 2025-2035
  • Figure 116: Middle East and Africa Market Attractiveness Analysis by Product Type
  • Figure 117: Middle East and Africa Market Value Share and BPS Analysis by Channel, 2025 and 2035
  • Figure 118: Middle East and Africa Market Y-o-Y Growth Comparison by Channel, 2025-2035
  • Figure 119: Middle East and Africa Market Attractiveness Analysis by Channel
  • Figure 120: Middle East and Africa Market Value Share and BPS Analysis by Claim, 2025 and 2035
  • Figure 121: Middle East and Africa Market Y-o-Y Growth Comparison by Claim, 2025-2035
  • Figure 122: Middle East and Africa Market Attractiveness Analysis by Claim
  • Figure 123: Global Market - Tier Structure Analysis
  • Figure 124: Global Market - Company Share Analysis

Frequently Asked Questions

How big is the Resilient Desert Plant Extracts Market in 2025?

The global Resilient Desert Plant Extracts Market is estimated to be valued at USD 1,053.1 million in 2025.

What will be the size of the Resilient Desert Plant Extracts Market in 2035?

The market size for the Resilient Desert Plant Extracts Market is projected to reach USD 3,452.7 million by 2035.

How much will be the Resilient Desert Plant Extracts Market growth between 2025 and 2035?

The Resilient Desert Plant Extracts Market is expected to grow at a CAGR of 12.6% between 2025 and 2035.

What are the key product types in the Resilient Desert Plant Extracts Market?

The key product types in the Resilient Desert Plant Extracts Market are creams/lotions and other formats such as gels, masks, and serums.

Which functional segment will contribute significant share in the Resilient Desert Plant Extracts Market in 2025?

In terms of function, hydration is expected to command 52.5% share in the Resilient Desert Plant Extracts Market in 2025.

Explore Similar Insights

Future Market Insights

Resilient Desert Plant Extracts Market

Chat With

MaRIA

Hi There, I am MaRIA, Your Market Research Intelligence Assistant. How may I help you?